Supercharge Your Innovation With Domain-Expert AI Agents!

A visual display method and system for multi-dimensional data

A multi-dimensional data and display system technology, applied in the field of data display, to achieve the effect of clear display results, strong visibility, and simple and convenient display methods

Active Publication Date: 2020-11-06
中云开源数据技术(上海)有限公司
View PDF7 Cites 0 Cited by
  • Summary
  • Abstract
  • Description
  • Claims
  • Application Information

AI Technical Summary

Problems solved by technology

Therefore, the main challenge associated with visualization techniques lies in implementing methods for visualizing high-dimensional data

Method used


Image

  • A visual display method and system for multi-dimensional data
  • A visual display method and system for multi-dimensional data
  • A visual display method and system for multi-dimensional data

Examples


Embodiment 1

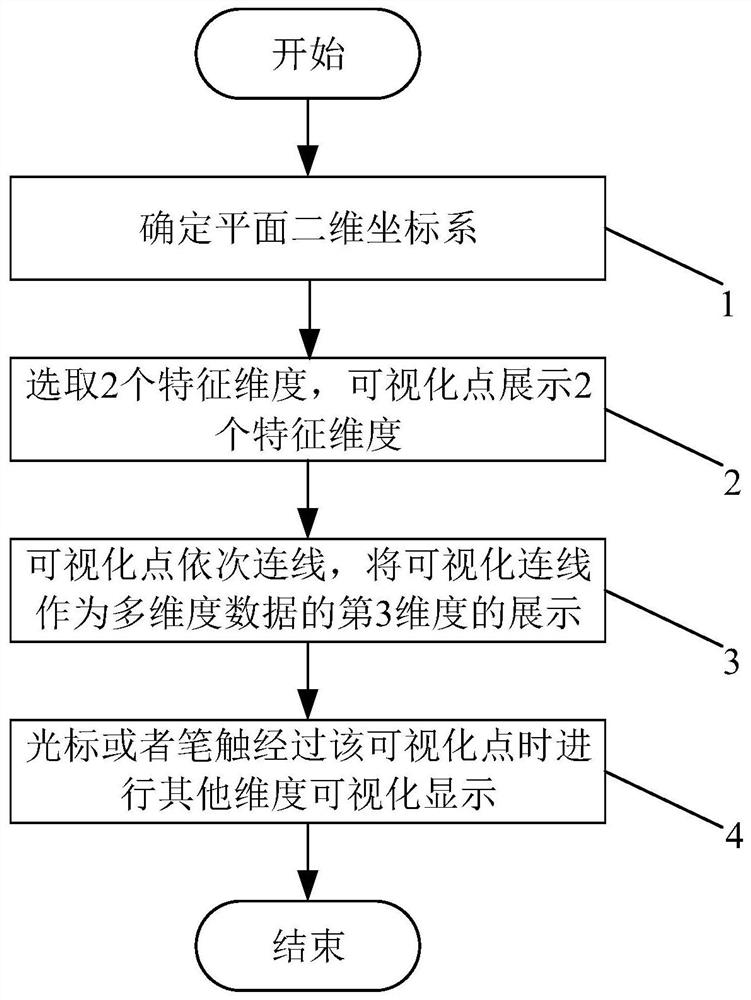
[0030] Such as figure 1 As shown, a visual display method of multi-dimensional data is used for the display of multiple sets of multi-dimensional data. Each data record of each set of multi-dimensional data contains multiple dimensions, and these dimensions can contain discrete data, such as "category" , can also contain continuous data, such as "density value".

[0031] Specifically, the visual display method of multi-dimensional data includes the following steps:

[0032] (1) Determine the plane two-dimensional coordinate system;

[0033] (2) Select two feature dimensions in the multi-dimensional data, and determine the position of the multi-dimensional data in the plane two-dimensional coordinate system according to the data values ​​corresponding to the two feature dimensions, and represent it with a visualization point. The display of two dimensions;

[0034] (3) Connect the visualization points sequentially, and use the visualization connection as the third dimension ...

Embodiment 2

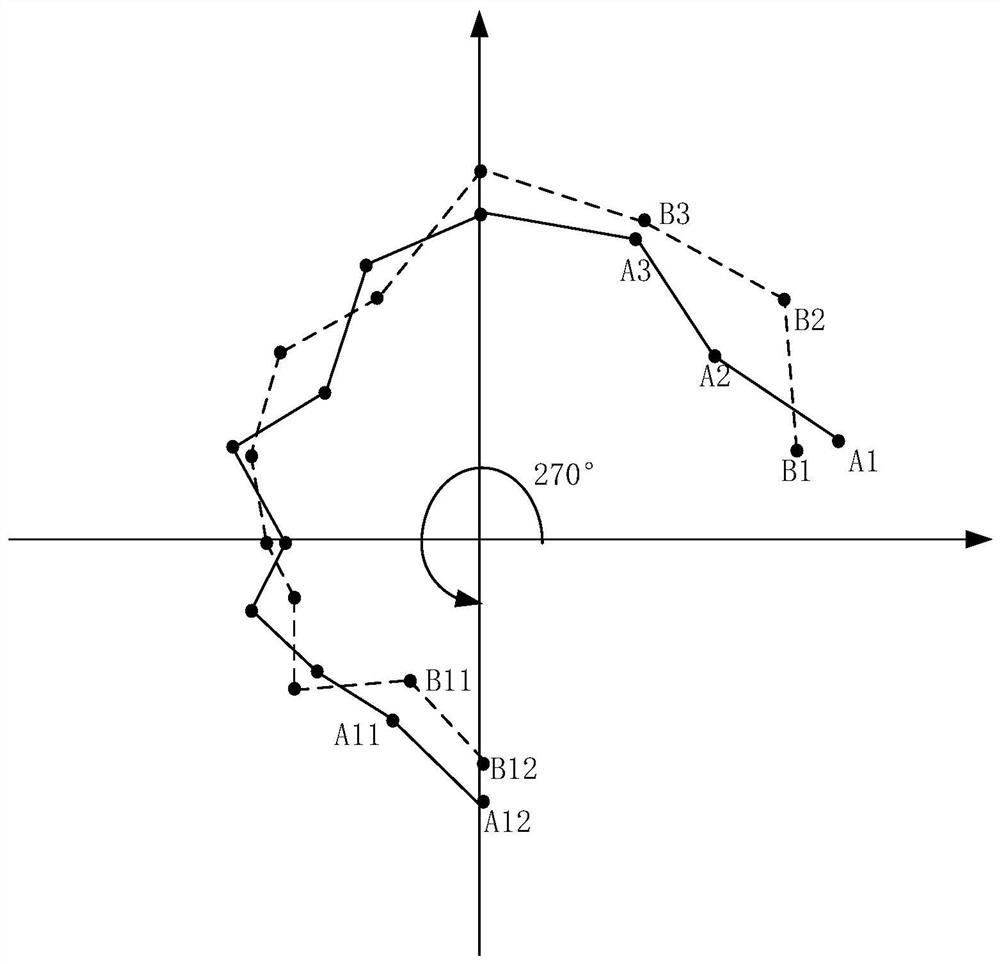
[0052] In this embodiment, the included angles between all the visualization points and the origin are displayed within the range of 270°, that is, the visualization points are only displayed within the range of 270° in the clockwise direction during data presentation. The rest are the same as in Example 1. In this example, the display results of the 3-dimensional commodity sales data in Table 1 are as follows image 3 shown.


PUM


Abstract

The present invention relates to a multi-dimensional data visualization display method and system. The method comprises the following steps: (1) determining a plane two-dimensional coordinate system; (2) selecting two characteristic dimensions in multi-dimensional data, according to data values corresponding to two characteristic dimensions, determining the positions of multi-dimensional data in the plane two-dimensional coordinate system, using visual points to represent the positions, and taking the positions of the visual point as the display of the two dimensions of the multi-dimensional data; (3) connecting the visual points one by one, and taking the visual connection as the display of the third dimension of the multi-dimensional data; and (4) obtaining information of all dimensions of the multi-dimensional data corresponding to each visual point and displaying related information corresponding to the visual point when a cursor or a brush stroke passes through the visual point. Compared with the prior art, the display method of the present invention is simple and convenient, the display result is clear, and the visibility is strong.

Description

technical field [0001] The present invention relates to a data display method and system, in particular to a multi-dimensional data visual display method and system. Background technique [0002] In modern society, the amount of data is increasing exponentially, and the visualization of data is becoming more and more important. For a large amount of data, people need to convey the information contained in the data in an accurate and effective way. In a case where the number of dimensions of data is more than 3, the data cannot be directly visualized using a scatter plot or the like. Therefore, a major challenge associated with visualization techniques lies in implementing methods for visualizing high-dimensional data. Contents of the invention [0003] The object of the present invention is to provide a method and system for visually displaying multi-dimensional data in order to overcome the above-mentioned defects in the prior art. [0004] The purpose of the present in...

Claims


Application Information

Patent Timeline
Patent Type & Authority Patents(China)
IPC IPC(8): G06F16/248
CPCG06F16/248
Inventor 陈刚何积丰
Owner 中云开源数据技术(上海)有限公司
Features
  • R&D
  • Intellectual Property
  • Life Sciences
  • Materials
  • Tech Scout
  • Unparalleled Data Quality
  • Higher Quality Content
  • 60% Fewer Hallucinations
Learn More