Distributed visualization system and method

A distributed and command technology, applied in the computer field, can solve the problems of long loading time, slow calculation speed, poor controllability, etc., and achieve the effect of perfecting actual operation, improving flexibility and loading speed

Inactive Publication Date: 2018-03-30
INST OF AUTOMATION CHINESE ACAD OF SCI
View PDF3 Cites 0 Cited by
  • Summary
  • Abstract
  • Description
  • Claims
  • Application Information

AI Technical Summary

Problems solved by technology

The main problem with the current visualization technology is that when the amount of data is large, the loading time will be too long, the calculation speed will be slow, and the controllability will be poor. For example, when you want to add or delete modules, you need to modify the entire framework.

Method used


Image

  • Distributed visualization system and method
  • Distributed visualization system and method
  • Distributed visualization system and method

Examples


Embodiment Construction

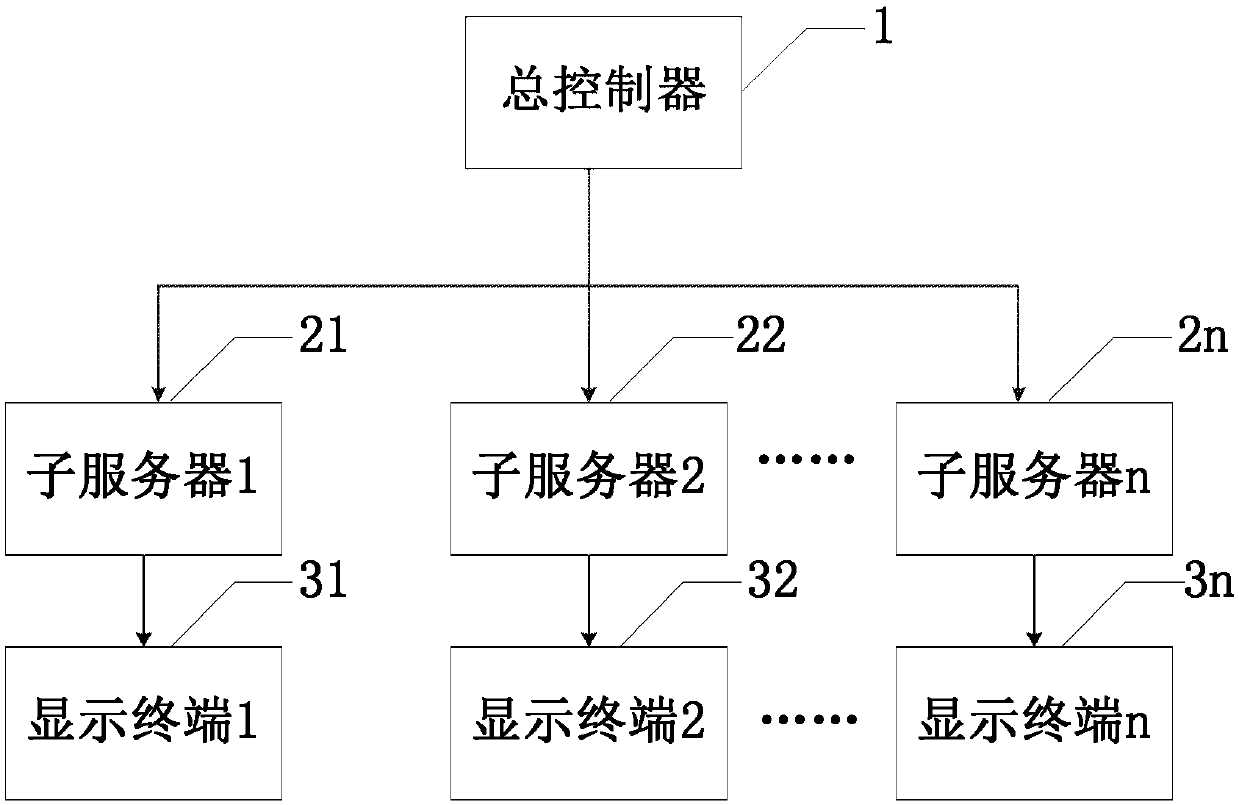
[0044] At present, visualization technology is developing rapidly, but there are problems such as too long loading time, slow calculation speed, and poor partial controllability when rendering when the amount of data is large. In view of this, the present invention provides a distributed visualization The system and method, by splitting a visualization task into multiple subtasks or processing multiple visualization tasks by multiple subservers, make the data independent of each other, improve the flexibility and loading speed of data display, and are especially suitable for the visualization of big data.

[0045] In order to make the object, technical solution and advantages of the present invention clearer, the present invention will be described in further detail below in conjunction with specific embodiments and with reference to the accompanying drawings.

[0046] figure 1 It is a schematic structural diagram of a distributed visualization system according to an embodimen...


PUM


Abstract

A distributed visualization system comprises: a master controller for converting a user's operations into corresponding commands and outputting the first ones, associated with display terminals, of the commands respectively to sub-servers connected with the display terminals; the multiple sub-servers having one ends connected with a master server and the other ends connected with the multiple display terminals in one-to-one manner, wherein the sub-servers are used for determining second commands according to the first commands; the multiple display terminals for executing corresponding operations according to the second commands and displaying operational results of the operations. The distributed visualization system is particularly suitable for visualization of big data, is capable of dividing one visualization task into multiple sub-tasks to avoid the need for refreshing a whole large screen upon update of part of data, is also capable of executing multiple independent visualizationtasks so that visualization data are mutually independent and data displaying flexibility and loading speed are increased.

Description

technical field [0001] The present invention relates to the field of computer technology, in particular to a distributed visualization system and method. Background technique [0002] As information sources become more and more diverse, the amount of data generated is also increasing dramatically, which gradually exceeds the ability of the human brain to analyze these big data. Initially, due to the lack of tools and methods for effective analysis of big data, a large amount of data and scientific calculations were wasted, which seriously hindered the progress of scientific research. For this reason, the American Computer Imaging Professional Committee proposed a solution-visualization. Visualization converts data into graphics, which is more intuitive and concise, giving people unexpected insights, and fundamentally changing the way scientists study in many fields. Visualization was quickly adopted by science and other engineering fields as a technique for analyzing and in...

Claims


Application Information

Patent Timeline
IPC IPC(8): H04L12/26G06F3/0484G06F3/0486
CPCH04L43/045G06F3/0484G06F3/0486G06F2203/04806
Inventor 王亮吴书白平
Owner INST OF AUTOMATION CHINESE ACAD OF SCI
Why Eureka
Try Eureka