A Method for Evaluating Coal and Biomass Coke Reactivity Using Thermogravimetric Analyzer
A technology of thermogravimetric analyzer and biomass coke, which is applied in the field of energy and environment, can solve the problems of increased resistance, large usage (tens to hundreds of grams, complex test equipment, etc.), and achieve the effect of avoiding changes
- Summary
- Abstract
- Description
- Claims
- Application Information
AI Technical Summary
Problems solved by technology
Method used
Image
Examples
Embodiment 1
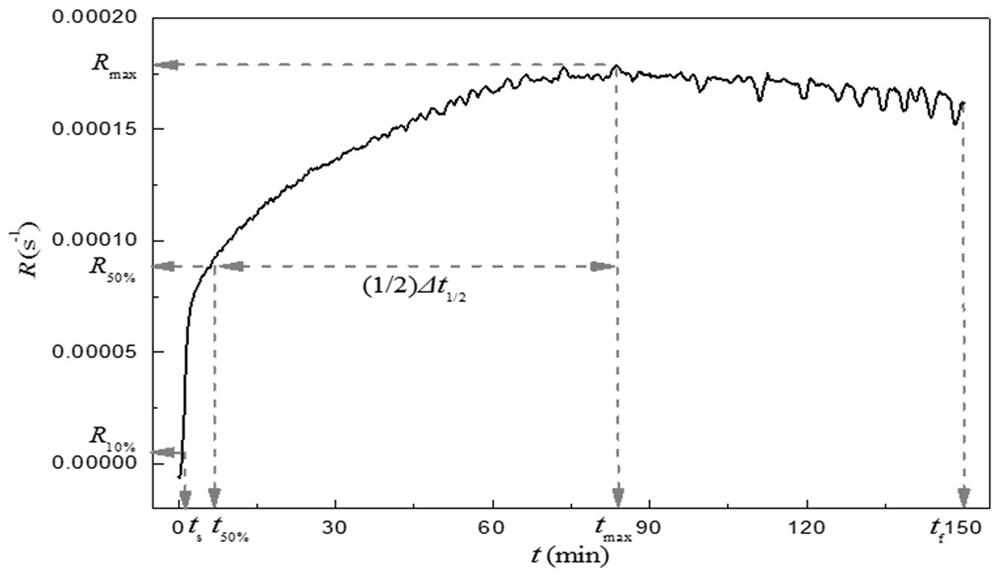
[0046] The combustion specific reaction rate curve of a highly reactive coal char is as follows figure 1 shown. With the prolongation of the reaction time, the curve generally showed a trend of first increasing and then decreasing, and the specific reaction rate value showed a unimodal distribution, and the peak was broad, covering most of the time of the reactivity test stage. The curve of this type of shape is the most common type obtained by testing according to the specific operation steps (1)-(6) described above in the present invention. For example: biomass coke or coal char prepared by pyrolysis at 400-500°C; for this type of specific reaction rate curve, complete the specific operation steps (7) described before the present invention according to the following method:
[0047] (a) Find the maximum specific reaction rate in the main reaction stage R max and its corresponding time t max ;
[0048] (b) Find the reaction onset time t s , Onset time of strong react...
Embodiment 2
[0052] The combustion specific reaction rate curve of a low-reactivity coal char is as follows figure 2shown. As the reaction time prolongs, the curve generally presents a trend of first increasing and then decreasing, then increasing and then decreasing, and the specific reaction rate value shows a bimodal distribution, in which the first peak is sharp and narrow, while the second peak is broad , the latter covering most of the reactive testing phase. For example: deashed coal char prepared by pyrolysis at 400-500°C; the shape of this type of curve is quite special, revealing that the sample contains two components with large differences in reactivity: the first one is highly active and contains The lower aliphatic component is the source of the sharper and narrower specific reaction rate peak; the second is the aromatic component with lower activity and higher content, which is the source of the broader specific reaction rate peak. Since the latter component is the main c...
Embodiment 3
[0059] The combustion specific reaction rate curve of a low-reactivity coal char is as follows image 3 shown. With the prolongation of the reaction time, the curve generally showed a trend of increasing first and then decreasing, and the specific reaction rate value showed a unimodal distribution, and the peak was broad, covering most of the time in the reactivity test stage. However, with figure 1 Unlike the type of curves shown, these curves have a very small decline in the later stages of the reaction. For example: coal char produced by pyrolysis at 750-850°C; curves of this type are more common for low-reactivity coke produced at higher temperatures. For the specific reaction rate curve of this type, complete the specific operation steps (7) described before the present invention according to the following method:
[0060] (a) Find the maximum specific reaction rate in the main reaction stage R max and its corresponding time t max ;
[0061] (b) Find the reaction...
PUM
| Property | Measurement | Unit |
|---|---|---|
| diameter | aaaaa | aaaaa |
Abstract
Description
Claims
Application Information
 - R&D
- Intellectual Property
- Life Sciences
- Materials
- Tech Scout
- Unparalleled Data Quality
- Higher Quality Content
- 60% Fewer Hallucinations
Browse by: Latest US Patents, China's latest patents, Technical Efficacy Thesaurus, Application Domain, Technology Topic, Popular Technical Reports.
© 2025 PatSnap. All rights reserved.Legal|Privacy policy|Modern Slavery Act Transparency Statement|Sitemap|About US| Contact US: help@patsnap.com


