Data visualization method and device

A visualization group and data technology, applied in the field of visualization, can solve the problems of different styles of display analysis methods, occupancy, etc., to achieve the effects of improving design and development efficiency, realizing combination and layout, and shortening the delivery cycle

Inactive Publication Date: 2018-10-09
LONGSHINE TECH
View PDF2 Cites 26 Cited by
  • Summary
  • Abstract
  • Description
  • Claims
  • Application Information

AI Technical Summary

Problems solved by technology

However, many front-end report technologies usually focus on rendering and ignore the framework, and can only be used as tools. Each of them stipulates its own data structure. Users must do their own query and analysis, and then adapt the data to the structure required by these tools. During the process, the tool can only help users solve the report rendering process. If these processes are left to the developers themselves, it will often lead to different styles of display and analysis methods, and subsequent maintenance and extended analysis will take up a large part of the work. In order to reduce the workload and improve the design and development efficiency of big data projects in the process of performing display analysis, there is an urgent need for a data visualization display method

Method used


Image

  • Data visualization method and device
  • Data visualization method and device
  • Data visualization method and device

Examples


Embodiment Construction

[0036] In order to make the purpose, technical solutions and advantages of the embodiments of the present invention clearer, the technical solutions in the embodiments of the present invention will be clearly and completely described below in conjunction with the drawings in the embodiments of the present invention. Obviously, the described embodiments It is a part of embodiments of the present invention, but not all embodiments. Based on the embodiments of the present invention, all other embodiments obtained by persons of ordinary skill in the art without making creative efforts belong to the protection scope of the present invention.

[0037] The following embodiments of the present invention provide a data visualization method and device.

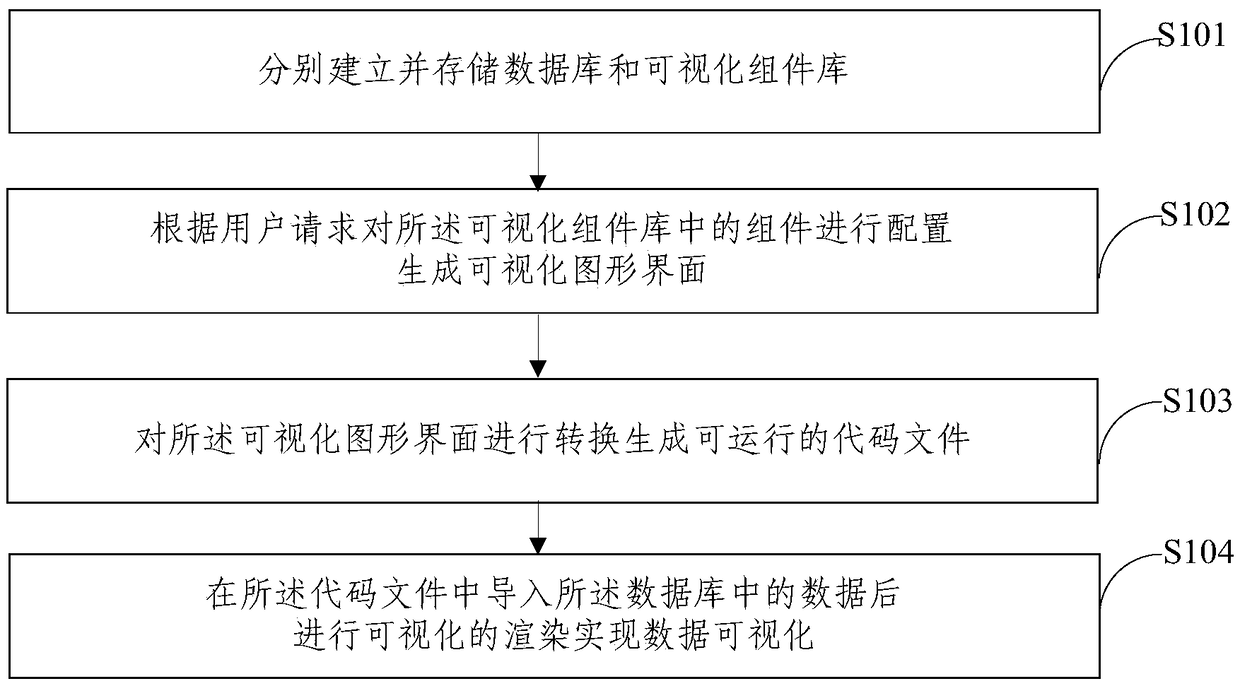
[0038] For a data visualization method provided by the first embodiment of the present invention, see figure 1 , the method specifically includes the following steps:

[0039] S101: Establish and store a database and a visual componen...


PUM


Abstract

The invention provides a data visualization method and device. The method comprises the steps that a database and a visual component library are established and stored respectively; components in thevisual component library are configured according to a user request, and a visual graphical interface is generated; the visual graphical interface is converted to generate an executable code file; after data in the database is imported into the code file, visual rendering is carried out, and data visualization is achieved. The visual graphical interface is generated through configuration of the components in the visual component library, free combination and layout of display interfaces can be realized, and the design and development efficiency of a large data project is improved in the display analysis process; the large data items of the display class can be quickly completed through data visual display, the design, development and delivery period is shortened, and the project cost is reduced.

Description

technical field [0001] The present invention relates to the field of visualization technology, in particular to a data visualization method and device. Background technique [0002] With the advancement of technology, big data analysis is becoming more and more popular. In addition to the problems of massive data calculation and storage, there is another important link that affects product development efficiency and user experience, that is, data visualization. However, many front-end report technologies usually focus on rendering and ignore the framework, and can only be used as tools. Each of them stipulates its own data structure. Users must do their own query and analysis, and then adapt the data to the structure required by these tools. During the process, the tool can only help users solve the report rendering process. If these processes are left to the developers themselves, it will often lead to different styles of display and analysis methods, and subsequent mainten...

Claims


Application Information

Patent Timeline
Patent Type & Authority Applications(China)
IPC IPC(8): G06F8/34G06F8/38G06F17/30
CPCG06F8/34G06F8/38
Inventor 刘建平张营李强王平喜徐长军郑新标焦国云
Owner LONGSHINE TECH
Why Eureka
Try Eureka