Graph automatic identification method of audiometry results

A hearing test and automatic identification technology, which is applied in audiometer, diagnostic recording/measurement, medical science, etc., can solve problems affecting diagnostic analysis, clinicians do not know how to read and interpret, lack of vigilance and protection awareness, etc., to improve diagnosis The effect of precision

Active Publication Date: 2018-10-16
FOSHAN BOZHI MEDICAL TECH CO LTD
View PDF5 Cites 5 Cited by
  • Summary
  • Abstract
  • Description
  • Claims
  • Application Information

AI Technical Summary

Problems solved by technology

At present, the hearing devices on the market display the hearing test results through graphics, that is, the audiogram. To understand the audiogram requires relevant professional knowledge. However, many clinicians may not know how to consult and interpret it. Graphical information is converted into test results written on the hearing report
Generally, the audiogram does not save the data on the computer, which eventually leads to waste of inspection data and affects future diagnostic analysis.
As for the subjects, bec

Method used


Image

  • Graph automatic identification method of audiometry results
  • Graph automatic identification method of audiometry results
  • Graph automatic identification method of audiometry results

Examples


Embodiment 2

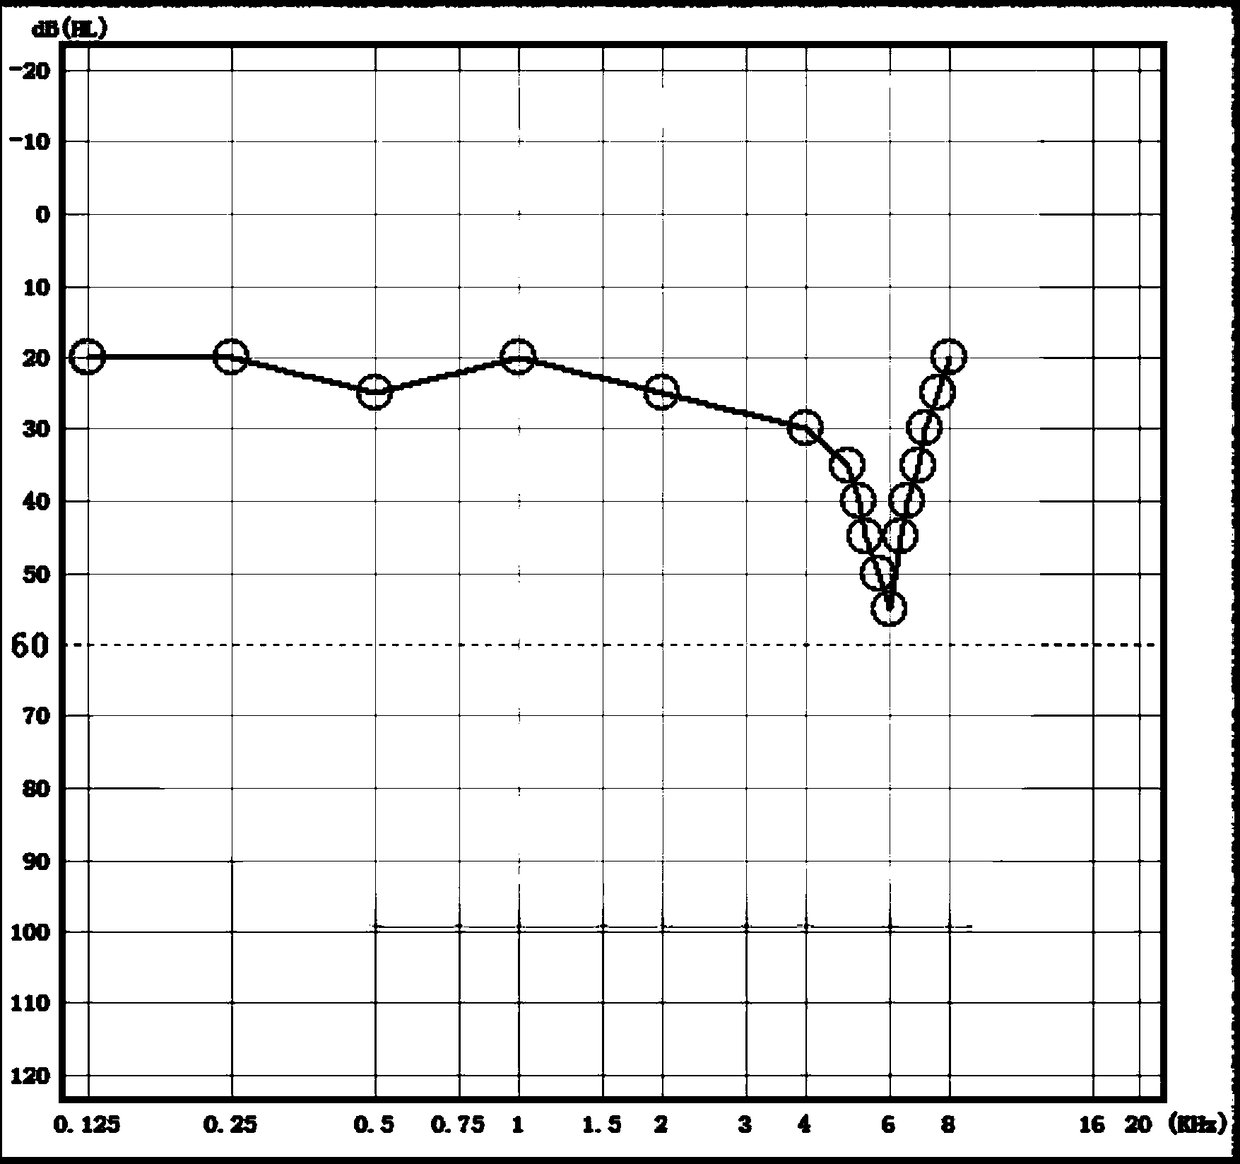
[0046] refer to image 3 , image 3 It is a graph of hearing test results of a test subject, the abscissa in the figure is the hearing test frequency, and the ordinate is the hearing test threshold.

[0047] The hearing threshold N at the lowest point is 55dBHL, and the hearing threshold M at the highest point is 20dBHL, then HLD=N-M=55-20=35dBHL. Explain that the tester has mild hearing loss.

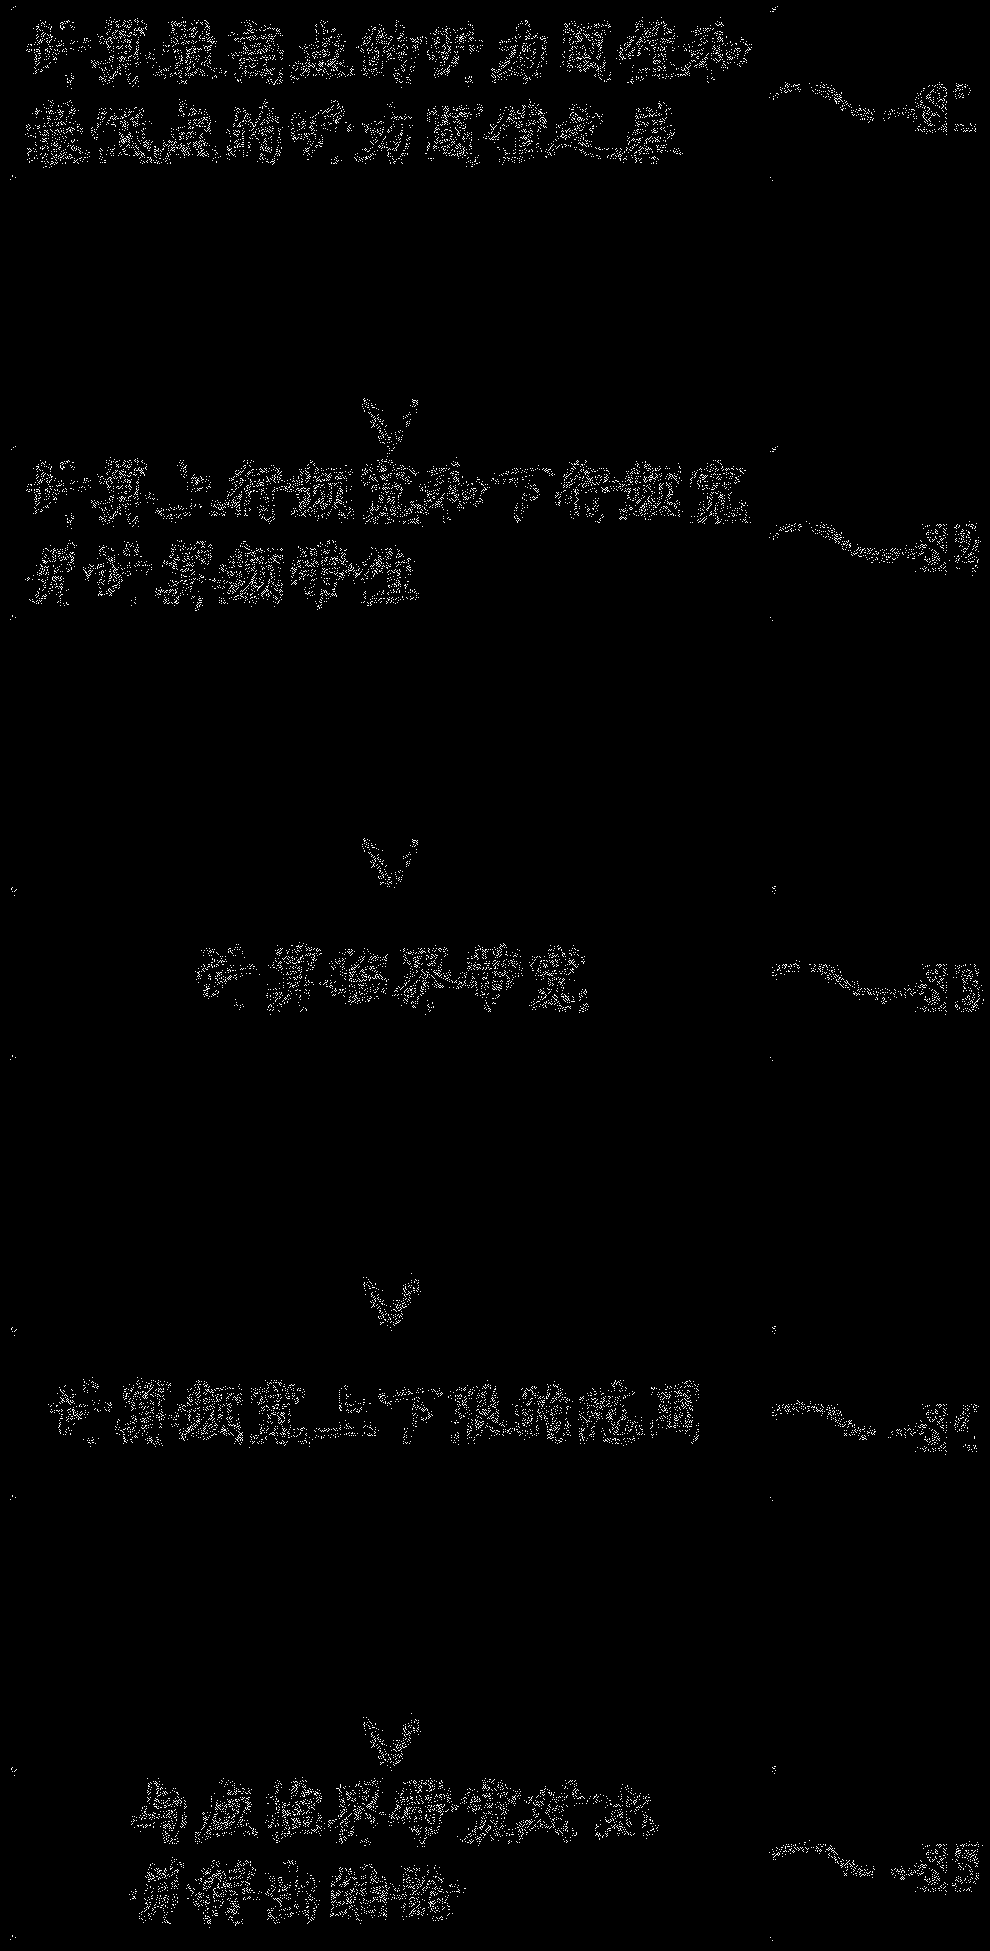
[0048] As shown in the figure, the worst point of hearing is 5993Hz, 55dB, set the first predetermined value HLD1 to 30dB, then take 5993Hz as the center, the frequency point whose uplink threshold difference is less than or equal to 30dB is 5040Hz, the uplink bandwidth is 5040-5993Hz, and the downlink threshold difference is less than The frequency equal to 30dB is 5993Hz, and the downlink bandwidth is 5993-6727Hz, so the frequency band can be determined as: 5040-6727Hz, and the bandwidth is 6727-5040=1687.

[0049] From the above, it can be seen that the notch of the hearing loss ...


PUM


Abstract

The invention provides a graph automatic identification method of audiometry results. The method is characterized by comprising the following steps that S1, the difference between a hearing thresholdvalue at the highest point and a hearing threshold value at the lowest point is calculated; S2, upper horizontal frequency width and lower horizontal frequency width are calculated to calculate a frequency band value; S3, critical bandwidth is calculated; S4, ranges of top and bottom limitations of the frequency widths are calculated; S5, the ranges are contrasted with the critical bandwidth to obtain a conclusion. The provided graph automatic identification method of audiometry results can help doctors and operators quickly and accurately discover potential or existing hearing damage, timelycarry out risk assessment on subjects, provide more complete structural data for further research of damaged parts and precipitating factors, improve the diagnosis accuracy, in addition, provide convenience for subjects to read and understand testing results, and provide elaborated decision basis for daily protection, prevention and rehabilitation of subjects.

Description

technical field [0001] The invention relates to an analysis method for hearing test results, in particular to an automatic recognition method for hearing test result graphics. Background technique [0002] Hearing test is the most routine and important examination item in the otology clinic. The results can reflect the degree and nature of hearing loss and the location of the lesion, and are widely used in clinical diagnosis and treatment of otolaryngology and experience. At present, the hearing devices on the market display the hearing test results through graphics, that is, the audiogram. To understand the audiogram requires relevant professional knowledge. However, many clinicians may not know how to consult and interpret it. Graphical information is converted into test results written on the hearing report. Generally, audiogram data is not saved on the computer, which eventually leads to waste of inspection data and affects future diagnostic analysis. As for the subjec...

Claims


Application Information

Patent Timeline
IPC IPC(8): A61B5/12A61B5/00
CPCA61B5/121A61B5/7271
Inventor 姜鸿彦蓝天翔蓝军
Owner FOSHAN BOZHI MEDICAL TECH CO LTD
Why Eureka
Try Eureka