Vector magnetocardiography method and vector magnetocardiographic system
A magnetocardiogram and vector technology, applied in the field of vector magnetocardiogram and vector magnetocardiogram system, to achieve the effect of solving system dependence
- Summary
- Abstract
- Description
- Claims
- Application Information
AI Technical Summary
Problems solved by technology
Method used
Image
Examples
Embodiment Construction
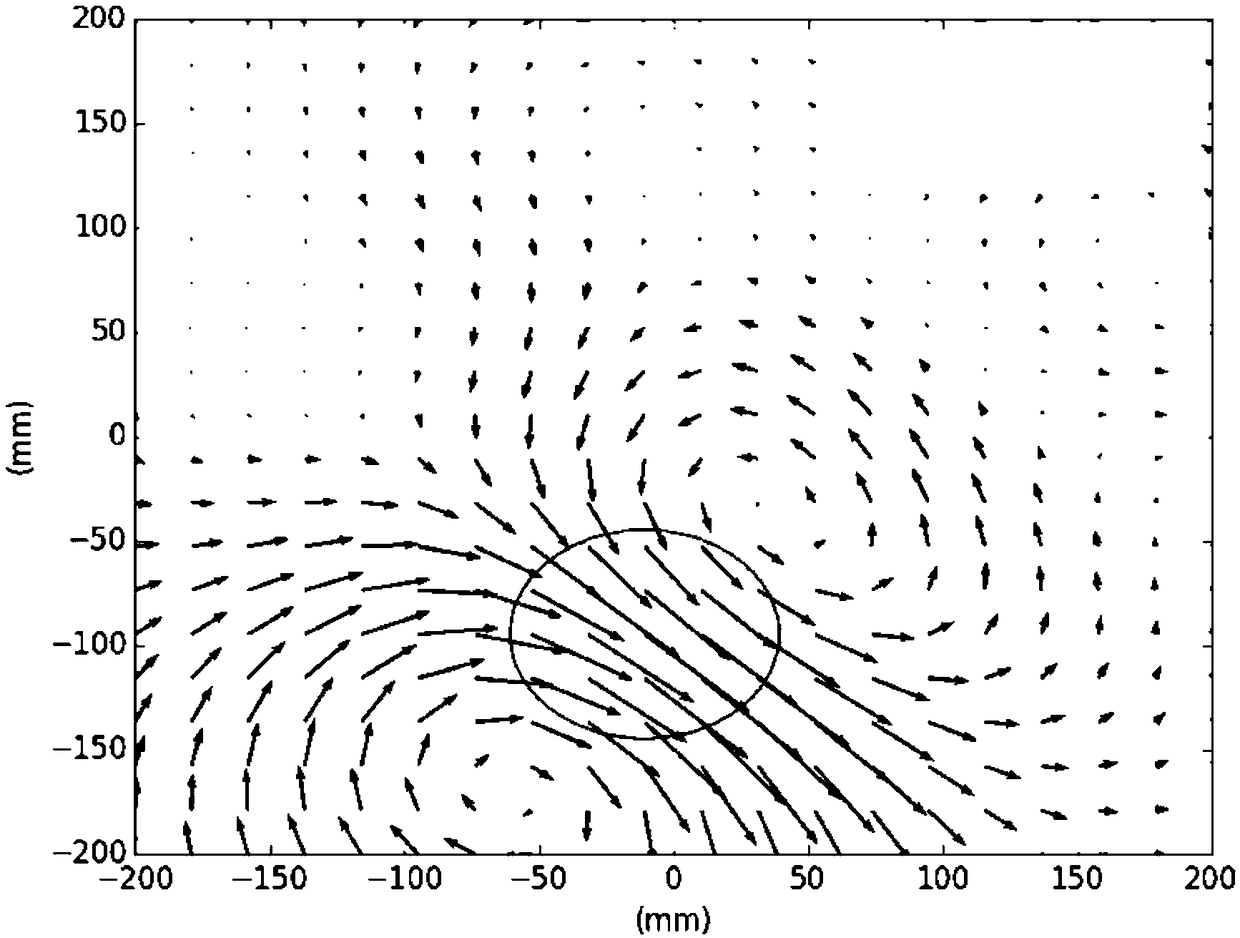
[0052] figure 1 A standard pseudocurrent map of a 20×20 source grid, using 13 eigenvalues, is shown for finding the best position for the ESMS. The pseudo-current map is created from data measured during the R-peak of sinus rhythm. The circled area indicates the region of the strongest electrical activity during the R-peak.
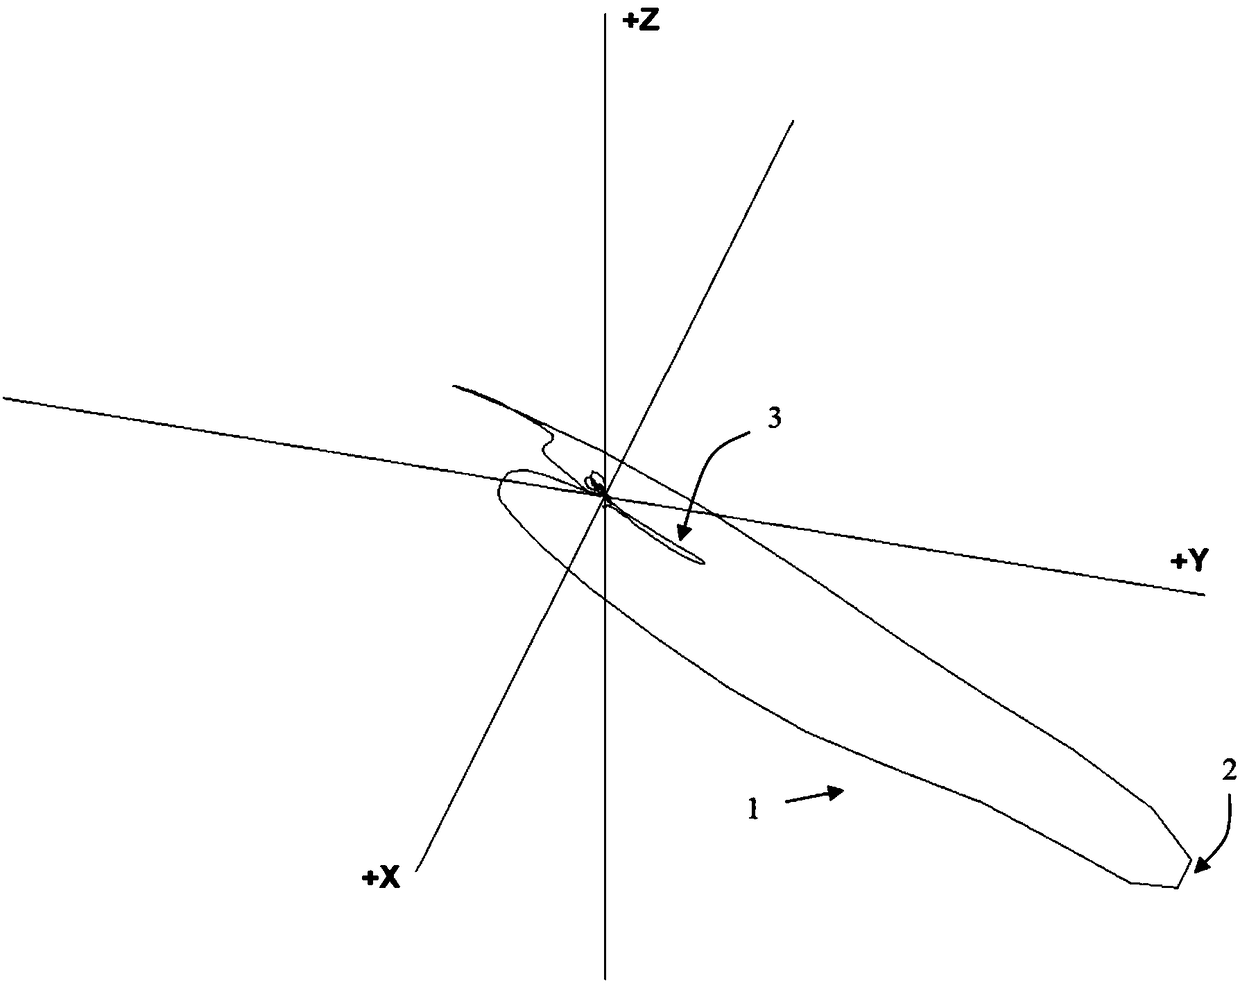
[0053] figure 2 VMCG of healthy subjects is depicted in . The large circle indicated by reference numeral 1 represents the QRS complex and includes the R peak 2 and the small circle 3 represents the T peak.
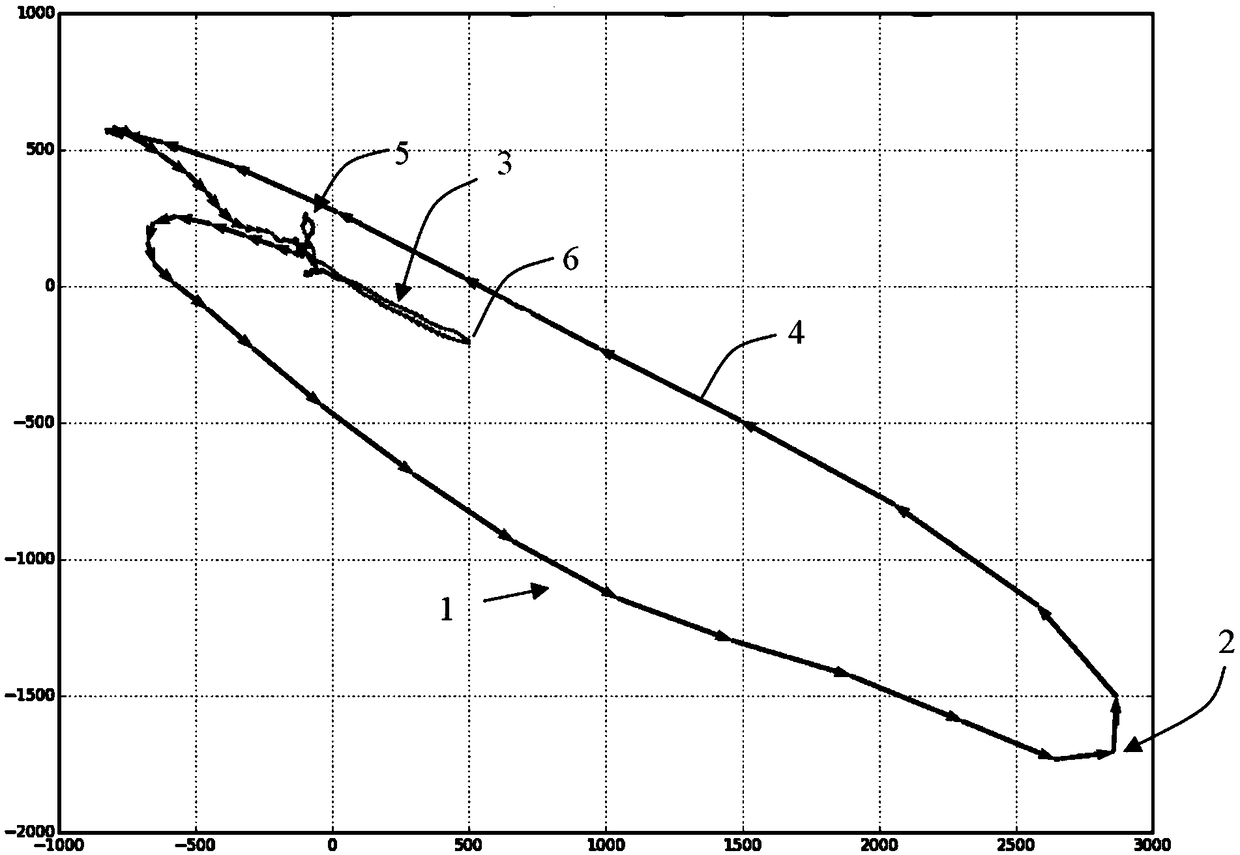
[0054] image 3 show figure 2 2-D plot of the VMCG in , corresponding to an equivalent single current source (ESCS). Such a representation is particularly advantageous to facilitate angular measurements, ie changes in the direction of the MHV / EHV. Q, R, S, T, and even P waves are visible. The P wave at 125ms is indicated by the number 5, the R peak at 200ms is indicated by the number 2, and the T wave at 339ms max Represented by the number...
PUM
 Abstract
Description
Claims
Application Information
 - R&D
- Intellectual Property
- Life Sciences
- Materials
- Tech Scout
- Unparalleled Data Quality
- Higher Quality Content
- 60% Fewer Hallucinations
Browse by: Latest US Patents, China's latest patents, Technical Efficacy Thesaurus, Application Domain, Technology Topic, Popular Technical Reports.
© 2025 PatSnap. All rights reserved.Legal|Privacy policy|Modern Slavery Act Transparency Statement|Sitemap|About US| Contact US: help@patsnap.com


