Visual analysis method and system for multi-modal data based on sketch interaction

A multi-modal, sketching technology, applied in the field of human-computer interaction, can solve the problem of difficult to show the complex structure, relationship and law of data, and achieve the effect of visual management, promotion of cognition, and reduction of cognitive load.

Active Publication Date: 2018-10-26
INST OF SOFTWARE - CHINESE ACAD OF SCI
View PDF6 Cites 14 Cited by
  • Summary
  • Abstract
  • Description
  • Claims
  • Application Information

AI Technical Summary

Problems solved by technology

The difficulty in analyzing multimodal data lies in, first, multimodal data are often unstructured data, including directly described text data, persistent data that changes over time, image data formed by shooting, etc.; second, these There are often internal correlations between data, and static display is difficult to show the inherent complex structure, relationship and law of data

Method used


Image

  • Visual analysis method and system for multi-modal data based on sketch interaction
  • Visual analysis method and system for multi-modal data based on sketch interaction
  • Visual analysis method and system for multi-modal data based on sketch interaction

Examples


specific example

[0068] A specific example is provided below, including the following steps:

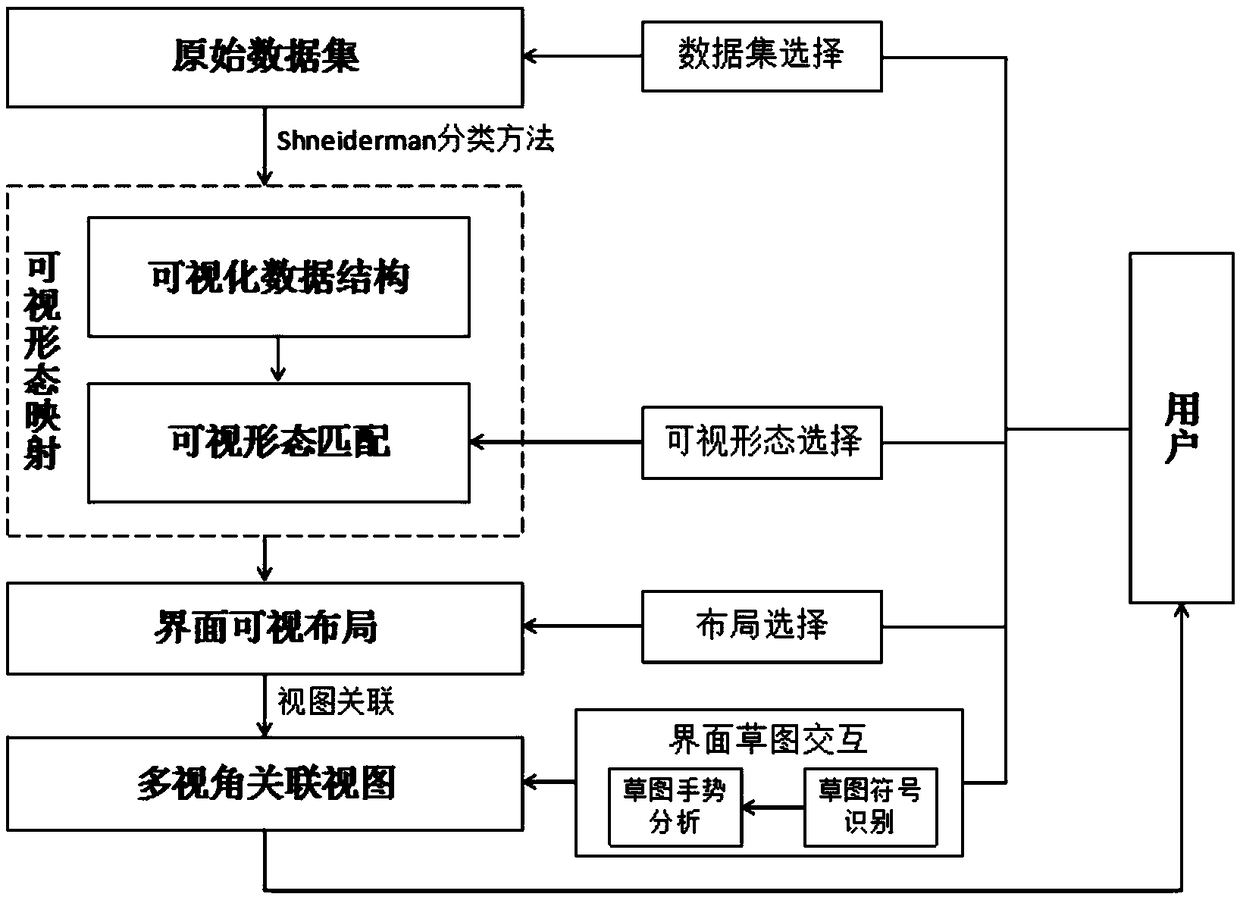
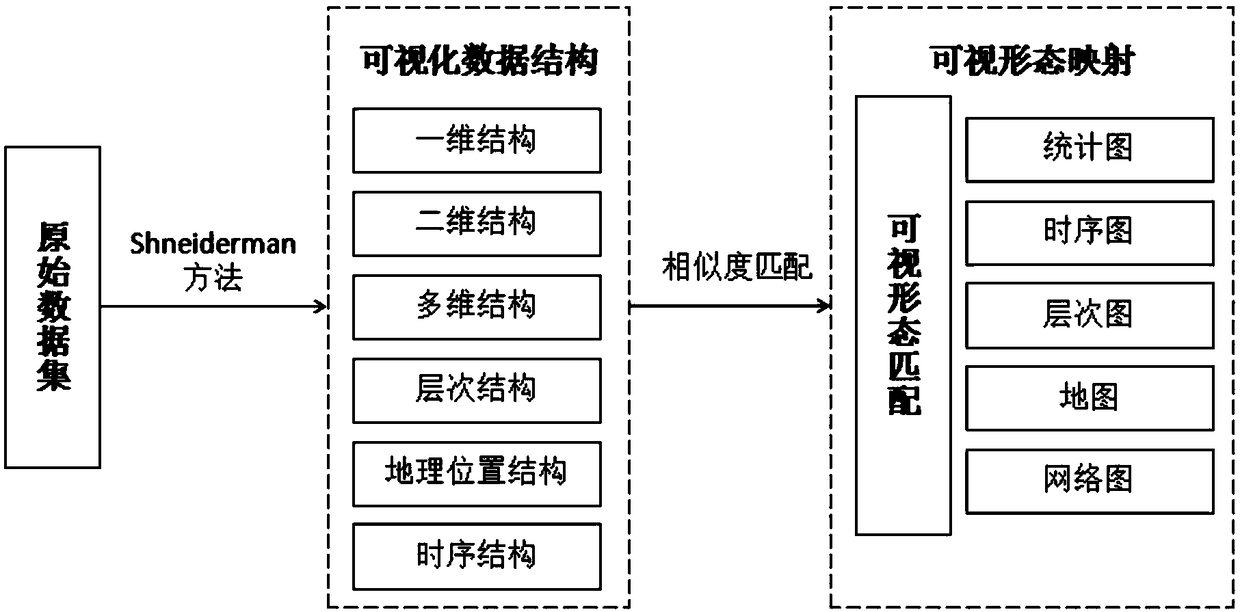
[0069] 1. Select the data set to be analyzed. In this example, the monthly dealer sales data from 2011 to 2017 is selected as the object from the existing car sales data;

[0070] 2. Use the method described in step 1 above to divide the data set into multiple visualization types, and perform visual mapping, such as figure 2 ;

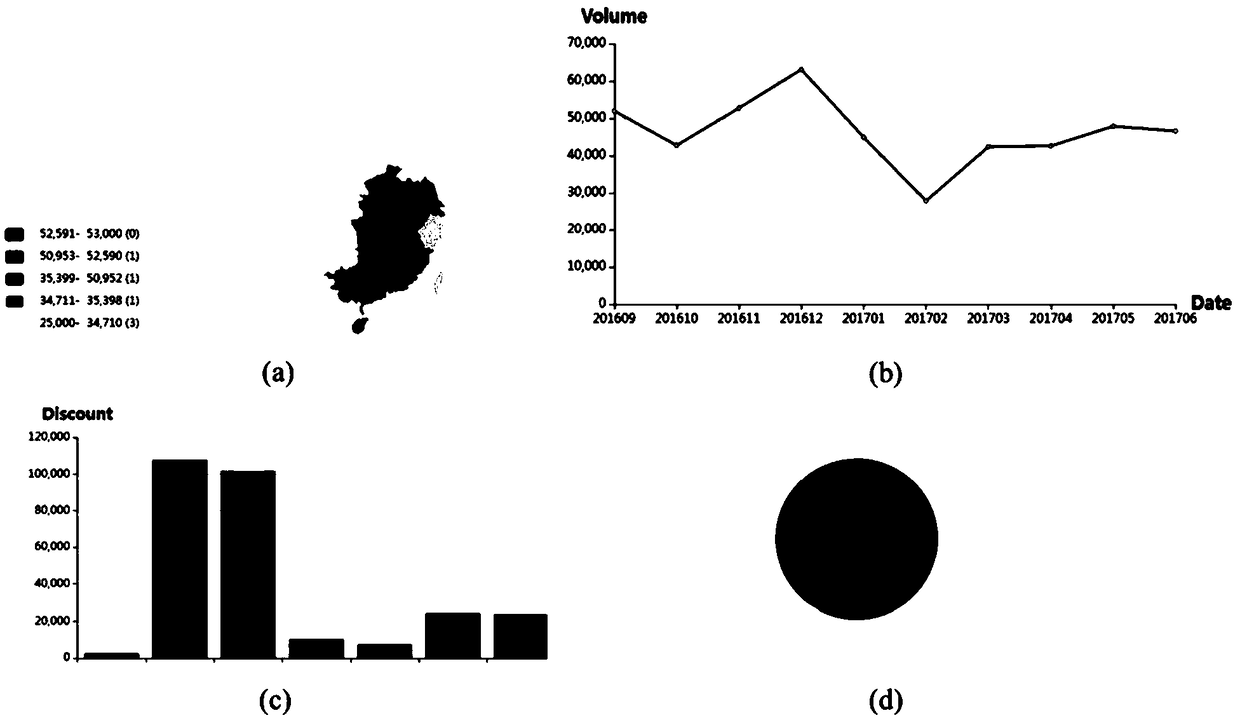
[0071] 3. Use the method described in step 3 above to draw a multi-view associated view, as shown in the attached image 3 shown. image 3 It is a visual presentation view of information, including a statistical map of sales from geographical information ((a) figure), a statistical line chart of sales from time series ((b) figure), and a comparison histogram of sales of different brands ((c) ) chart), and a pie chart ((d) chart) of the proportion of sales of different brands to the total. In addition, you can also increase the filter component view, and image 3 visual ...


PUM


Abstract

The invention discloses a visual analysis method and system for multi-modal data based on sketch interaction. The method comprises the steps that (1) an original dataset is divided into multiple visual data structures; (2) matching between the visual data structures and visual forms is performed; (3) according to a mapping relation from the original dataset to the visual data structures to the visual forms, the original dataset is decomposed into multiple associated information sides, each information side is displayed in a view through one visual form, and a multi-viewing-angle association view is generated in combination with layout information selected by a user; and (4) sketch symbols drawn by the user who performs sketch selection operation on the multi-viewing-angle association viewaccording to a target analysis demand are recognized, then the implication of a sketch gesture composed of the sketch symbols is analyzed, and a new view is generated according to the implication of the sketch gesture. According to the visual analysis method and system, the user is assisted in performing visual analysis on the multi-modal data based on sketch interaction, the user can be helped toquickly acquire data knowledge, and the data association law can be mined.

Description

technical field [0001] The invention belongs to the field of human-computer interaction, and in particular relates to a multimodal data-oriented visual analysis method and system based on sketch interaction. Background technique [0002] We are in an era of information explosion, and new data are constantly being generated, and the speed of generation is getting faster and the scale is getting bigger and bigger. Multimodality refers to a social symbol in information exchange, which describes data information through various data forms such as images, texts, voices, and videos (Kress, Gunther (2010). Multimodality: A Social Semiotic Approach to Contemporary Communication. New York :Routledge.p.79.ISBN0415320607.). In the past few years, the amount of data has grown rapidly, and the types of data are also increasing. While bringing people rich data resources, it also brings more difficult challenges. How do people quickly understand the information in massive data? , how to ...

Claims


Application Information

Patent Timeline
Patent Type & Authority Applications(China)
IPC IPC(8): G06F17/30G06F3/0484
CPCG06F3/04845
Inventor 滕东兴朱丽马翠霞王宏安
Owner INST OF SOFTWARE - CHINESE ACAD OF SCI
Why Eureka
Try Eureka