
Eureka
For R&D, Eureka makes reading and utilizing patents & technical documents easy.
Eureka AIR
Designed for self-driven R&D workflows. Generate viable solutions, solve complex R&D challenges, empower your innovation with AI.

Eureka Materials
Designed for material experts only. Revolutionize your material R&D, from search, analyze, to developing new materials.

TechResearch
Generate reliable direction feasibility study reports for your R&D in just a few steps.

TechSeek
Discover and master advanced knowledge NOW. Basics, ideas, possibilities, all at once.

TechMind
As an expert in R&D Theories, TechMind can generates customized viable solutions instantly.

TechRisk
Analyze your overall solution with one click, know your potential R&D risks in advance.

TechMonitor
Get weekly tech updates, stay abreast of the latest tech innovations and key insights.
Visual display method, apparatus and device of satellite data and storage medium
A satellite data and display method technology, applied in the field of visualization, can solve the problems of large amount of satellite data, high difficulty in processing engineering, and inability to be used by suppliers
- Summary
- Abstract
- Description
- Claims
- Application Information
AI Technical Summary
Problems solved by technology
Method used
Image

Examples
Embodiment 1
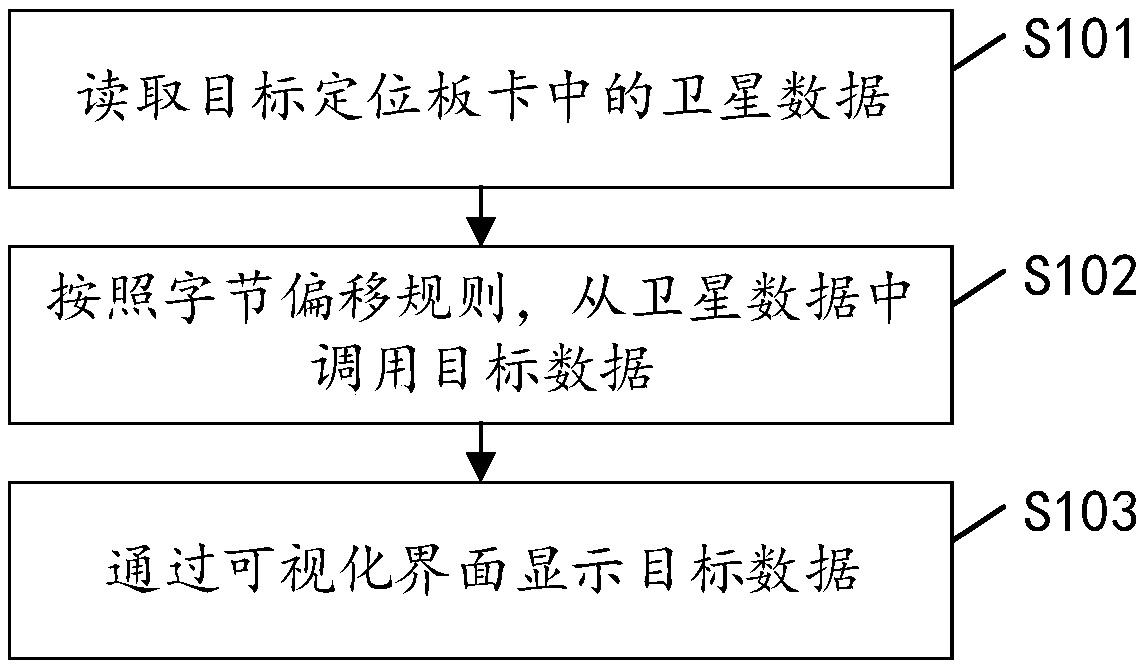
[0039] see figure 1 , an implementation flowchart of a method for visually displaying satellite data in an embodiment of the present invention, the method may include the following steps:
[0040] S101: Read the satellite data in the target positioning board.
[0041] Wherein, the satellite data is the data sent by each satellite received in advance by the target positioning board.
[0042] The server is connected to the target positioning board through a network cable or a serial port line, and each satellite can send satellite data to the target positioning board, and the server can read satellite data from the target positioning board in real time or at regular intervals. The data read by the server includes various data of each satellite.
[0043] It should be noted that if the server reads satellite data from the target positioning board at regular time intervals, the time interval between two adjacent reading operations can be set and adjusted according to the actual s...
Embodiment 2
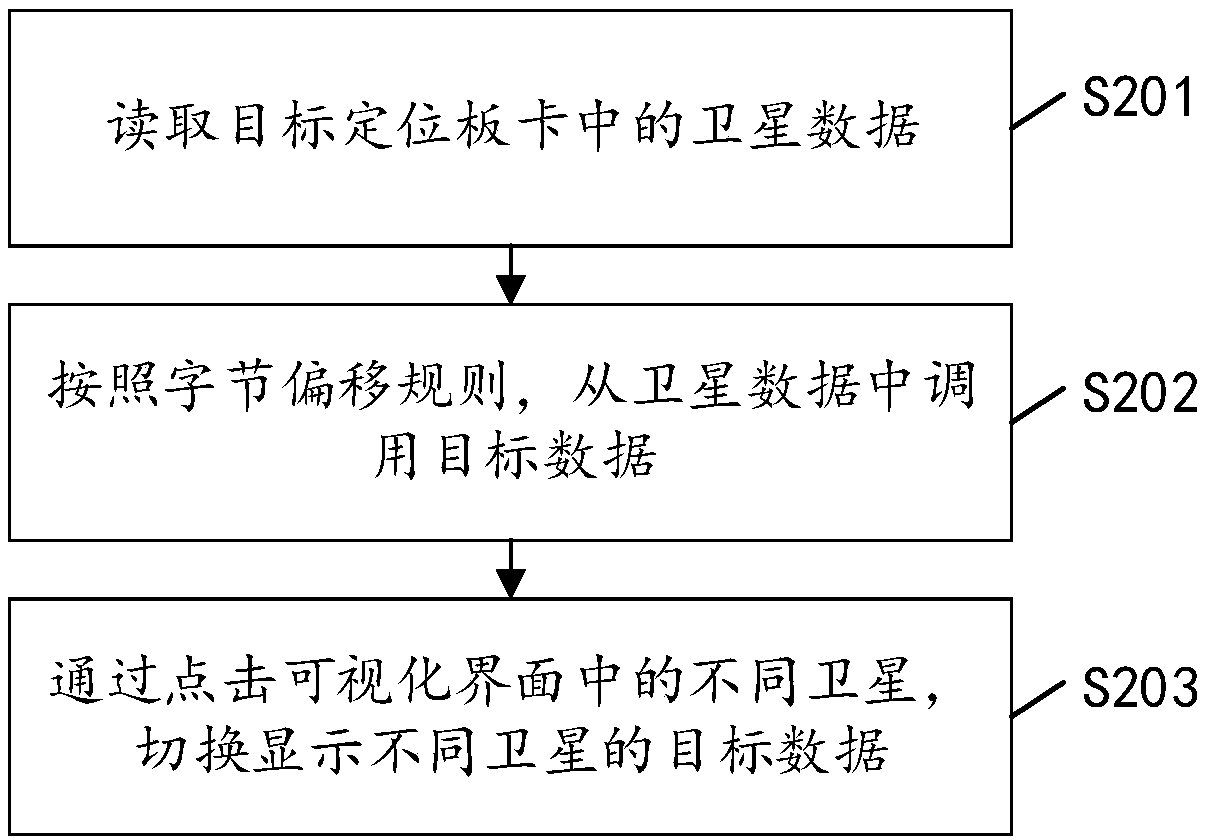
[0056] see figure 2 , figure 2 Another implementation flowchart of the satellite data visual display method in the embodiment of the present invention, the method may include the following steps:
[0057] S201: Read the satellite data in the target positioning board.
[0058] Wherein, the satellite data is the data sent by each satellite received in advance by the target positioning board.
[0059] S202: Call the target data from the satellite data according to the byte offset rule.
[0060] S203: By clicking on different satellites in the visualization interface, switch to display target data of different satellites.
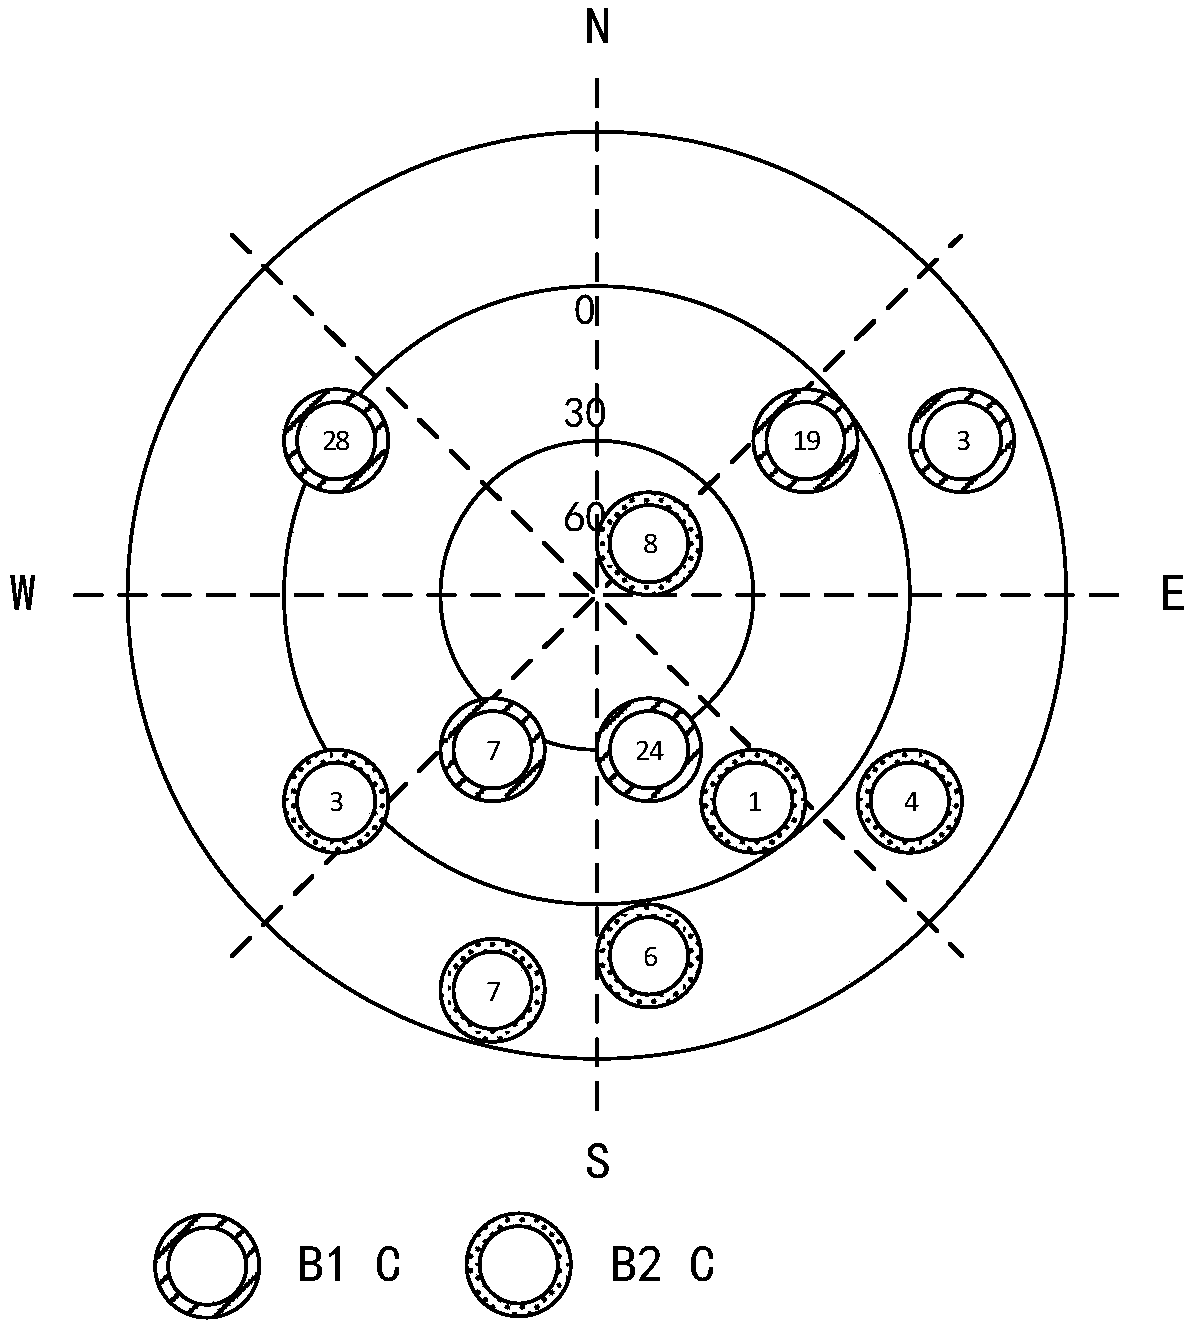
[0061] Wherein, the visualization interface is an interface provided with a coordinate system marked with the WNSE orientation, and each satellite is scattered in the coordinate system.
[0062] Such as image 3 As shown, after obtaining the target data, you can switch and display different target data by clicking on different satellites in the visualiza...
Embodiment 3
[0064] see Figure 4 , Figure 4 Another implementation flowchart of the satellite data visual display method in the embodiment of the present invention, the method may include the following steps:
[0065] S401: Read the satellite data in the target positioning board.
[0066] Wherein, the satellite data is the data sent by each satellite received in advance by the target positioning board.
[0067] S402: Call the target data from the satellite data according to the byte offset rule.
[0068] S403: Displaying the target data in the form of a dynamic histogram through a visual interface.
[0069] Wherein, each satellite corresponds to a sub-dynamic histogram, and the dynamic histogram is formed by arranging multiple sub-dynamic histograms.
[0070] Such as Figure 5 As shown, when the target data is retrieved from the read satellite data, the target data can be displayed in the form of a dynamic histogram through the visual interface. A single sub-dynamic histogram can b...
PUM
 Abstract
Description
Claims
Application Information
 - R&D Engineer
- R&D Manager
- IP Professional
- Industry Leading Data Capabilities
- Powerful AI technology
- Patent DNA Extraction
Browse by: Latest US Patents, China's latest patents, Technical Efficacy Thesaurus, Application Domain, Technology Topic, Popular Technical Reports.
© 2024 PatSnap. All rights reserved.Legal|Privacy policy|Modern Slavery Act Transparency Statement|Sitemap|About US| Contact US: help@patsnap.com