Resource occupancy data prediction method, electronic device, and storage medium
A technology for resource occupancy and data prediction, applied in the software field, can solve problems such as poor experience effects, and achieve the effects of avoiding resource idleness, providing resource utilization, and ensuring accuracy
- Summary
- Abstract
- Description
- Claims
- Application Information
AI Technical Summary
Problems solved by technology
Method used
Image

Examples
Embodiment 1
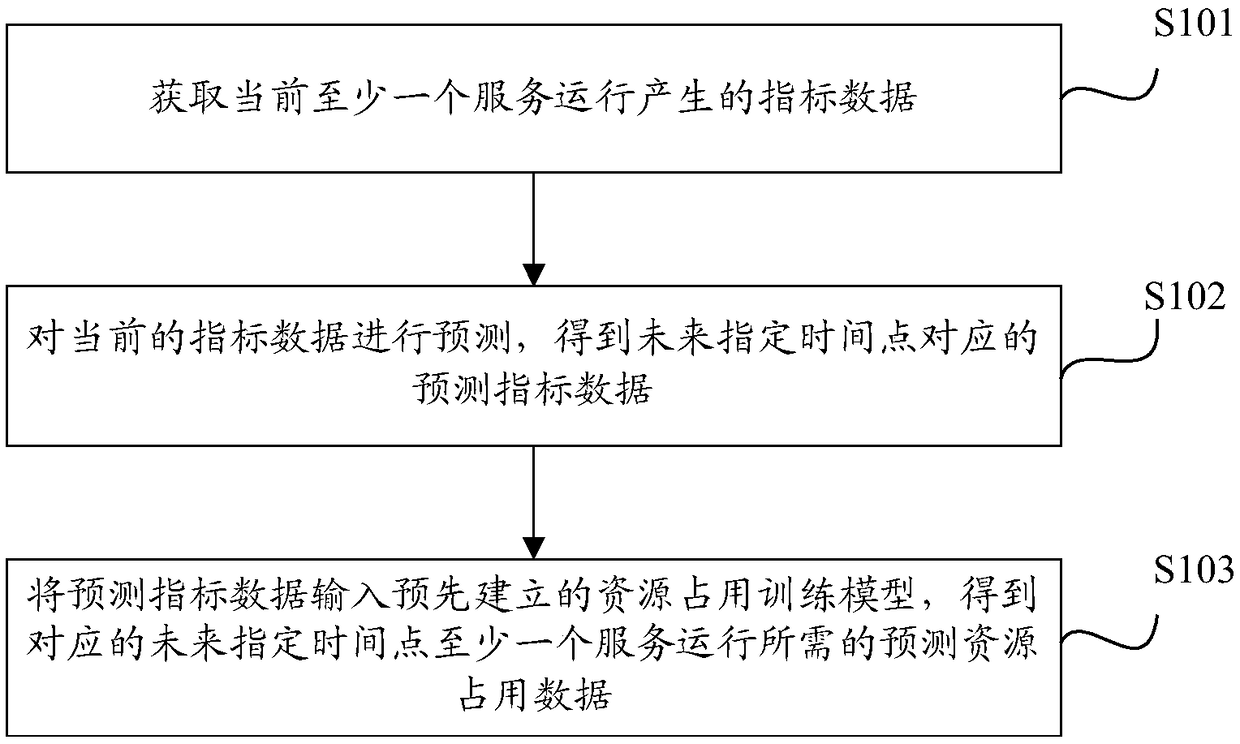
[0027] figure 1 A flowchart showing a method for predicting resource occupancy data according to Embodiment 1 of the present invention, as shown in figure 1 As shown, the resource occupancy data prediction method specifically includes the following steps:
[0028] Step S101, acquiring index data generated by at least one service operation currently.
[0029] When the service is running, the performance of the service will be measured according to various indicator data generated by its operation. Depending on the health of the service, the resulting metric data will vary. The indicator data can be obtained by monitoring the service operation. For example, when the service is running, in order to ensure the normal operation of the service, daily monitoring of the service operation is carried out, so that the indicator data generated by the service operation can be easily obtained.
[0030] Indicator data includes query rate per second, throughput, concurrency, response time...
Embodiment 2
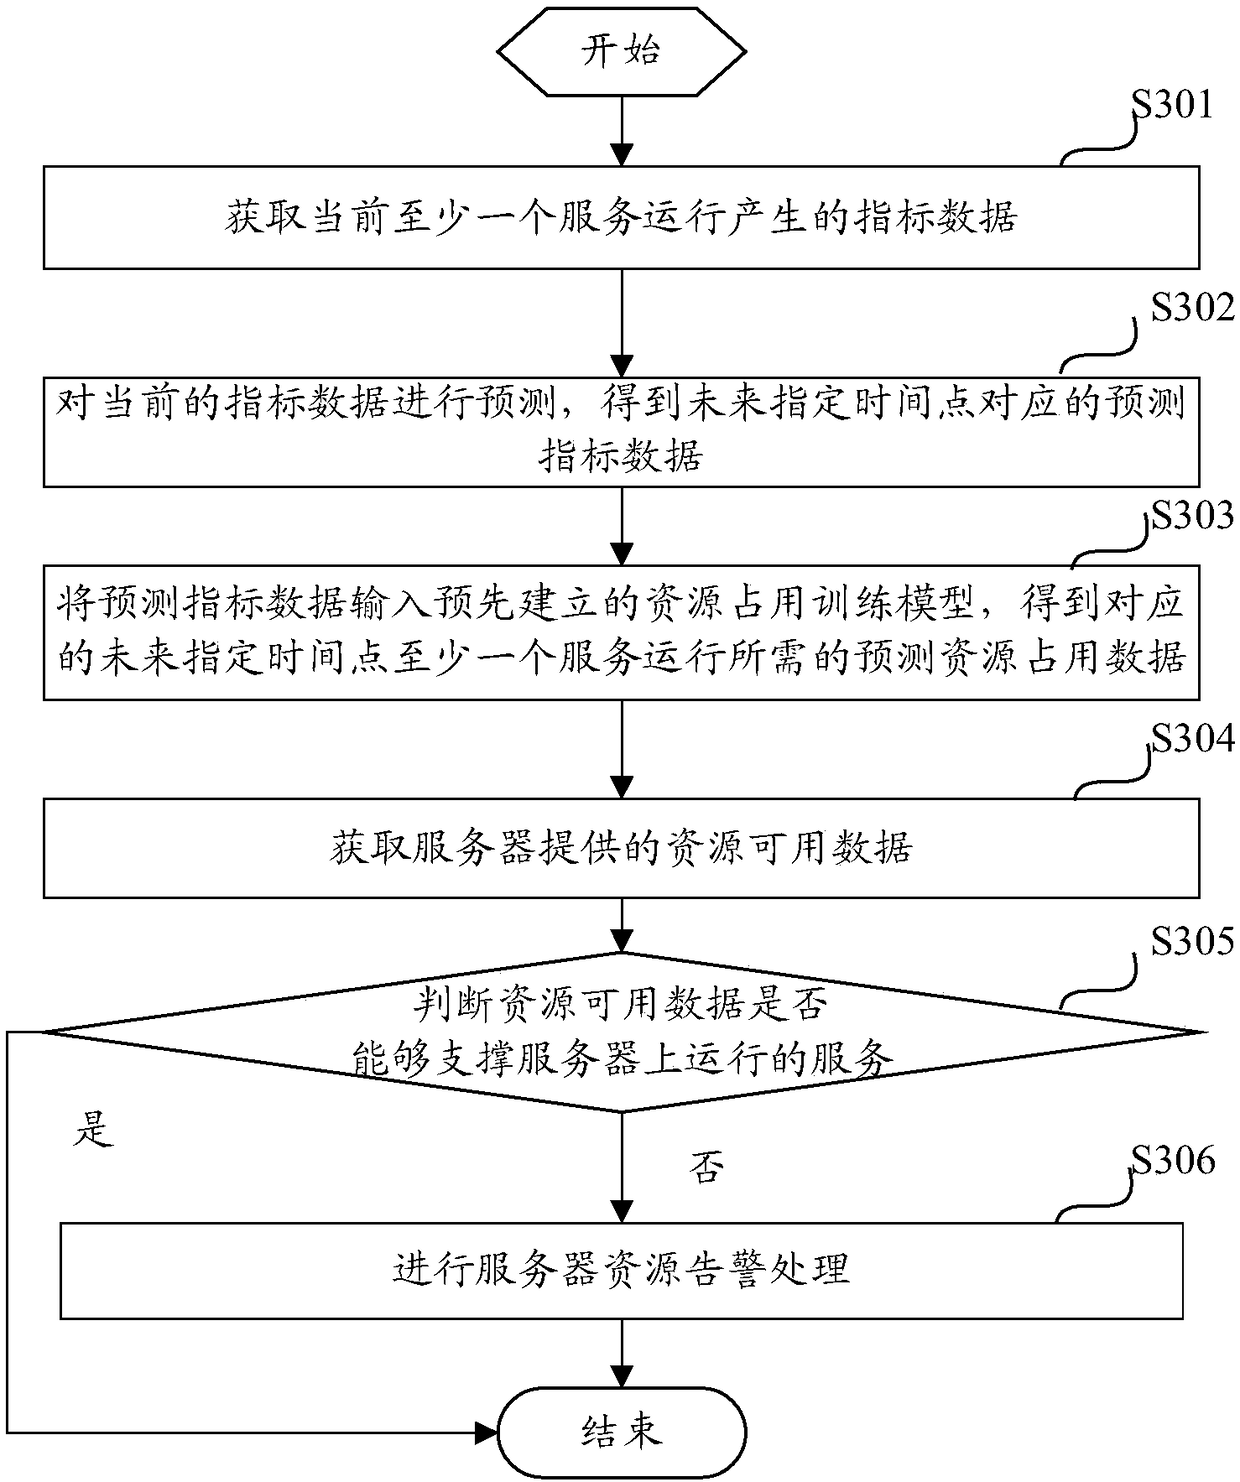
[0050] image 3 A flowchart showing a method for predicting resource occupancy data according to Embodiment 2 of the present invention, as shown in image 3 As shown, the resource occupancy data prediction method includes the following steps:
[0051] Step S301, acquiring index data generated by at least one service operation currently.
[0052] Step S302, predicting the current index data to obtain the forecast index data corresponding to a specified time point in the future.
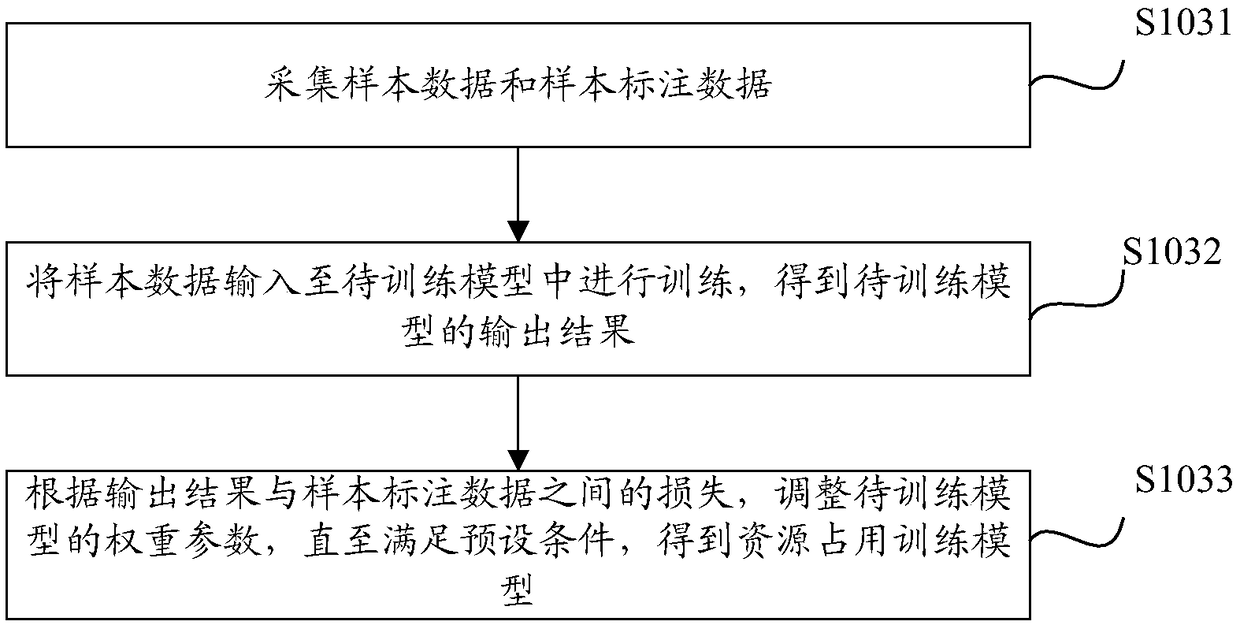
[0053] Step S303, inputting the predictive index data into the pre-established resource occupation training model to obtain the predicted resource occupation data required for the operation of at least one service at a corresponding specified time point in the future.
[0054] For the above steps, refer to the description of steps S101-S103 in Embodiment 1, and details are not repeated here.
[0055] Step S304, acquiring resource availability data provided by the server.
[0056] The resource avail...
Embodiment 3
[0065] Embodiment 3 of the present application provides a non-volatile computer storage medium, where at least one executable instruction is stored in the computer storage medium, and the computer executable instruction can execute the method for predicting resource occupation data in any of the above method embodiments.
[0066] Specifically, the executable instruction can be used to make the processor perform the following operations:
[0067] Obtain the indicator data generated by at least one current service operation; predict the current indicator data to obtain the predicted indicator data corresponding to the specified time point in the future; input the predicted indicator data into the pre-established resource occupation training model to obtain the corresponding future specified time point Predicted resource usage data required for at least one service to run.
[0068] In an optional implementation, the executable instructions further cause the processor to perform t...
PUM
 Abstract
Description
Claims
Application Information
PatSnap Eureka turns technology decisions into work you can execute. Powered by our Innovation Knowledge Graph, it runs expert workflows across engineering, life sciences, materials and intellectual property. Get your review-ready output in minutes.


