
Subway station clustering and regression analysis method and system based on POI data and passenger flow data

A passenger flow data and regression analysis technology, applied in the field of traffic information, can solve the problems of insufficient in-depth analysis and mining of passenger flow factors in subway stations, less analysis and mining, and insufficient integration of data and theoretical models. The effect of improving service levels

Inactive Publication Date: 2018-12-18
BEIHANG UNIV
View PDF4 Cites 13 Cited by
  • Summary
  • Abstract
  • Description
  • Claims
  • Application Information

AI Technical Summary

Problems solved by technology

However, the prediction and analysis are usually only for the passenger flow information data of the station, and the analysis and mining of traffic points of interest around the subway station are relatively seldom
The combination of actual data and theoretical models is not enough, and the analysis and excavation of factors affecting passenger flow in subway stations is not deep enough

Method used


Image

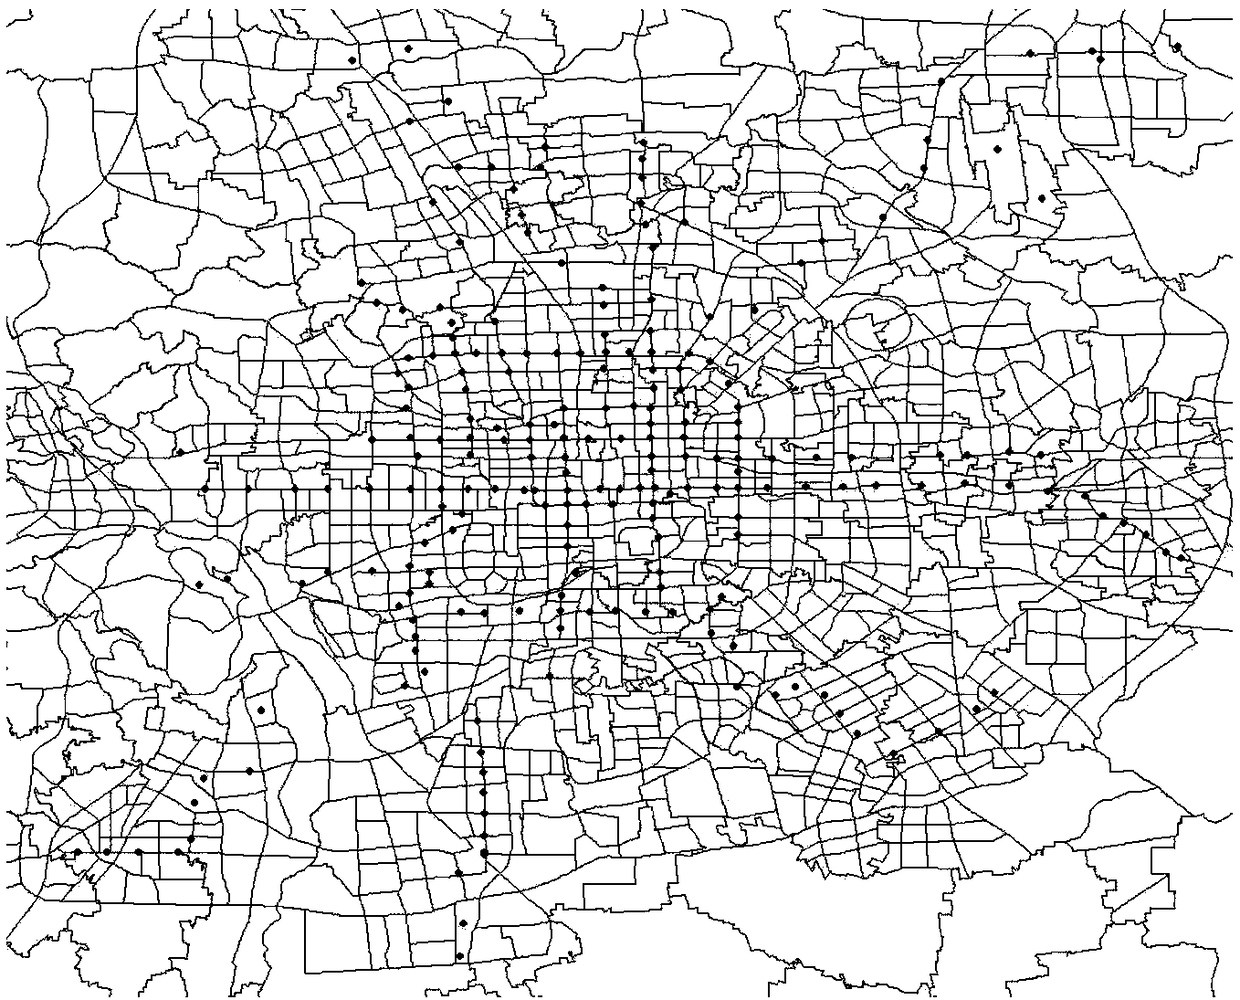
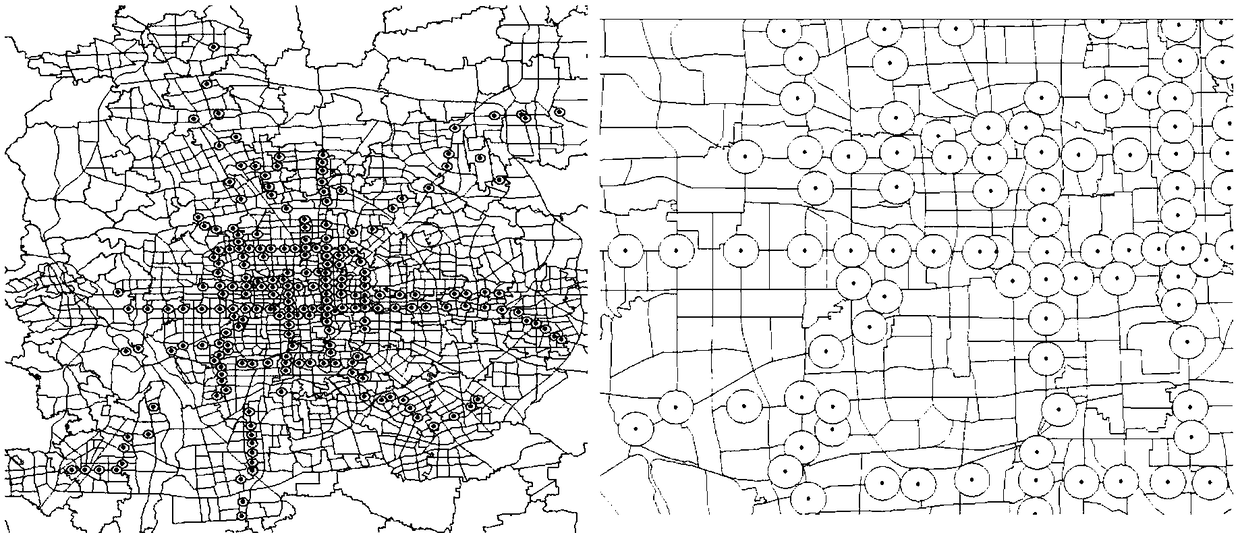
  • Subway station clustering and regression analysis method and system based on POI data and passenger flow data
  • Subway station clustering and regression analysis method and system based on POI data and passenger flow data
  • Subway station clustering and regression analysis method and system based on POI data and passenger flow data

Examples


Embodiment Construction

[0028] Below in conjunction with accompanying drawing and embodiment, the specific embodiment of the present invention is described in further detail. The following examples are used to illustrate the present invention, but are not intended to limit the scope of the present invention.

[0029] figure 1 A kind of subway station clustering and regression analysis method and system flow chart based on POI data and passenger flow data provided according to the embodiment of the present invention, such as figure 1 As shown, the method includes:

[0030] Collect the number of POIs with different functions around the subway station, count the daily average passenger flow in and out of the subway station, and generate a data set;

[0031] Based on cluster analysis, quantify the service scale of the subway station according to the data set;

[0032] Based on regression analysis, find out the impact relationship of POI types and quantities around the subway station on passenger flow;...


PUM


Abstract

The invention provides a subway station clustering and regression analysis method and system based on POI data and passenger flow data. The method includes: collecting the quantity of POI with different functions around the subway station through the statistical software of GIS, counting the daily average passenger flow in and out of the subway station based on AFC card swiping data, and generating the data set to be processed. Based on the different POI quantity around the subway station, classifying the service intensity grade of subway station by a clustering method; taking the daily average passenger flow as dependent variable and the POI quantity as independent variable, through regression analysis, seeking the influence relationship between the POI types and quantity around the subway station and the passenger flow of the subway station. The method and the system provided by the invention adopt POI data and AFC card swiping data, combine the dynamic data and the static data, candirectly and effectively measure the scale of a subway station, and comprehensively analyze the functional positioning and service level of different subway stations. According to the different typesof subway stations, the invention puts forward some suggestions to deal with different passenger flow characteristics.

Description

technical field [0001] The present invention relates to the technical field of traffic information, more specifically, to a method and system for clustering and regression analysis of subway stations. Background technique [0002] Urban rail transit undertakes the important task of passenger transportation and is an important link in public transportation. To cope with the huge passenger flow of subway stations during peak hours, and to organize passengers to enter and exit stations and take rail transit in a reasonable and orderly manner, it is necessary to master the travel rules of subway passenger flow. Research the number and types of POI (point of interest) around the subway station, and analyze the historical data of the daily average passenger flow in and out of the subway station, combine static data with dynamic data, and comprehensively analyze the functional positioning of different subway stations in Beijing and service level. For different subway station type...

Claims


Application Information

Patent Timeline
Patent Type & Authority Applications(China)
IPC IPC(8): G06Q10/04G06Q50/30
CPCG06Q10/04G06Q50/40
Inventor 马晓磊沈宣良杜博文
Owner BEIHANG UNIV
Learn More