[0051] In order to make the object, technical solution and advantages of the present invention clearer, the implementation manner of the present invention will be further described in detail below in conjunction with the accompanying drawings.
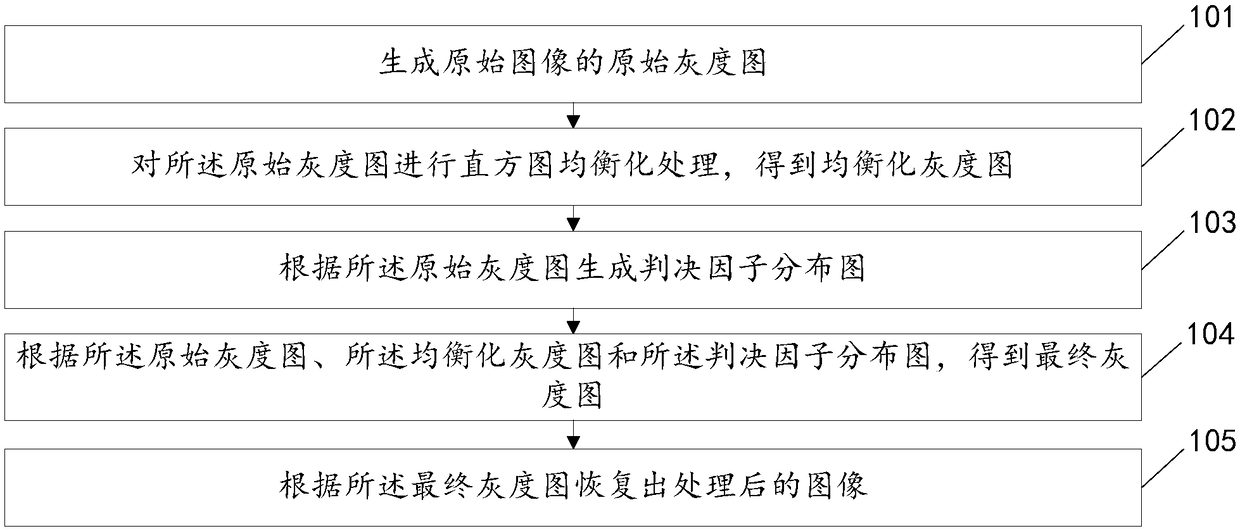
[0052] figure 1 is a flow chart of an image processing method provided by an embodiment of the present invention, see figure 1 , the image processing method includes:
[0053] Step 101: Generate an original grayscale image of the original image.
[0054] In the embodiment of the present invention, generating the original grayscale image of the original image may include: acquiring the original image; and processing the original image to obtain the original grayscale image.
[0055] Wherein, processing the original image includes but is not limited to converting the original image into a format such as YUV to generate an original grayscale image. Specifically, Y in YUV represents brightness, and U and V represent chroma, so if there is only Y component but no U and V components, then the obtained image is a grayscale image, and step 101 can perform image conversion based on this to generate the original grayscale picture.
[0056] Step 102: Perform histogram equalization processing on the original grayscale image to obtain an equalized grayscale image.
[0057] In the embodiment of the present invention, performing histogram equalization processing on the original grayscale image can be implemented according to the following steps:
[0058] (1) Count the number of pixels n of each gray level in the original grayscale image i , i=0,1,...,L-1, where L is the total number of gray levels of the original grayscale image, and the total number of gray levels of the original grayscale image is the gray scale that the pixels in the original grayscale image can present The number of series, such as 256;
[0059] (2) Calculate the original image histogram, that is, the probability density P of each gray level in the original grayscale image i (r i ):P i (r i ) = n i /n, n is the total number of pixels of the original grayscale image, r i is the i-th gray level, n i is the number of pixels in the i-th gray level;
[0060] (3) Calculate the cumulative distribution function s in the original grayscale image k (r k ):
[0061]
[0062] (4) According to the cumulative distribution function s in the original grayscale image k (r k ) Calculate the gray level gk of each pixel in the original grayscale image in the equalized grayscale image:
[0063] gk=INT[gm*s k (r k )];
[0064] In the formula, INT[] is a rounding symbol, gm=L-1.
[0065] (5) Modify the gray level of the original grayscale image according to the calculated grayscale of each pixel in the original grayscale image in the equalized grayscale image to obtain an equalized grayscale image.
[0066] Step 103: Generate a decision factor distribution map according to the original grayscale image, the decision factor distribution map includes a first marked area and a second marked area, and the first marked area includes adjacent pixels in the original image and An area where pixels with a standard deviation smaller than a set value are located, the second marked area is an area other than the first marked area in the decision factor distribution map.
[0067] figure 2 is a flowchart of step 103 provided by the embodiment of the present invention, see figure 2 , step 103 may include:
[0068] 103a. Calculate the standard deviation of each pixel in the original grayscale image according to the grayscale values of pixels in a certain area centered on each pixel in the original grayscale image to obtain a standard deviation distribution map, the The standard deviation distribution map includes the standard deviation of each pixel in the original grayscale image.
[0069] Specifically, the first step may include: calculating the square value of the grayscale value of each pixel of the original grayscale image to form a grayscale square image; Mean filtering, to generate the first expected map and the second expected map respectively; Calculate the square value of the gray value of each pixel of the first expected map to obtain the third expected map; Calculate the second expected map and the obtained The difference value of the third expected map is obtained to obtain a difference image; the square root of the gray value of each pixel of the difference image is obtained to obtain the standard deviation distribution map.
[0070] The standard deviation distribution map obtained in this manner can reflect the gray level difference between each pixel and surrounding pixels, so that the pseudo-flat area can be divided into the first marked area when performing subsequent area division.
[0071] Wherein, performing mean filtering on the original grayscale image and the grayscale square image respectively may include: respectively filtering the original grayscale image and the grayscale square image using a filter template with a size of m×m For mean filtering, the value range of m can be 10-20.
[0072] Using m in this value range ensures that the standard deviation distribution map can better indicate the pseudo-flat area in the original image, so as to ensure that the pseudo-flat area will not be enhanced, thereby avoiding image quality degradation.
[0073] Preferably, the value of m is 15, and using 15 as the value of m can distinguish the pseudo-flat area in the original image to the greatest extent.
[0074] 103b. Divide the pixels in the standard deviation distribution map whose standard deviation is smaller than a set value into the first marked area, and divide the areas in the standard deviation distribution map except the first marked area into the first marked area. (2) Marking the area to obtain the decision factor distribution map.
[0075] In the above process of generating the decision factor distribution map, the standard deviation distribution map of the original grayscale image is calculated first, and the first marked area is divided according to the relationship between the standard deviation of each pixel in the standard deviation distribution map and the set value. The gray difference value of the flat part is small, so the standard deviation of the pixels in the pseudo-flat part is also small, so the part in the standard deviation distribution map whose standard deviation is smaller than the set value is judged as a pseudo-flat area (ie, the first marked area) .
[0076] Further, when dividing the first marked area and the second marked area, it can be specifically implemented in a binarized manner, and the specific process is as follows: the pixels whose standard deviation in the standard deviation distribution map is smaller than the set value are placed in the decision factor distribution map The corresponding pixel value is set to 0, and the pixel value corresponding to the pixel in the decision factor distribution map with the standard deviation greater than or equal to the set value in the standard deviation distribution map is set to 1, so the pixel value in the decision factor distribution map is 0 Belong to the first marked area, and the pixel whose pixel value is 1 belongs to the second marked area.
[0077] After the area is divided by binarization, it is simple and convenient to determine whether the pixel corresponds to the first marked area or the second marked area according to the pixel value in the decision factor distribution map in the subsequent processing.
[0078] In the embodiment of the present invention, the value range of the set value may be 1-5. Using the set value of this value range ensures that the decision factor distribution map can better indicate the pseudo-flat area in the original image, so as to ensure that the pseudo-flat area will not be enhanced, thereby avoiding image quality degradation.
[0079] Preferably, the set value is 1, and using 1 as the set value can distinguish the pseudo-flat area in the original image to the greatest extent.
[0080] Optionally, after said generating the decision factor distribution map according to the original grayscale image, the image processing method further includes:
[0081] Updating the decision factor distribution map, so that in the updated decision factor distribution map, the first marked region includes a region of pixels in the original image whose pixel positions are adjacent and whose standard deviation is smaller than a set value, and the In the original image, the number of pixels is less than the threshold in the area of the pixels whose pixel positions are adjacent and the standard deviation is greater than or equal to the set value.
[0082] The update process of the above-mentioned decision factor distribution map actually uses the hole filling algorithm, and divides the pixels with a small number of values greater than or equal to the threshold into the second marking area, and these pixels are enhanced during processing, so that the entire The regions are all enhanced, so as to avoid the situation that only the periphery of a certain region is enhanced, but not the center of the region, resulting in a sudden change in the contrast between the center and the periphery of the region in the processed image.
[0083] In the embodiment of the present invention, the threshold may be 8%-15% of the number of pixels in the original image. The threshold value of this value range is used, so that only when the pixels with a center value greater than or equal to the threshold value are sufficiently small, the hole filling algorithm is processed, so as to avoid enhancing too many pixels in the middle of an area with a value greater than or equal to the threshold value, resulting in false Degraded image quality in flat areas.
[0084] Preferably, the value of the threshold is 10%. At this time, it is possible to avoid enhancing too many pixels in the middle of an area whose value is greater than or equal to the threshold, resulting in deterioration of the image quality of the pseudo-flat area, and to avoid only enhancing a certain pixel. The periphery of the region, without enhancing the center of the region, causes a sudden change in the contrast between the center and the periphery of the region in the processed image.
[0085] Step 104: Obtain a final grayscale image according to the original grayscale image, the equalized grayscale image, and the decision factor distribution map, wherein the final grayscale image corresponds to the second marked area The grayscale value of the pixel is the grayscale value of the corresponding pixel in the equalized grayscale image, and the grayscale value of the pixel corresponding to the first marked area in the final grayscale image is the original grayscale image The gray value of the corresponding pixel in .
[0086] In step 104, the final grayscale image can be calculated according to the following formula:
[0087] I(i,j)=G(i,j)*H(i,j)+(1-G(i,j))*A(i,j);
[0088] Among them, I is the final grayscale image, G is the decision factor distribution map (the pixel in the first marked area is 0, and the pixel in the second marked area is 1), H is the equalized grayscale image, and A is the original grayscale image . Among them, I(i,j) is the pixel in row i and column j in the final grayscale image, G(i,j) is the pixel in row i and column j in the decision factor distribution map, H(i,j) In order to equalize the pixel in row i and column j in the grayscale image, A(i,j) is the pixel in row i and column j in the original grayscale image.
[0089] Step 105: Restoring the processed image according to the final grayscale image.
[0090] In this step, the final grayscale image is restored to an R (red) G (green) B (blue) image to obtain a processed original image.
[0091]In the embodiment of the present invention, the original grayscale image and the equalized grayscale image are first generated according to the original image, and then the decision factor distribution map is generated according to the original grayscale image. In the decision factor distribution map, the first marked area includes the original In the area where the pixels are adjacent to each other and the standard deviation is smaller than the set value, since the gray difference value of the pseudo-flat part is small, the standard deviation of the pixels in the pseudo-flat part is also small, so the first marked area corresponds to The area in the original image is a pseudo-flat area, and the pseudo-flat area is not enhanced, that is, the histogram equalization process is not performed, and the gray value of the pixel in the original grayscale image is used to represent the second marked area. The pixel gray value representation in the processed gray scale image, that is, the pixel gray value representation in the equalized gray scale image; since the above processing method does not enhance the pseudo-flat part, it will not enlarge the pseudo-flat part The gap between the gray scales avoids the deterioration of the quality of the pseudo-flat part of the image and ensures the quality of the image.
[0092] image 3 is a schematic structural diagram of an image processing device provided by an embodiment of the present invention, see image 3 , the image processing apparatus includes: a generation module 201 , a histogram equalization module 202 , a first processing module 203 , a second processing module 204 and a third processing module 205 .
[0093] Wherein, the generation module 201 is used to generate the original grayscale image of the original image. The histogram equalization module 202 is configured to perform histogram equalization processing on the original grayscale image to obtain an equalized grayscale image. The first processing module 203 is configured to generate a decision factor distribution map according to the original grayscale image, the decision factor distribution map includes a first marked area and a second marked area, and the first marked area includes the original image An area where pixels with adjacent pixel positions and a standard deviation smaller than a set value are located, the second marked area is an area in the decision factor distribution map other than the first marked area. The second processing module 204 is configured to obtain a final grayscale image according to the original grayscale image, the equalized grayscale image, and the decision factor distribution map, wherein the final grayscale image is identical to the first grayscale image The grayscale value of the pixel corresponding to the second marked area is the grayscale value of the corresponding pixel in the equalized grayscale image, and the grayscale value of the pixel corresponding to the first marked area in the final grayscale image is The gray value of the corresponding pixel in the original gray image. The third processing module 205 is configured to restore the processed image according to the final grayscale image.
[0094] In the embodiment of the present invention, the original grayscale image and the equalized grayscale image are first generated according to the original image, and then the decision factor distribution map is generated according to the original grayscale image. In the decision factor distribution map, the first marked area includes the original In the area where the pixels are adjacent to each other and the standard deviation is smaller than the set value, since the gray difference value of the pseudo-flat part is small, the standard deviation of the pixels in the pseudo-flat part is also small, so the first marked area corresponds to The area in the original image is a pseudo-flat area, and the pseudo-flat area is not enhanced, that is, the histogram equalization process is not performed, and the gray value of the pixel in the original grayscale image is used to represent the second marked area. The pixel gray value representation in the processed gray scale image, that is, the pixel gray value representation in the equalized gray scale image; since the above processing method does not enhance the pseudo-flat part, it will not enlarge the pseudo-flat part The gap between the gray scales avoids the deterioration of the quality of the pseudo-flat part of the image and ensures the quality of the image.
[0095] In the embodiment of the present invention, the first processing module 203 is configured to calculate the grayscale values in the original grayscale image according to the grayscale values of pixels in a certain area centered on each pixel in the original grayscale image. the standard deviation of each pixel to obtain a standard deviation distribution map, the standard deviation distribution map includes the standard deviation of each pixel in the original grayscale image; the pixels whose standard deviation in the standard deviation distribution map is less than a set value dividing into the first marked area, and dividing the area in the standard deviation distribution map except the first marked area into the second marked area to obtain the decision factor distribution map.
[0096] In the above-mentioned process of generating the decision factor distribution diagram, the first processing module 203 first calculates the standard deviation distribution diagram of the original grayscale image, and divides the first In the marked area, since the gray difference value of the pseudo-flat part is small, the standard deviation of the pixels in the pseudo-flat part is also small, so the part in the standard deviation distribution map whose standard deviation is smaller than the set value is judged as a pseudo-flat area (ie first marked area).
[0097] Further, when the first processing module 203 divides the first marked area and the second marked area, it can specifically be implemented in a binarized manner, and the specific process is as follows: the pixels whose standard deviation is smaller than the set value in the standard deviation distribution map are divided into The corresponding pixel value in the decision factor distribution map is set to 0, and the pixel value corresponding to the pixel in the decision factor distribution map whose standard deviation is greater than or equal to the set value in the standard deviation distribution map is set to 1, so the pixels in the decision factor distribution map Pixels with a value of 0 belong to the first marked area, and pixels with a pixel value of 1 belong to the second marked area.
[0098] After the area is divided by binarization, it is simple and convenient to determine whether the pixel corresponds to the first marked area or the second marked area according to the pixel value in the decision factor distribution map in the subsequent processing.
[0099] Figure 4 is a schematic structural diagram of the first processing module 203 provided by the embodiment of the present invention, see Figure 4 , the first processing module 203 includes: a first calculation submodule 231 , an average filtering submodule 232 , a second calculation submodule 233 , a third calculation submodule 234 and a fourth calculation submodule 235 .
[0100] Wherein, the first calculation submodule 231 is used to calculate the square value of the grayscale value of each pixel of the original grayscale image to form a grayscale square image; The degree map and the gray square map are subjected to mean filtering to generate the first expected map and the second expected map respectively; the second calculation submodule 233 is used to calculate the gray value of each pixel of the first expected map The square value of the third expected map is obtained; the third calculation submodule 234 is used to calculate the difference between the second expected map and the third expected map to obtain a difference image; the fourth calculation submodule 235 uses The standard deviation distribution map is obtained by taking the square root of the gray value of each pixel of the difference image. The standard deviation distribution map obtained in this manner can reflect the gray level difference between each pixel and surrounding pixels, so that the pseudo-flat area can be divided into the first marked area when performing subsequent area division.
[0101] In the embodiment of the present invention, the mean value filtering sub-module 232 is used to perform mean value filtering on the original grayscale image and the grayscale square image respectively by using a filter template with a size of m×m, and the value range of m for 10-20.
[0102] Using m in this value range ensures that the standard deviation distribution map can better indicate the pseudo-flat area in the original image, so as to ensure that the pseudo-flat area will not be enhanced, thereby avoiding image quality degradation.
[0103] Preferably, the value of m is 15, and using 15 as the value of m can distinguish the pseudo-flat area in the original image to the greatest extent.
[0104] In the embodiment of the present invention, the first processing module 203 is further configured to update the decision factor distribution map after the generation of the decision factor distribution map according to the original grayscale image, so that all updated In the decision factor distribution diagram, the first marked area includes an area of pixels in the original image whose pixel positions are adjacent and whose standard deviation is less than a set value, and in the original image whose pixel positions are adjacent and whose standard deviation is greater than or The number of pixels in the area of pixels equal to the set value is less than the threshold.
[0105] The update process of the above-mentioned decision factor distribution map actually uses the hole filling algorithm, and divides the pixels with a small number of values greater than or equal to the threshold into the second marking area, and these pixels are enhanced during processing, so that the entire The regions are all enhanced, so as to avoid the situation that only the periphery of a certain region is enhanced, but not the center of the region, resulting in a sudden change in the contrast between the center and the periphery of the region in the processed image.
[0106] In the embodiment of the present invention, the threshold is 8%-15% of the number of pixels in the original image. The threshold value of this value range is adopted, so that only when the number of pixels in the center of the area is greater than or equal to the threshold is small enough, the hole filling algorithm is processed, so as to avoid the enhancement of too many pixels in the middle of an area whose value is greater than or equal to the threshold, resulting in false Degraded image quality in flat areas.
[0107] Preferably, the value of the threshold is 10%. At this time, it is possible to avoid enhancing too many pixels in the middle of a region whose value is greater than or equal to the threshold, resulting in deterioration of the image quality of the pseudo-flat region, and to avoid only enhancing a certain pixel. The periphery of the region, without enhancing the center of the region, causes a sudden change in the contrast between the center and the periphery of the region in the processed image.
[0108] In the embodiment of the present invention, the value range of the set value is 1-5. Using the set value of this value range ensures that the decision factor distribution map can better indicate the pseudo-flat area in the original image, so as to ensure that the pseudo-flat area will not be enhanced, thereby avoiding image quality degradation.
[0109] Preferably, the set value is 1, and using 1 as the set value can distinguish the pseudo-flat area in the original image to the greatest extent.
[0110] In the embodiment of the present invention, the second processing module 204 can be used to calculate the final grayscale image according to the following formula: I(i,j)=G(i,j)*H(i,j)+(1-G( i,j))*A(i,j);
[0111] Among them, I is the final grayscale image, G is the decision factor distribution map (the pixel in the first marked area is 0, and the pixel in the second marked area is 1), H is the equalized grayscale image, and A is the original grayscale image . Among them, I(i,j) is the pixel in row i and column j in the final grayscale image, G(i,j) is the pixel in row i and column j in the decision factor distribution map, H(i,j) In order to equalize the pixel in row i and column j in the grayscale image, A(i,j) is the pixel in row i and column j in the original grayscale image.
[0112] It should be noted that: the image processing device provided by the above embodiment only uses the division of the above functional modules as an example for illustration during image processing. In practical applications, the above function allocation can be completed by different functional modules according to needs. The internal structure of the device is divided into different functional modules to complete all or part of the functions described above. In addition, the image processing apparatus provided by the above embodiments and the image processing method embodiments belong to the same concept, and the specific implementation process thereof is detailed in the method embodiments, and will not be repeated here.
[0113] Those of ordinary skill in the art can understand that all or part of the steps for implementing the above embodiments can be completed by hardware, and can also be completed by instructing related hardware through a program. The program can be stored in a computer-readable storage medium. The above-mentioned The storage medium mentioned may be a read-only memory, a magnetic disk or an optical disk, and the like.
[0114] The above are only preferred embodiments of the present invention, and are not intended to limit the present invention. Any modifications, equivalent replacements, improvements, etc. made within the spirit and principles of the present invention should be included in the protection scope of the present invention Inside.