A global mapping method applied to the analysis of trade statistics

A statistical data, global technology, applied in the field of global map marking of trade statistical data analysis, can solve problems such as the inability to meet the needs of enterprise visualization analysis

Inactive Publication Date: 2019-03-08
大连瀚闻资讯有限公司
View PDF3 Cites 0 Cited by
  • Summary
  • Abstract
  • Description
  • Claims
  • Application Information

AI Technical Summary

Problems solved by technology

With the increasing informatization of enterprises and the increasing complexity of data visualization processing, traditional BI products with reports as the main function are gradually unable to meet the visual analysis needs of enterprises.

Method used


Image

  • A global mapping method applied to the analysis of trade statistics

Examples


Embodiment Construction

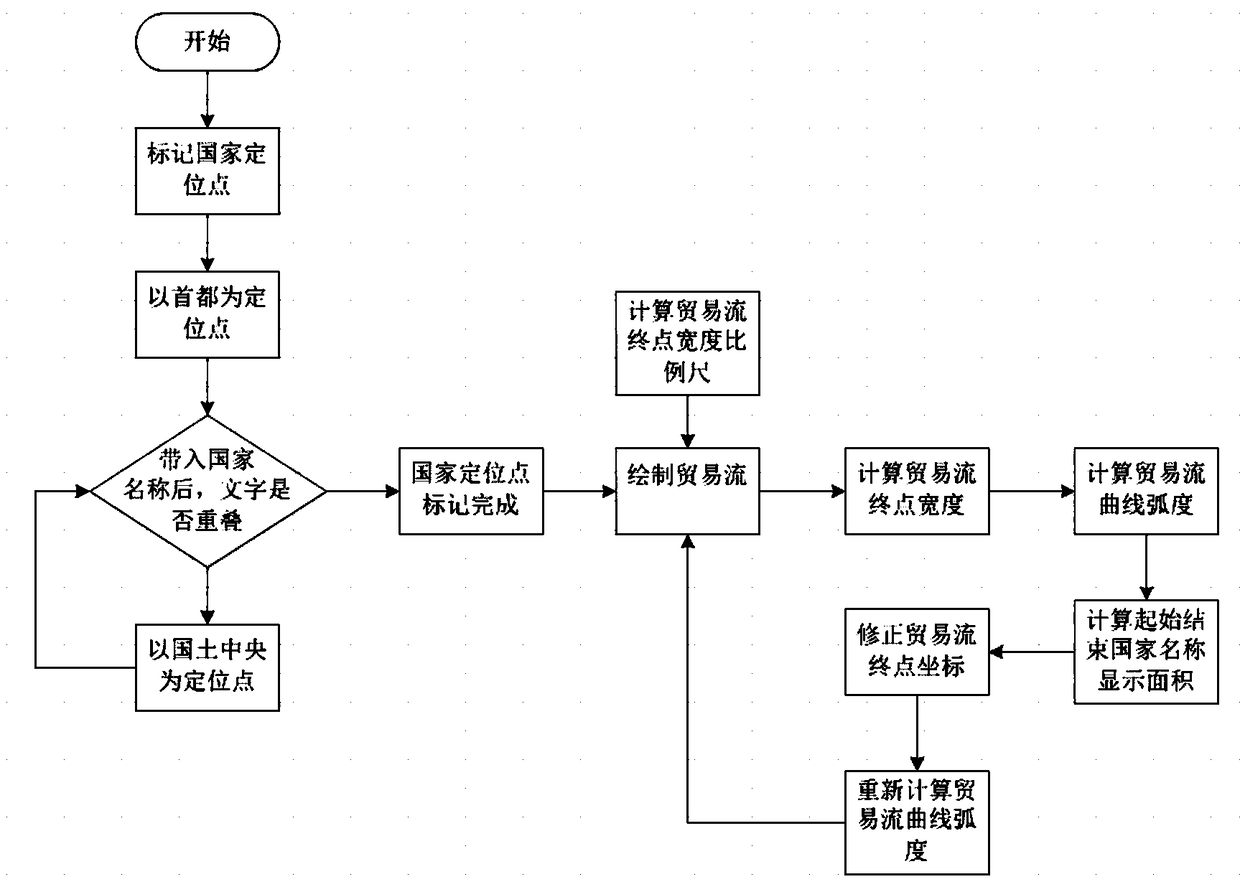
[0023] In order to enable those skilled in the art to better understand the solutions of the present invention, the following will clearly and completely describe the technical solutions in the embodiments of the present invention in conjunction with the drawings in the embodiments of the present invention. Obviously, the described embodiments are only It is an embodiment of a part of the present invention, but not all embodiments. Based on the embodiments of the present invention, all other embodiments obtained by persons of ordinary skill in the art without making creative efforts shall fall within the protection scope of the present invention.

[0024] It should be noted that the terms "first" and "second" in the description and claims of the present invention and the above drawings are used to distinguish similar objects, but not necessarily used to describe a specific sequence or sequence. It is to be understood that the data so used are interchangeable under appropriate ...


PUM


Abstract

The present invention provides a global map marking method applied to the analysis of trade statistics. The invention comprises the following steps of based on the constructed world map model, takingthe capitals of various countries as main positioning points to complete the marking of the national positioning points; inputting the full name of the goods, according to the real-time update of therelevant goods in the database of trade information, completing the start point to the end of the trade flow mapping; exporting the trade flow arc of the corresponding goods through the visualizationequipment. The method draws the trade direction on the map and adds interactive events to form a complete visual display of the international trade direction, realizes the customization module of thevisual display of the international trade data, and helps the user to intuitively understand the trade direction.

Description

technical field [0001] The invention relates to the technical field of trade visualization, in particular to a global map representation method applied to the analysis of trade statistical data. Background technique [0002] Nowadays, data visualization has become an important skill that we often come into contact with in our daily work. With the help of Excel or other data visualization tools, we can easily generate various data charts to make the data more understandable. For enterprises, the advent of the era of big data has made the operation and management of enterprises more refined, which also requires data visualization. [0003] In the past, enterprises mainly used traditional BI tools to understand the progress of the business by regularly viewing data reports. With the increasing informatization of enterprises and the complexity of data visualization processing, traditional BI products with reports as the main function are gradually unable to meet the visual anal...

Claims


Application Information

Patent Timeline
IPC IPC(8): G06F16/29
Inventor 童友俊
Owner 大连瀚闻资讯有限公司
Why Eureka
Try Eureka