
Algorithm for predicting price rise and fall by combining energy values with big data and application

A technology of energy value and big data, which is applied in marketing and other directions, can solve the problems of missing entry opportunities, quantitatively reflecting the range, strength, and inflexibility of real-time price changes, and achieves low possibility of stop loss, high winning rate guarantee, The effect of large profit margin

Pending Publication Date: 2019-05-10
上海句石智能科技有限公司
View PDF0 Cites 0 Cited by
  • Summary
  • Abstract
  • Description
  • Claims
  • Application Information

AI Technical Summary

Problems solved by technology

[0002] The analysis methods and technical indicators in the existing technology are lagging. At present, the market trend is analyzed or synthesized based on the data analysis or synthesis of a specific period in the past. The trend can only be reflected after a period of time, and the best opportunity to enter the market is often missed
[0003] Secondly, the existing analysis methods are not accurate enough and are relatively subjective. The current methods cannot accurately and quantitatively reflect the magnitude and intensity of real-time price changes, and the current analysis methods such as golden cross dead cross, deviation, and moving average are all subjective. sex factor
[0004] In addition, the existing cycle calculation methods are not flexible enough. The current analysis methods are often minute charts, 5-minute charts, hourly charts, daily charts, weekly charts, etc., which are inconvenient to reflect 1.2 hours and 52 minutes. Flexible, convenient for multi-cycle analysis

Method used


Image

  • Algorithm for predicting price rise and fall by combining energy values with big data and application

Examples


Embodiment 1

[0020] This embodiment provides an algorithm that combines energy value with big data to predict price rise and fall. The steps of the specific embodiment are as follows:

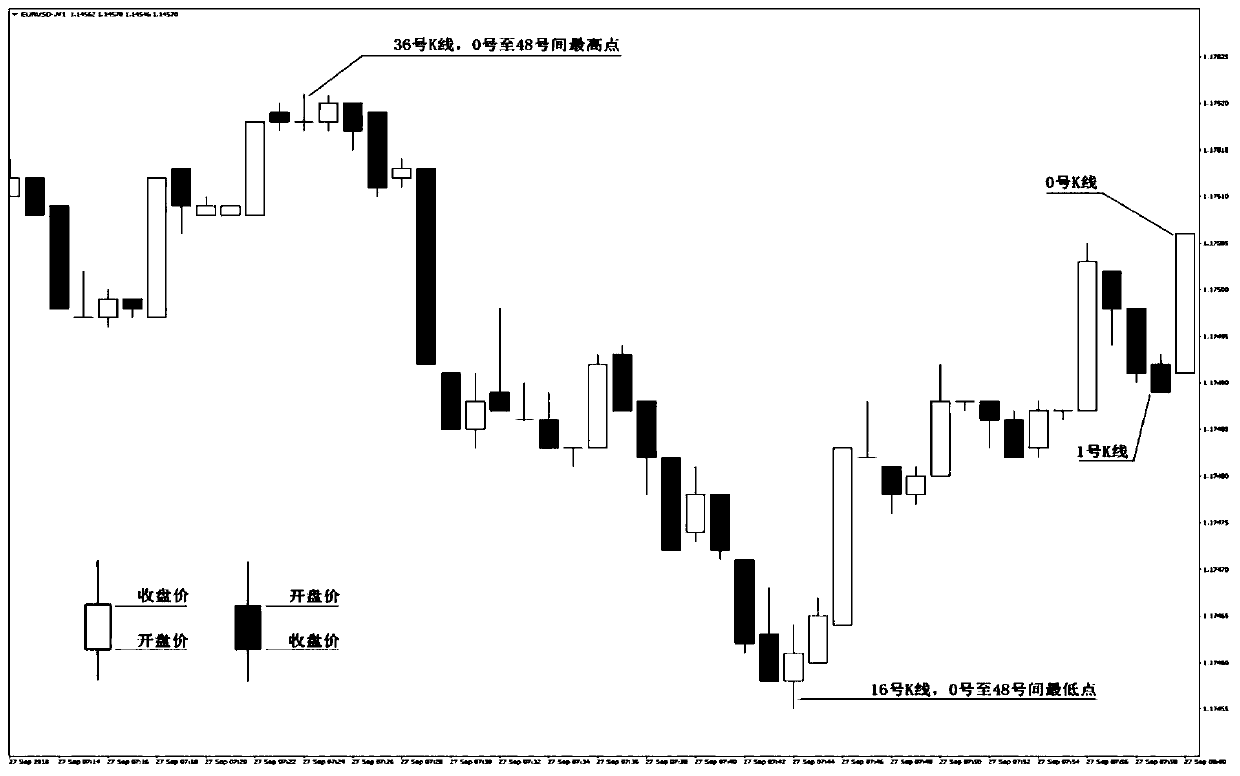
[0021] S1: Scan 50 K-lines to determine the highest and lowest points within the 50 K-lines, refer to the attached figure 1 , the highest point is the No. 36 K line, and the lowest point is the No. 16 K line. According to the numbers of the highest point and the lowest point, it is determined that the highest point is in front and the lowest point is in the back.

[0022] S2: Calculate the energy value from the lowest point to the current No. 0 K-line 0.00049 (that is, the energy value of No. 0 K-line + the energy value of No. 1 K-line + ... the energy value of No. 16 K-line = 0.00049), and calculate from the highest point ( No. 36 K line) to the lowest point (No. 17 K line) energy value -0.00066.

[0023] S3: There are 20 K-lines from No. 36 K-line to No. 17 K-line, and 17 K-lines from No. 16 K-line to No...


PUM


Abstract

The invention discloses an algorithm for predicting price rise and fall by combining energy values with big data and application. On the basis of a K line graph analyzing the price trend and on the basis of minute chart, subtracting the opening price of each K line from the closing price of each K line to obtain the energy value of each K line; if the energy value is positive, the K line is a positive line, and if the energy value is negative, the K line is a negative line, and the energy values of the K lines at different stages are accumulated to obtain the energy values with different durations, such as extremely short term, short term, middle term, middle and long term, long term and ultra-long term. The method is accurate and timely, can quantify, can quantify rising energy or fallingenergy of different stages, and can also timely enter or reject entry. According to the method, the winning rate of market prediction is relatively high, and after historical big data verification and parameter optimization, an automatic transaction system or index based on an energy value is based on an objective energy value and probability when an automatic transaction (or transaction signal sending) is executed, so that relatively high winning rate guarantee can be achieved.

Description

technical field [0001] The invention relates to the technical field of intelligent data analysis, in particular to an algorithm and application of energy value combined with big data to predict price rise and fall. Background technique [0002] The analysis methods and technical indicators in the existing technology are lagging. At present, the market trend is analyzed or synthesized based on the data analysis or synthesis of a specific period in the past. The trend can only be reflected after a period of time, and the best opportunity to enter the market is often missed . [0003] Secondly, the existing analysis methods are not accurate enough and are relatively subjective. The current methods cannot accurately and quantitatively reflect the magnitude and intensity of real-time price changes, and the current analysis methods such as golden cross dead cross, deviation, and moving average are all subjective. sex factor. [0004] In addition, the existing cycle calculation m...

Claims


Application Information

Patent Timeline
Patent Type & Authority Applications(China)
IPC IPC(8): G06Q30/02
Inventor 杨定生
Owner 上海句石智能科技有限公司
Learn More