A marine observation big data visualization analysis method based on a complex network

A complex network and analysis method technology, applied in the field of visual analysis of ocean observation big data, can solve problems such as huge data volume

Active Publication Date: 2019-06-28
OCEAN UNIV OF CHINA
View PDF2 Cites 14 Cited by
  • Summary
  • Abstract
  • Description
  • Claims
  • Application Information

AI Technical Summary

Problems solved by technology

[0010] The disadvantage of constructing a network model based on the Pearson correlation coefficient is that using the Pearson correlation coefficient to measure the similarity between two sea areas simulates the ocean system as a complex system
[0012] However, constructing a complex ocean network by measuring the nonlinear correlation between two sea areas through mutual information restores the nonlinear dynamics of the ocean system, but the accuracy of mutual information requires too much data

Method used


Image

  • A marine observation big data visualization analysis method based on a complex network
  • A marine observation big data visualization analysis method based on a complex network
  • A marine observation big data visualization analysis method based on a complex network

Examples


Embodiment Construction

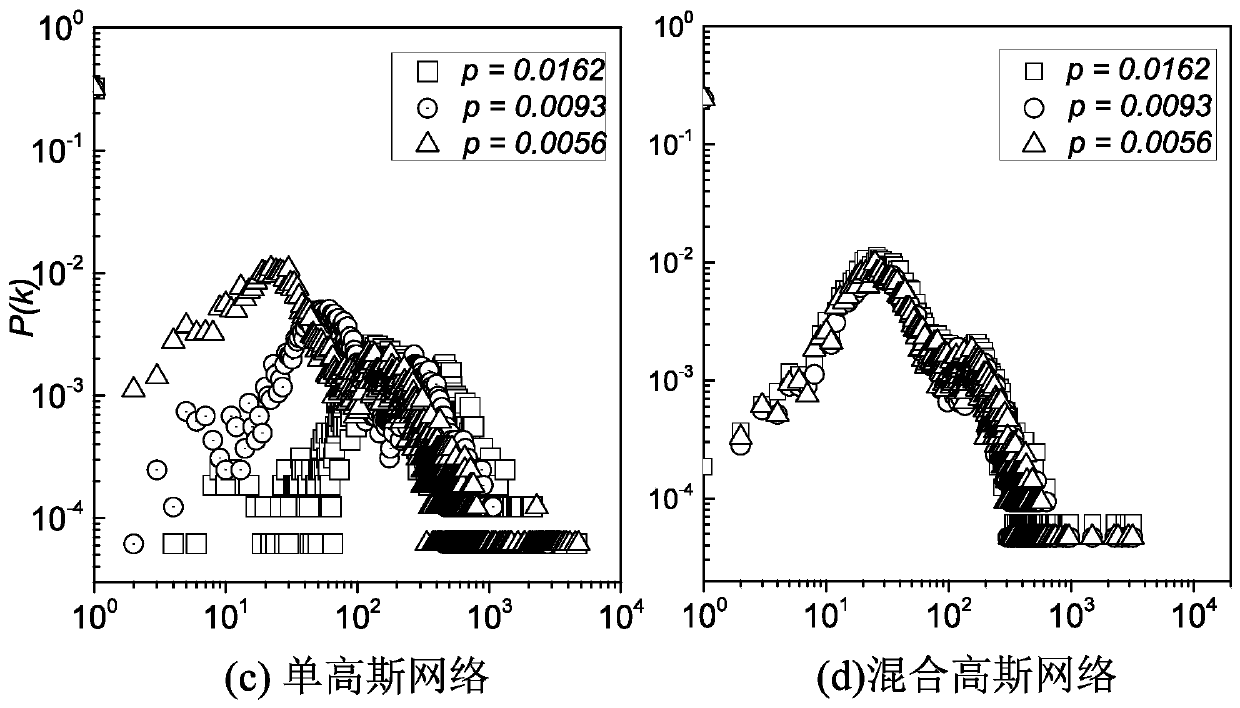
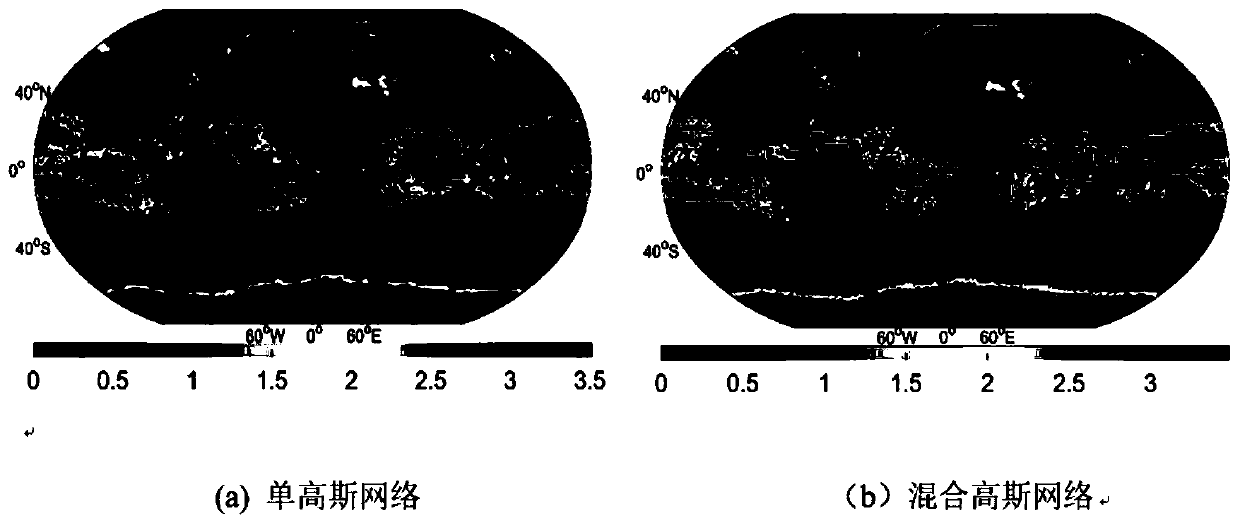
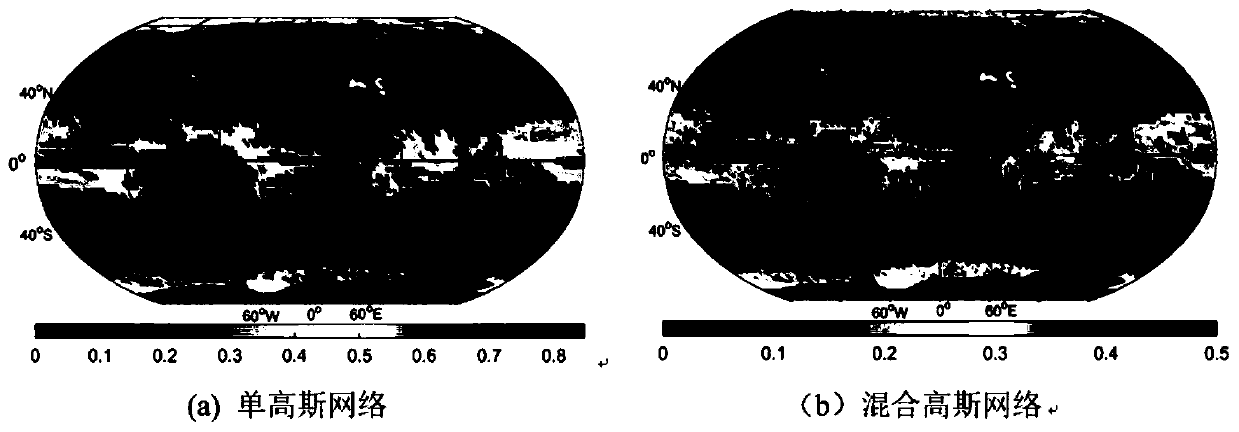
[0078] The ocean observation data is modeled into a complex network based on the Gaussian mixture model through complex network technology theory and then visualized and analyzed. The modeling and analysis process is as follows: figure 1 As shown, the main steps of network modeling are introduced by taking the sea surface temperature data in 2010 as an example. Other big data can be analyzed in the same mode. It can be seen that this method of the present invention can be used as a universally applicable tools with strong versatility.

[0079] 1. Big data data preprocessing network node modeling

[0080]Download the daily average sea surface temperature data provided by NOAA with a resolution of 3600*7200 in latitude and longitude. In order to make the network structure scale more reasonable, the original data is divided into 90*180 grids. The data contained in the grid is a three-dimensional matrix of 40*40*365; in order to preserve the dynamics and randomness of the annual ...


PUM


Abstract

A marine observation big data visualization analysis method based on a complex network comprises the steps of performing grid division on original marine observation big data, constructing daily average data in a grid into a single Gaussian model and a mixed Gaussian model, and obtaining nodes represented by probability feature vectors; Determining the similarity between any two nodes in the single Gaussian network and the multi-Gaussian network to obtain a similarity matrix; And setting a threshold value to obtain an adjacent matrix, calculating the degree, the clustering coefficient and thenode betweenness of each node according to the adjacent matrix, and visualizing or drawing the degree, the clustering coefficient and the node betweenness on double logarithm coordinates or on a map.According to the invention, the Gaussian mixture model is combined with the complex network theory for the first time; The invention provides a marine observation big data analysis and visualization method, the fluctuation of ocean motion reflected on the data is restored to the maximum extent, and model parameters are used for expressing high-dimensional ocean data, so that the defect that a network model constructed on the basis of Pearson similarity can only measure time sequence data is overcome, and the calculation speed is also improved.

Description

technical field [0001] The invention relates to a method for visualization and analysis of ocean observation big data based on a complex network, in particular to modeling and visualization analysis of a complex network of long-scale time series data, and belongs to the field of big data analysis. Background technique [0002] The ocean has a non-negligible impact on the global climate, and the abnormal interaction between it and the atmosphere can cause global extreme climate events. For example, the interaction between abnormal sea wind and sea water causes the famous El Niño and La Niña events, the correlation between sea surface pressure and atmospheric circulation causes the North American Pacific Oscillation (PNA), and the interaction between atmospheric pressure and ocean currents causes the North Atlantic Oscillation (NAO), etc. The abnormal climate events caused by the above-mentioned climate mode will not only cause serious floods and droughts globally, but also se...

Claims


Application Information

Patent Timeline
Patent Type & Authority Applications(China)
IPC IPC(8): G06F16/29
CPCY02A90/10
Inventor 孙鑫罗新艳董军宇
Owner OCEAN UNIV OF CHINA
Why Eureka
Try Eureka