Two-dimensional scalar field data visualization method and system based on color table optimization

A color table and scalar field technology, applied in the field of two-dimensional scalar field data visualization, can solve problems such as inability to express continuous features, color table does not consider data, etc., to achieve the effect of maximizing front and background contrast and wide application prospects

Active Publication Date: 2019-08-23
SHANDONG UNIV
View PDF7 Cites 12 Cited by
  • Summary
  • Abstract
  • Description
  • Claims
  • Application Information

AI Technical Summary

Problems solved by technology

However, this type of work mainly focuses on the color table itself without considering the data
In addition, some scholars in the field propose to adjust the control points in the color table according to statistical metadata or histogram equalization, but such methods cannot express continuous features in the global data range

Method used


Image

  • Two-dimensional scalar field data visualization method and system based on color table optimization
  • Two-dimensional scalar field data visualization method and system based on color table optimization
  • Two-dimensional scalar field data visualization method and system based on color table optimization

Examples


Embodiment 1

[0050] In the first embodiment, this embodiment provides a method for visualizing two-dimensional scalar field image data based on color table optimization;

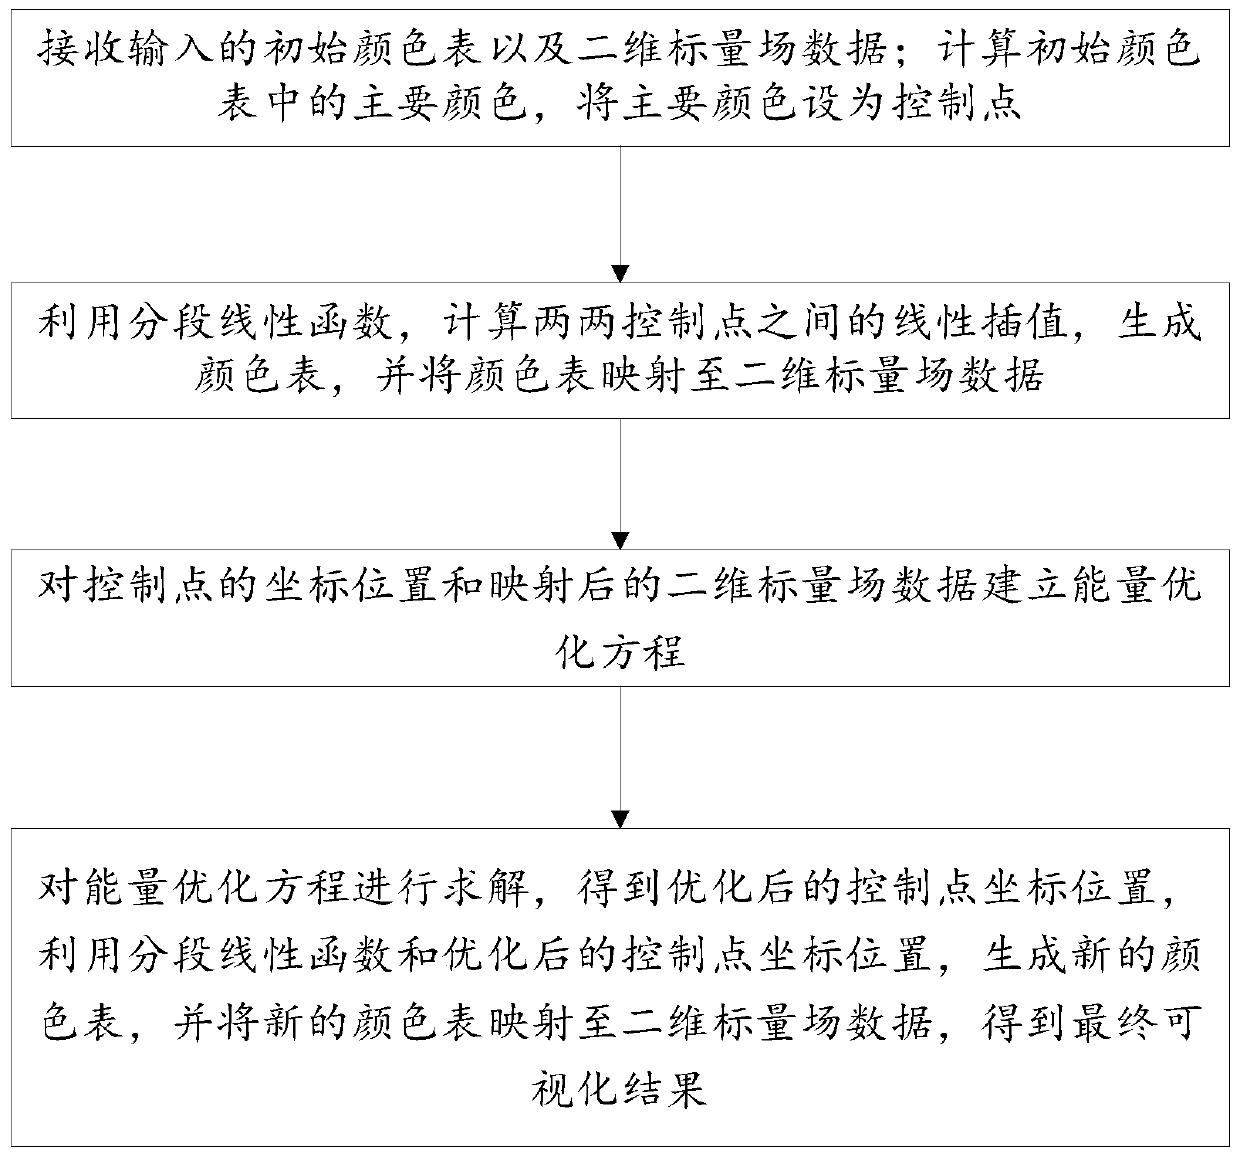
[0051] figure 1 This is the process framework diagram of this disclosure. Two-dimensional scalar field image data visualization method based on color table optimization, including:

[0052] S1: Receive the inputted initial color table and two-dimensional scalar field data; calculate the main color in the initial color table, and set the main color as the control point;

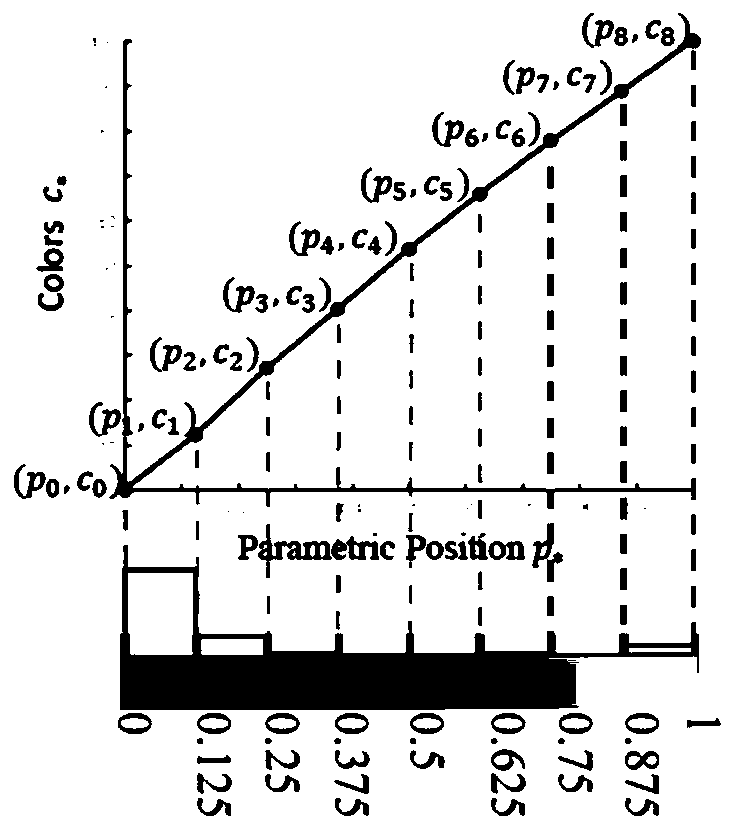
[0053] S2: Use the piecewise linear function to calculate the linear interpolation between the two control points, generate the color table, and map the color table to the two-dimensional scalar field data; as shown in Figure 2(a), Figure 2(b), Figure 2 (c) and the control points shown in Figure 2(d);

[0054] S3: Establish an energy optimization equation for the coordinate position of the control point and the mapped two-dimensional scalar field data; the coor...

Embodiment 2

[0131] In the second embodiment, this embodiment also provides a two-dimensional scalar field data visualization system optimized based on a color table;

[0132] A two-dimensional scalar field image data visualization system based on color table optimization, including:

[0133] Input module, which is configured to receive the input initial color table and two-dimensional scalar field data; calculate the main colors in the initial color table, and set the main colors as control points;

[0134] The mapping module is configured to use the piecewise linear function to calculate the linear interpolation between the two control points, generate the color table, and map the color table to the two-dimensional scalar field data; as shown in Figure 2(a), Figure 2( b), the control points shown in Figure 2(c) and Figure 2(d);

[0135] Energy optimization equation establishment module, which is configured to establish an energy optimization equation for the coordinate position of the control po...

Embodiment 3

[0137] Embodiment 3. This embodiment also provides an electronic device, including a memory, a processor, and computer instructions stored in the memory and running on the processor. When the computer instructions are executed by the processor, each of the methods is completed. The operation, for the sake of brevity, will not be repeated here.

[0138] The electronic device may be a mobile terminal and a non-mobile terminal. The non-mobile terminal includes a desktop computer. The mobile terminal includes a smart phone (Smart Phone, such as an Android phone, an IOS phone, etc.), smart glasses, a smart watch, a smart bracelet, and a tablet computer. , Notebook computers, personal digital assistants and other mobile Internet devices that can communicate wirelessly.


PUM


Abstract

The invention discloses a two-dimensional scalar field data visualization method and system based on color table optimization. The method comprises the steps of receiving an input initial color tableand two-dimensional scalar field data; calculating a main color in the initial color table, and setting the main color as a control point; calculating linear interpolation between every two control points by using a piecewise linear function, generating a color table, and mapping the color table to the two-dimensional scalar field data; establishing an energy optimization equation for the coordinate position of the control point and the mapped two-dimensional scalar field data, wherein the coordinate positions of the control points are numerical values between 0 and 1 obtained by normalizing index values in a color table corresponding to the control points; solving the energy optimization equation to obtain an optimized control point coordinate position, generating a new color table by using the piecewise linear function and the optimized control point coordinate position, and mapping the new color table to the two-dimensional scalar field data to obtain a final visualization result.

Description

Technical field [0001] The present disclosure relates to the technical field of two-dimensional scalar field data visualization, and in particular to a two-dimensional scalar field data visualization method and system based on color table optimization. Background technique [0002] The statements in this section merely mention background technologies related to the present disclosure, and do not necessarily constitute prior art. [0003] In the process of implementing the present disclosure, the inventor found the following technical problems in the prior art: [0004] Two-dimensional scalar data is a common way of data expression in scientific simulations and applications. The visualization of two-dimensional scalar data is very important for scientists to discover the features in the data and distinguish the values. Among the many two-dimensional scalar data visualization methods, color table mapping is an effective and commonly used method, which refers to the mapping process of ...

Claims


Application Information

Patent Timeline
Patent Type & Authority Applications(China)
IPC IPC(8): G06F16/26G06T11/00
CPCG06F16/26G06T11/001G06T11/206G06T7/90G06T3/4007G06T2207/10024
Inventor 汪云海曾琼王银桥张文婷屠长河
Owner SHANDONG UNIV
Why Eureka
Try Eureka