A kind of heterogeneous visual acuity chart and visual acuity testing method

A test method and eye chart technology, applied in medical science, diagnosis, eye test equipment, etc., can solve problems such as difficulty in judging the authenticity of vision test results, large errors in low vision test, etc., to improve the accuracy of the test and improve the accuracy rate effect

Active Publication Date: 2021-08-03
QINGDAO UNIV
View PDF20 Cites 0 Cited by
  • Summary
  • Abstract
  • Description
  • Claims
  • Application Information

AI Technical Summary

Problems solved by technology

[0005] The present invention aims at the above-mentioned deficiencies such as difficulty in judging the authenticity of vision test results and large error in low vision test existing in the existing vision test process, and provides a heterogeneous vision chart, a vision test device and a test method

Method used


Image

  • A kind of heterogeneous visual acuity chart and visual acuity testing method
  • A kind of heterogeneous visual acuity chart and visual acuity testing method
  • A kind of heterogeneous visual acuity chart and visual acuity testing method

Examples


Embodiment 1

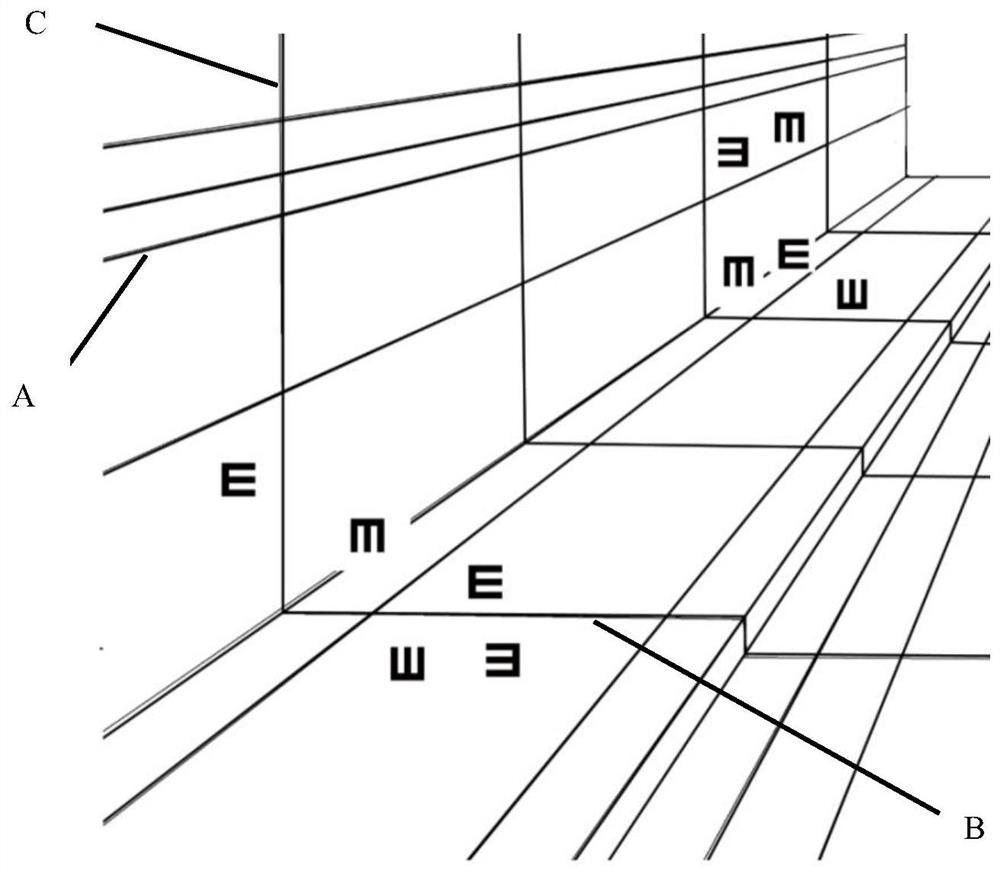
[0057] Example 1: see figure 1, a heterogeneous visual acuity chart, in the heterogeneous visual acuity chart, it includes 2 kinds of visual targets with different sizes and a perspective view that affects the visual depth of different sizes of visual targets, and the first type of visual targets includes 5 small-sized visual targets Optotypes, the second type of optotypes include 5 large-sized optotypes, and the first type of optotypes and the second type of optotypes are placed in different positions. The perspective view includes a first line A, a second line B and a third line C, several first lines A are concentrated to one point along the depth direction, and several second lines B parallel to each other are parallel to the first line in the horizontal direction The grid pattern formed by the intersection of A forms a horizontal plane, and several parallel third lines C intersect with the first line A in the vertical direction to form a number of grid figures arranged i...

Embodiment 2

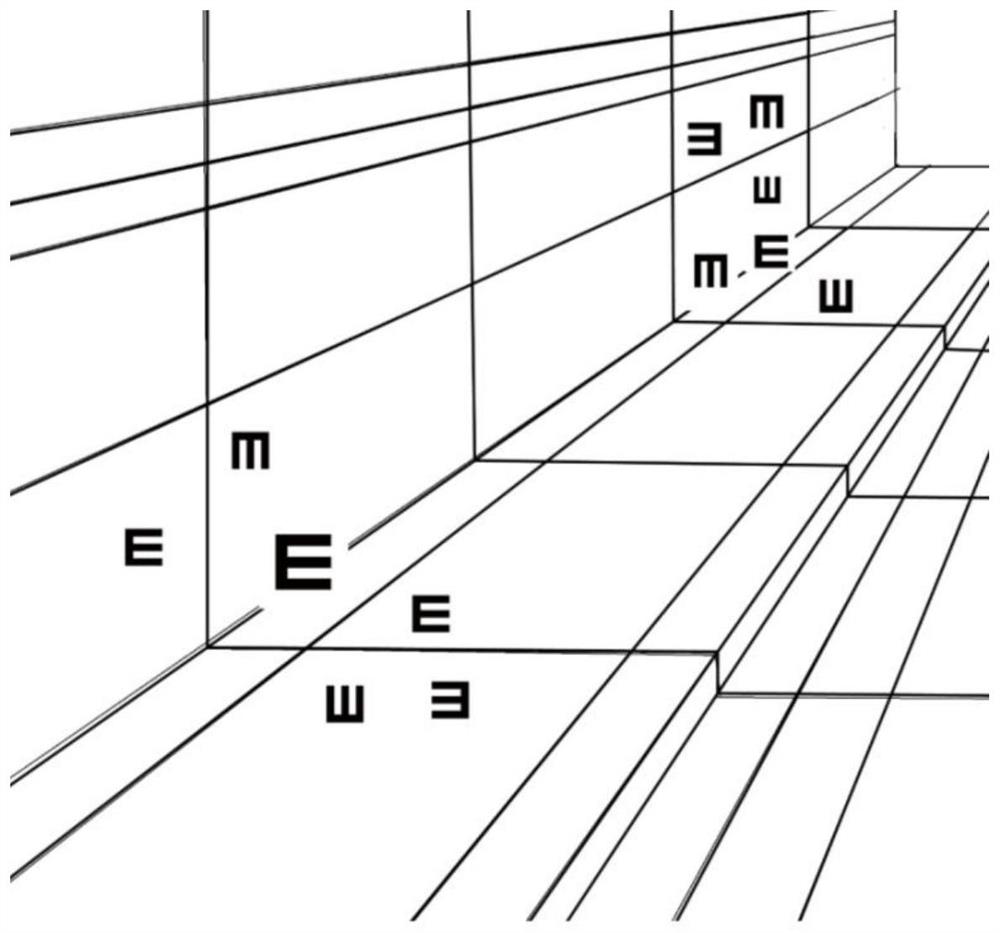
[0058] Example 2: see figure 2 , a heterogeneous vision chart, in the heterogeneous vision chart, it includes 2 kinds of optotypes with different sizes, a perspective view that affects the visual depth of the different sizes of the optotypes, and 2 E-word optotype graphics composed of lines , the first type of optotype includes 5 small-sized optotypes, the second type of optotype includes 5 large-sized optotypes, and the first type of optotype and the second type of optotype are placed in different positions. The structure in the perspective view is the same as that in Embodiment 1. Among the two E-word optotype graphics, the size of one E-word optotype graphic is not greater than 0.5 times that of the first type of optotype, and the size of the other E-word optotype graphic is not less than 1.5 times that of the second type of optotype. Specifically, the upper right area of ​​the heterogeneous visual acuity chart is the first type of optotype, among the five optotypes, the ...

Embodiment 3

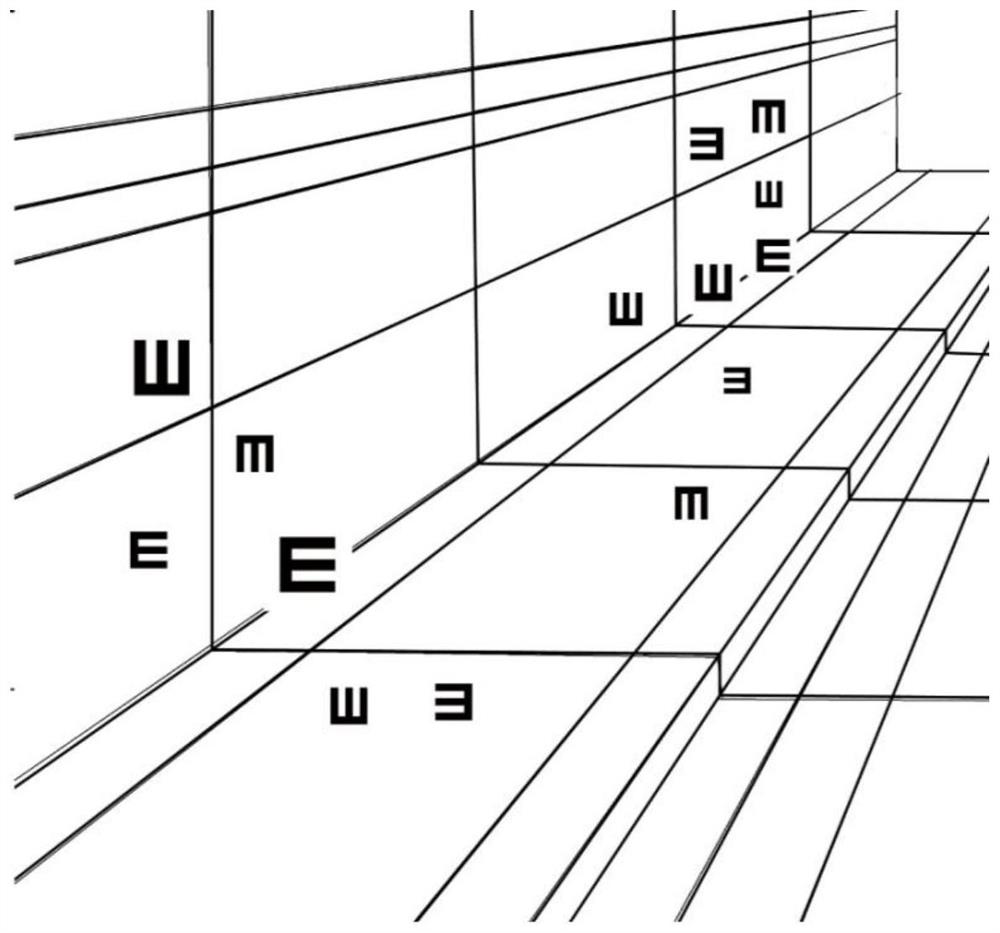
[0059] Embodiment 3: see image 3 , a heterogeneous visual acuity chart, in the heterogeneous visual acuity chart, including two kinds of optotypes of different sizes, a perspective view that affects the visual depth of different sizes of optotypes, and four E-word optotype graphics composed of lines , the first type of optotype includes 5 small-sized optotypes, the second type of optotype includes 5 large-sized optotypes, the 2 types of optotypes are divided into 2 groups, and the first group of optotypes includes 4 first-type optotypes The second group of optotypes includes one second type of optotype and four first type of optotypes, and the optotypes of the first group and the second group are placed in different places. s position. Among the 4 E-word optotype graphics, there are 2 small E-word optotype graphics of the same size and 2 large E-word optotype graphics of the same size, and the size of the small E-word optotype graphics is not larger than that of the first ty...


PUM


Abstract

The invention relates to a heterogeneous vision chart and a method for visual acuity testing. The heterogeneous vision chart is a misaligned view composed of a heterogeneous reference area and at least two types of optotypes of different sizes. The heterogeneous reference area can lead to different vision Misjudgment of the size of an optotype of different sizes, visually thinking that a smaller optotype is not smaller than another larger optotype. The visual acuity test method judges whether the visual acuity of the inspected person is real visual acuity by checking the visual acuity difference of the heterogeneous visual acuity chart and the standard logarithmic visual acuity chart respectively. The present invention uses optical illusions of different sizes and perspective diagrams as an eye chart, which interferes with the judgment of object size by causing the illusion of visual depth without affecting the identification of real vision, thereby distinguishing fake vision.

Description

technical field [0001] The invention belongs to the technical field of visual acuity detection, and in particular relates to a heterogeneous visual acuity chart for visual acuity detection and a visual acuity detection method. Background technique [0002] Vision is one of the commonly used indicators of human body function status. In my country, the "GB 11533 Standard Logarithmic Vision Chart" is usually used to test vision. However, in the process of vision testing, the main problems are: [0003] (1) The test results of visual acuity depend on subjective cooperation and narration, which may be untrue. Tested by a conventional eye chart, the standard test distance is 5 meters, and more than half of the smallest visual marks that can be correctly identified are visual acuity. Since the test process is highly dependent on subjective cooperation and the main statement, and the direction and order of the various vision targets in the eye chart are fixed, when the main stateme...

Claims


Application Information

Patent Timeline
Patent Type & Authority Patents(China)
IPC IPC(8): A61B3/032
CPCA61B3/032
Inventor 汪岚苑一祥苑志岷
Owner QINGDAO UNIV
Why Eureka
Try Eureka