

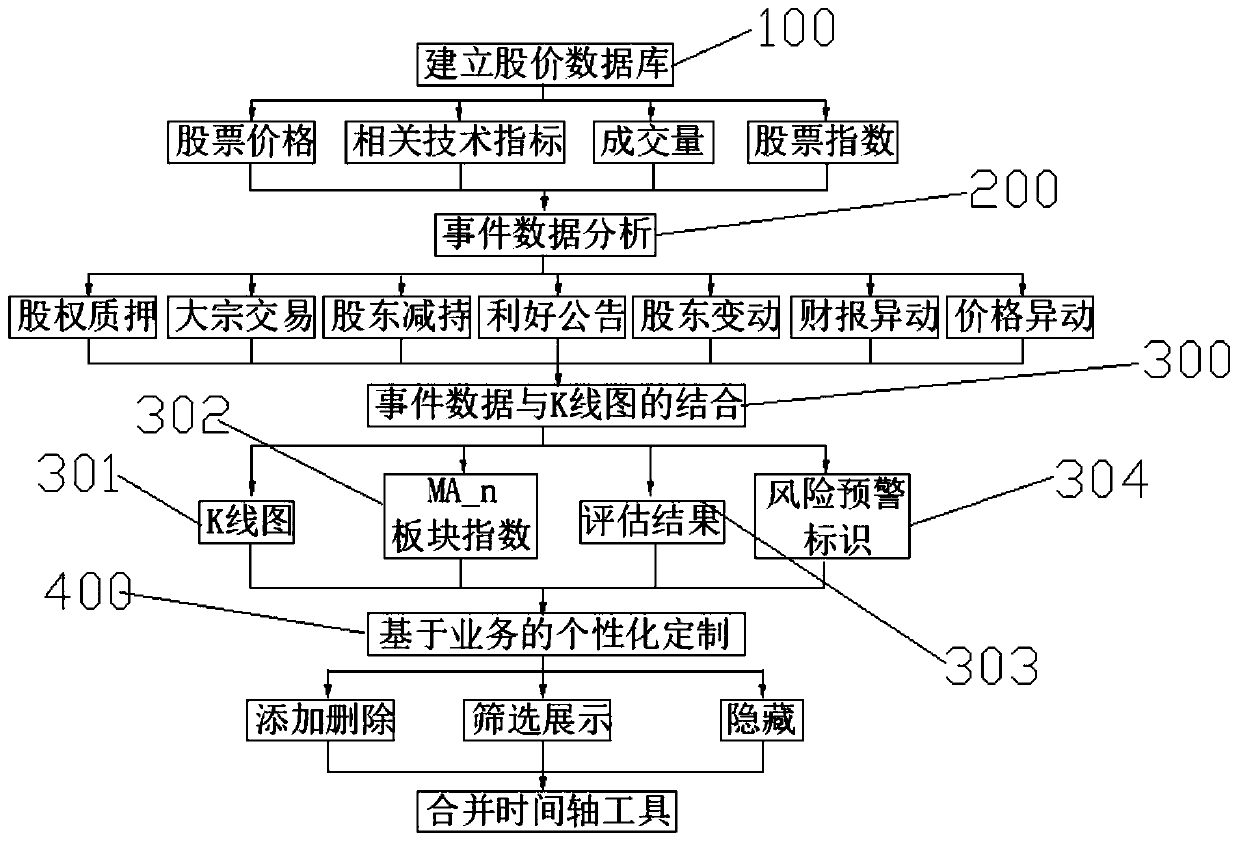
Construction method of time axis tool for security risk analysis, research and judgment
A risk analysis and construction method technology, applied in the field of timeline tool construction, can solve problems such as rising stock prices, not being able to reveal more stock price changes, not being able to reveal news or major events, etc., to achieve an effect that is easy to sort out
- Summary
- Abstract
- Description
- Claims
- Application Information
AI Technical Summary
Problems solved by technology
Method used
Image


Examples
Embodiment Construction
[0041] The present invention will be described in further detail below in conjunction with the accompanying drawings and embodiments, so that those skilled in the art can implement it with reference to the description.
[0042] It should be understood that terms such as "having", "comprising" and "including" used herein do not exclude the presence or addition of one or more other elements or combinations thereof.
[0043] It should be noted that the experimental methods described in the following embodiments, unless otherwise specified, are conventional methods, and the reagents and materials, unless otherwise specified, can be obtained from commercial sources.
[0044]In the description of the present invention, the terms "transverse", "longitudinal", "upper", "lower", "front", "rear", "left", "right", "vertical", "horizontal", " The orientations or positional relationships indicated by "top", "bottom", "inner", "outer", etc. are based on the orientations or positional relati...
PUM
 Abstract
Description
Claims
Application Information