Method for quantitatively evaluating output fluctuation of photovoltaic field stations based on RankBoost

A quantitative evaluation, photovoltaic station technology, applied in the direction of AC network circuits, electrical components, single-network parallel feeding arrangements, etc., can solve problems such as inconvenient operation and planning, not comprehensive and scientific enough, and indicators that are not intuitive and concise.

Active Publication Date: 2020-06-16
CHONGQING UNIV
View PDF9 Cites 5 Cited by
  • Summary
  • Abstract
  • Description
  • Claims
  • Application Information

AI Technical Summary

Problems solved by technology

[0003] However, the shortcomings of the existing quantitative evaluation indicators and comprehensive evaluation methods for photovoltaic power generation are: 1) Some literatures refer to the more mature daily load curve evaluation index system and typical load curves to carry out research
2) At present, there are only a few studies discussing the evaluation indicators of photovoltaic power generation. Some literatures have proposed evaluation indicators for measuring active power fluctuations of wind-solar-energy-storage combined power generation systems, but they are not comprehensive and scientific enough.
Patent CN 109685342A discloses an evaluation method for the comprehensive benefit evaluation index system of photovoltaic power stations, and proposes quantitative indicators from the perspectives of technical benefits, economic benefits, and social benefits. Patent CN 109193748 A proposes grid-connected power generation, failure time, maximum output , the largest proportion of photovoltaic power to load and other indicators; none of the above two involves the fluctuation of photovoltaic power station output
3) The indicators are not intuitive and concise enough, and these indicators cannot be conveniently used directly to guide the grid operation and planning after photovoltaic grid-connected

Method used


Image

  • Method for quantitatively evaluating output fluctuation of photovoltaic field stations based on RankBoost
  • Method for quantitatively evaluating output fluctuation of photovoltaic field stations based on RankBoost
  • Method for quantitatively evaluating output fluctuation of photovoltaic field stations based on RankBoost

Examples


Embodiment 1

[0111] see Figure 1 to Figure 5 , a RankBoost-based quantitative evaluation method for fluctuations in photovoltaic field output, which mainly includes the following steps:

[0112] 1) Obtain the historical output data of the photovoltaic field station, and eliminate invalid data, and establish a valid data set V. The main steps are as follows:

[0113] 1.1) Read the historical output data set of the photovoltaic field station Y={D 1 ,D 2 ,...D 365}; Among them, the output data D in the i-th day i =(P i,1 ,P i,2 ,...,P i,g ...,P i,G ), i=1,2,...,365; P i,g Output at the gth sampling point on the i-th day, g=1,2,...,G;

[0114] 1.2) Parameter initialization, that is, the date i=1, the number of valid days N=0, and the valid data set

[0115] 1.3) Calculate the output starting point g of the photovoltaic station on the i-th day respectively 1,i and output termination point g 2,i ,which is:

[0116] g 1,i =min{g,P i,g ≤0 and P i,g+1 >0} (1)

[0117] g 2,i =ma...

Embodiment 2

[0220] An experiment to verify the quantitative evaluation method of photovoltaic field output fluctuation based on RankBoost mainly includes the following steps:

[0221] 1) Data acquisition: 3-year output data of 6 photovoltaic stations in a certain area in southern China on a 15-minute scale and 3-year sunrise and sunset time data of each station location. Eliminate empty data in photovoltaic output data.

[0222] 2) Calculate the starting time and ending time of each day's output of 6 stations in 3 years, and according to the characteristics of the problem data, identify and eliminate the data that do not meet the requirements at the starting and ending time, and obtain a new data set V.

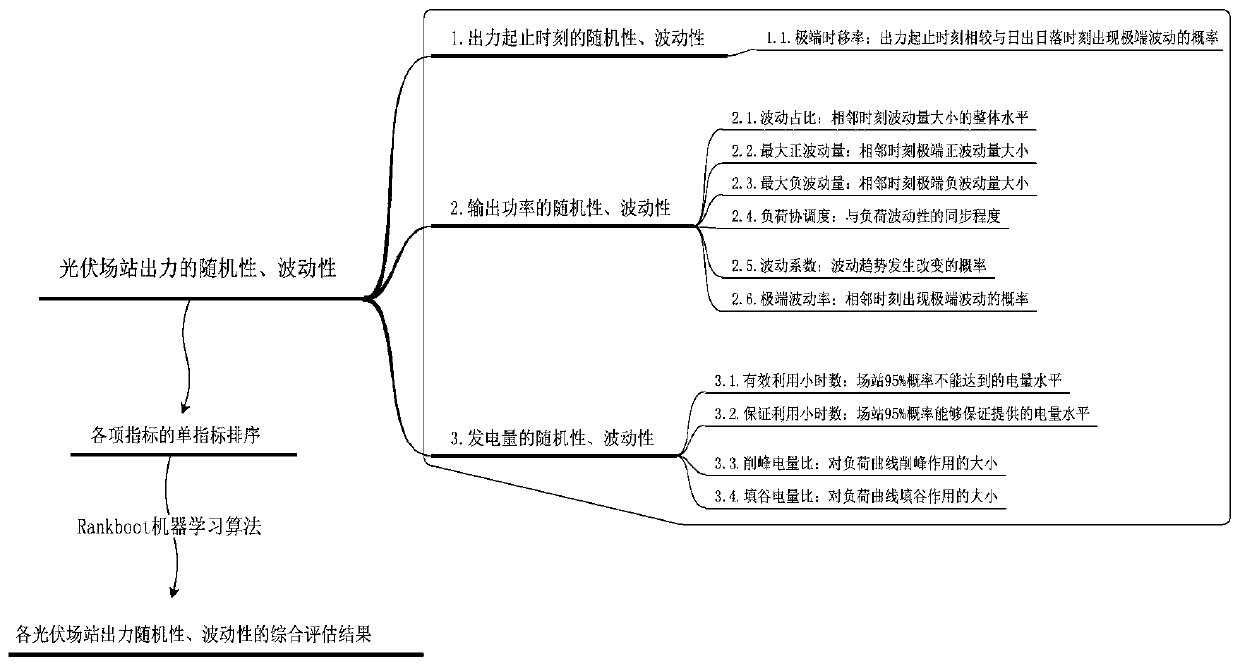
[0223] 3) Based on the data set V and the sunrise and sunset time data of each station location for 3 years, calculate various randomness and volatility indicators.

[0224] 3.1) Substituting the output start time and end time data of the 6 stations calculated in step 2 for 3 years each...


PUM


Abstract

The invention discloses a method for quantitatively evaluating output fluctuation of photovoltaic field stations based on RankBoost, which mainly comprises the steps of: 1) obtaining historical outputdata of the photovoltaic field stations, eliminating invalid data, and establishing a valid data set V; 2) calculating output fluctuation quantitative indexes of each photovoltaic field station, wherein the output fluctuation quantitative indexes comprise an output start-stop moment fluctuation index TDR ([epsilon]1), an output power fluctuation index and a power generation fluctuation index; 3)screening the valid data set V again based on the output fluctuation quantitative indexes of each photovoltaic field station to obtain a valid data set V'; and 4) evaluating the output fluctuation quantitative indexes of the valid data set V' by using a RankBoost algorithm to obtain an output fluctuation performance evaluation result of each photovoltaic field station. According to the method, thecomprehensive, scientific and visual index quantization and evaluation method is created, so that previous qualitative evaluation of the randomness and volatility of the photovoltaic field stations is improved to a quantitative level.

Description

technical field [0001] The invention relates to the field of research on fluctuations in output of photovoltaic stations, in particular to a quantitative evaluation method for fluctuations in output of photovoltaic stations based on RankBoost. Background technique [0002] Renewable energy is considered as a solution to the energy crisis and environmental pollution. In recent years, renewable energy represented by wind power and photovoltaics has been highly valued, and the installed capacity has increased year by year. Regardless of whether photovoltaic power generation is distributed or centralized, the fluctuation of photovoltaic output is a key factor affecting the large-scale consumption of photovoltaic resources. In volatility analysis, the lack of quantitative evaluation indicators and comprehensive evaluation methods has become a key problem. A complete and scientific evaluation index system and comprehensive evaluation method can be used as quantitative reference ...

Claims


Application Information

Patent Timeline
Patent Type & Authority Applications(China)
IPC IPC(8): H02J3/00H02J3/38
CPCH02J3/00
Inventor 任洲洋夏威夷
Owner CHONGQING UNIV
Why Eureka
Try Eureka