Data definition method of visual chart and implementation chart library thereof

A data definition and graph technology, applied in the field of data visualization, can solve the problems of no graphs and the inability to display the change pattern of data in the time dimension, and achieve the effects of facilitating management, reducing the probability of errors during development, and strong data adaptability

Pending Publication Date: 2020-10-30
武汉镝次元数据科技有限公司
View PDF0 Cites 2 Cited by
  • Summary
  • Abstract
  • Description
  • Claims
  • Application Information

AI Technical Summary

Problems solved by technology

[0003] In order to overcome the above-mentioned deficiencies in the prior art, the present invention proposes a data definition method for visual charts, which solves the technical problems that there is no general visual data structure standard and charts cannot show the changing law of data in the time dimension

Method used


Image

  • Data definition method of visual chart and implementation chart library thereof
  • Data definition method of visual chart and implementation chart library thereof
  • Data definition method of visual chart and implementation chart library thereof

Examples


Embodiment Construction

[0041] The following examples are presented to illustrate certain embodiments of the invention and should not be construed as limiting the scope of the invention. The content disclosed in the present invention can be improved simultaneously from materials, methods and reaction conditions, and all these improvements should fall within the spirit and scope of the present invention.

[0042] A data definition method for a visual chart, specifically comprising the following steps:

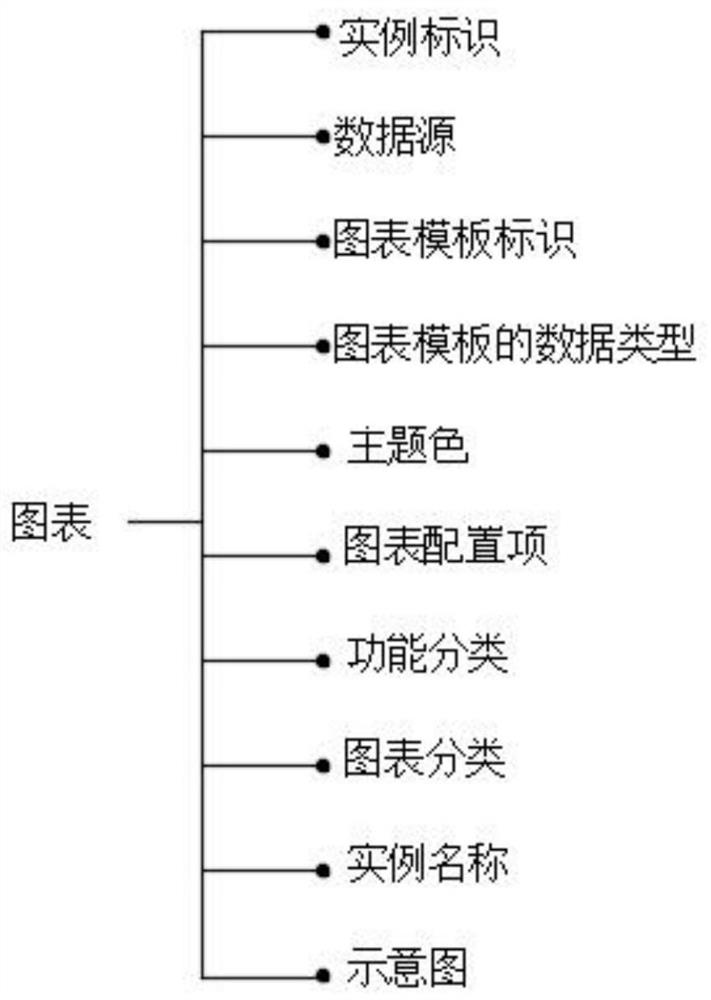
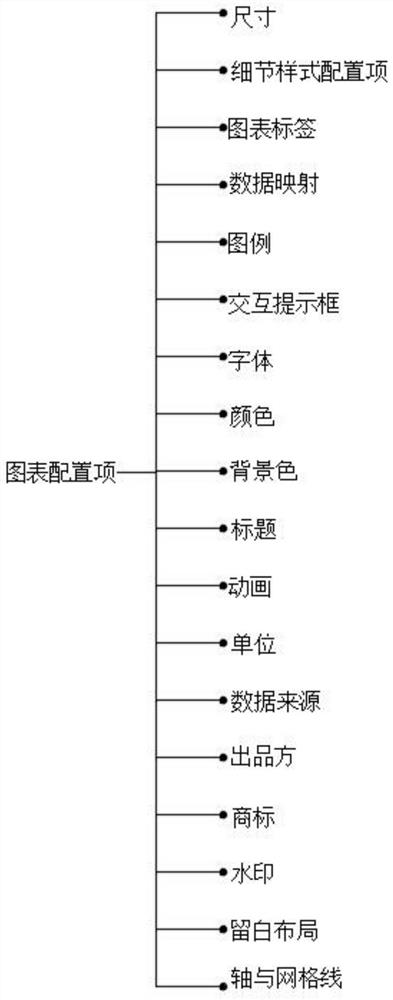
[0043] Put the more stable general information of the visualization instance at the high-level level, such as instance identification class, attribute information, auxiliary information and overall data definition; put the personalized information of the visualization instance and the information that often needs to be modified at the low level, such as specific configuration items of data information, theme styles and chart capabilities;

[0044] In this embodiment, the data information is defined by...


PUM


Abstract

The invention relates to a data definition method of a visual chart and an implementation chart library thereof, and the data definition method specifically comprises the following steps: placing general information of a visual instance at a high-level level, and placing personalized information of the visual instance at a low-level level, wherein the general information comprises an instance identification class, attribute information, auxiliary information and a data overall definition, and the personalized information comprises specific data information, theme styles and chart capability configuration items. According to the data definition method for the visual chart, information such as data, data types, chart styles, charts and instructions behind the chart is defined, and a universal and universal visual data structure standard is formed; based on the data definition, a set of chart component library is achieved, a static chart, an interaction chart and a time axis dynamic chartcan be displayed, the change rule of the data in the time dimension can be displayed, and the pursuit of people for the visual level is better met.

Description

technical field [0001] The invention relates to the technical field of data visualization, in particular to a data definition method for a visualized chart and a chart library for realizing it. Background technique [0002] With the advent of the era of big data, how to "predict" the future through big data and analyze the laws and truth behind the data has received widespread attention. Data visualization is the most commonly used technical means to correctly interpret data, express data, and mine the truth behind the data. However, in the actual field of visualization, there is no universal and universal standard for visual data structure, but there are many forms of chart templates, people's visual needs are rich and diverse, and common static charts are difficult to show data in the time dimension. changes and other issues. Contents of the invention [0003] In order to overcome the above-mentioned deficiencies in the prior art, the present invention proposes a data ...

Claims


Application Information

Patent Timeline
Patent Type & Authority Applications(China)
IPC IPC(8): G06F16/904
CPCG06F16/904
Inventor 王琼王晓燕吴悔徐微
Owner 武汉镝次元数据科技有限公司
Why Eureka
Try Eureka