

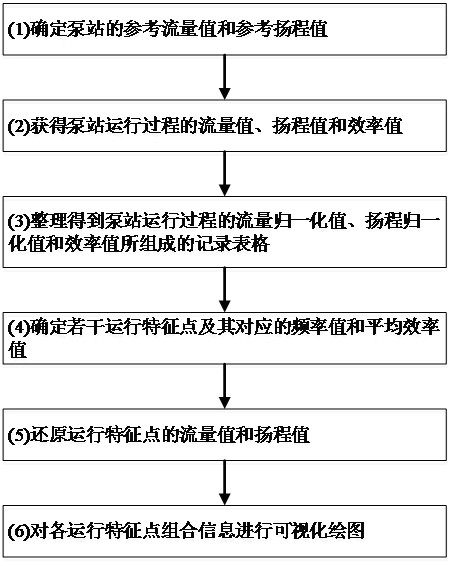
A visualization method of pump station operation information for energy efficiency assessment
A technology of operation information and pumping stations, applied in the field of visualization of pumping station operation information, can solve the problems of missing head information, limited guidance significance of energy efficiency evaluation work, complex operation process of pumping stations, etc., and achieve full expression effect
- Summary
- Abstract
- Description
- Claims
- Application Information
AI Technical Summary
Problems solved by technology
Method used
Image

Examples
Embodiment
[0064] A water supply pump station consists of 8 pumps connected in series and parallel. At the same time, the number of 8 pumps that make up the pumping station may be 1 to 8. During the operation of the pumping station, the valve opening of the water supply terminal and the number of water supply terminals it serves also change from time to time. At intervals of 10 minutes, 10,000 pieces of historical data recording pump station flow values, head values and power values are obtained from the data monitoring and control system of the pump station, and on this basis combined with the density of the fluid medium delivered by the pump station and other necessary information to calculate the efficiency value of the pumping station corresponding to each record.
[0065] Consult the design data of the pumping station, and obtain the reference flow value of the pumping station design as 5000m 3 / h, the reference head value is 100m. Divide all the flow values in the pump stat...
PUM
 Abstract
Description
Claims
Application Information