Geographic space region data multi-scale visualization method based on variable coefficient

A technique of coefficient of variation, area data, applied in the field of information

Active Publication Date: 2021-12-14
HANGZHOU DIANZI UNIV
View PDF3 Cites 0 Cited by
  • Summary
  • Abstract
  • Description
  • Claims
  • Application Information

AI Technical Summary

Problems solved by technology

However, there are still three technical problems in realizing the ideas of domain experts: how to estimate the relationship between local regions and build an attribute-based hierarchy; how to design a collaborative multi-scale visualization model that allows users to simultaneously perceive the whole world on the Voronoi diagram Features and minutiae features; how to evaluate the effectiveness of multiscale visualization results in preserving hierarchical features and relational quality between regions

Method used


Image

  • Geographic space region data multi-scale visualization method based on variable coefficient
  • Geographic space region data multi-scale visualization method based on variable coefficient
  • Geographic space region data multi-scale visualization method based on variable coefficient

Examples


Embodiment Construction

[0035] The present invention will be described in detail below in conjunction with the accompanying drawings and specific embodiments.

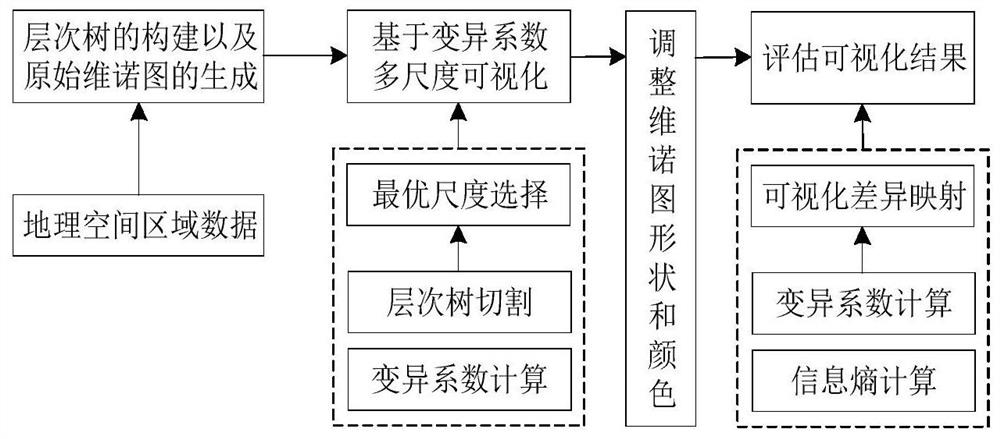
[0036] Such as figure 1 As shown, the multi-scale visualization method of geospatial regional data based on the coefficient of variation, the specific steps are:

[0037] Step (1) Delaunay triangulation and hierarchical clustering are performed on the original geospatial area data to generate Voronoi diagrams and hierarchical clustering trees, which are used to guide the optimal scale selection in the next step. In most cases, the hierarchical relationship of geographic space is determined by the division of administrative regions. However, due to the actual geographical relationship, the hierarchical relationship of administrative regions cannot effectively express and reflect the hierarchical relationship of actual data. According to the attribute information reflected by different regional nodes, the present invention adopts a hierarchic...


PUM


Abstract

The invention discloses a geographic space region data multi-scale visualization method based on variable coefficients. The method comprises the following steps of: firstly, performing hierarchical clustering on geographic space region data by utilizing spatial similarity to form a hierarchical structure; and estimating attribute distribution of each cluster in the hierarchical structure by using variable coefficients, and carrying out optimal scale division according to the value of the variable coefficients so as to simultaneously present multi-scale visualization of the cluster with a lower variable coefficient. Besides, evaluation and quantitative comparison of multi-scale visualization results are carried out from two aspects of variable coefficients and information entropies, and the visual performance of visualization differences is enhanced from the aspect of shapes by using a radar map, so that the multi-scale visualization method is visually evaluated and compared. According to the method disclosed by the invention, a multi-scale visualization model for geographic space region data is realized, so that a user can visually explore global features and detail features of the original geographic data at the same time and deeply know potential features in the geographic space region data.

Description

technical field [0001] The invention belongs to the field of information technology, and relates to a method for multi-scale visualization of geospatial area data based on coefficient of variation. Background technique [0002] With the rapid development of geospatial information technology, geospatial area data is widely collected in terms of characteristics such as location and attribute information statistics such as population and income. Geospatial area datasets are often visualized on thematic maps and Voronoi diagrams, polygonal boundaries are used to represent geographic features, and visual elements (color, size, etc.) are used to map attributes of the data. For example, Polczynski et al. used k-means to classify geographic data with multiple feature attributes on thematic maps for visualization of geospatial area data. Pinho et al. introduced Voromap, an exploration tool based on Voronoi diagrams of projected data, which uses the area of ​​the polygons in the Voro...

Claims


Application Information

Patent Timeline
IPC IPC(8): G06F16/26G06F16/29G06T11/20G06T11/00G06K9/62
CPCG06F16/26G06F16/29G06T11/206G06T11/001G06F18/231G06F18/23213
Inventor 周志光倪瑜那王浩轩陈圆圆张翔刘玉华苏为华
Owner HANGZHOU DIANZI UNIV
Why Eureka
Try Eureka