Mass data drawing optimization method based on maximum triangle three-segment algorithm

A technology of mass data and optimization methods, applied in the field of data visualization, can solve the problems of no fixed value, unfavorable data analysis and visualization effect display, and imprecise threshold selection, etc., to achieve the effect of reducing data points and high-performance visual drawing

Pending Publication Date: 2022-03-25
HANGZHOU DIANZI UNIV
View PDF0 Cites 1 Cited by
  • Summary
  • Abstract
  • Description
  • Claims
  • Application Information

AI Technical Summary

Problems solved by technology

[0003] There are some problems in the use of these massive data: First, the characteristics are not obvious
The magnitude of the data is large, the fluctuations are frequent, and the data points are overlapped after being connected by broken lines. Whether it is used for subsequent data mining or directly drawn, it is difficult to obtain significant trend characteristics, which is not conducive to data analysis and visualization.
Second, too ma

Method used


Image

  • Mass data drawing optimization method based on maximum triangle three-segment algorithm
  • Mass data drawing optimization method based on maximum triangle three-segment algorithm
  • Mass data drawing optimization method based on maximum triangle three-segment algorithm

Examples


Embodiment Construction

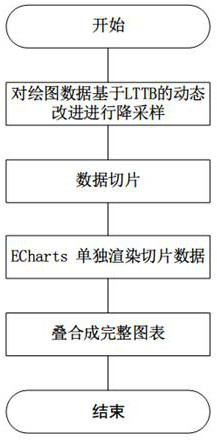
[0027] In order to make the technical solution of the present invention clearer, it will be described in detail in conjunction with the accompanying drawings. The present invention is as follows: figure 1 As shown, the specific steps are as follows:

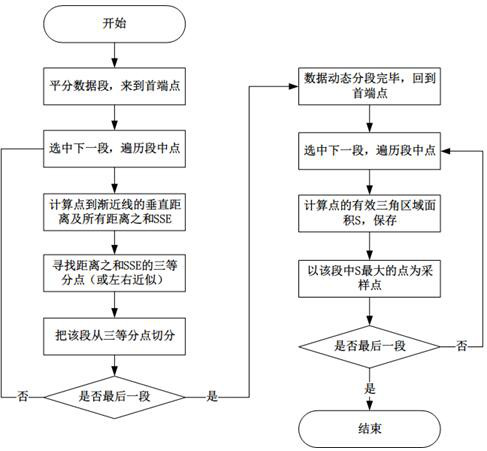
[0028] Step S1. Obtain the collected data, and perform down-sampling based on the Large Triangle Three Buckets (LTTB) algorithm and its dynamic improvement algorithm. The steps of the LTTB algorithm are as follows:

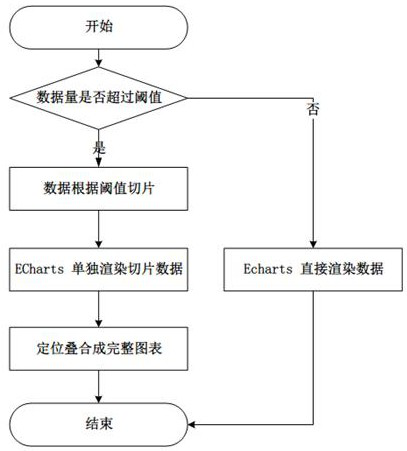
[0029] S1-1. Determine the segment size threshold: In order to facilitate changing the segment size, pass the segment size as a parameter (threshold) to the algorithm, so if you need to sample 100 times, you only need to pass the parameter threshold=(total data size / multiple ). The total data points are equally divided into all the segments, which are divided into the threshold segment. In addition, in order to ensure that the first and last points can be selected after the data is divided, the first and last poin...


PUM


Abstract

The invention discloses a mass data drawing optimization method based on a maximum triangle three-segment algorithm. The method comprises the steps of firstly performing downsampling on data based on a maximum triangle three-segment algorithm, trying to compress original data and keeping detail features as much as possible; and for locally steep segmented data, the improvement of dynamically adjusting the segments is carried out. Then, the data with the magnitude exceeding a threshold value is sliced, and for each piece of sliced data, the ECharts can independently create an instance for drawing, so that a chart of sub-sliced data is obtained; and finally, positioning the obtained sub-charts to the same position by using a cascading style sheet language, and superposing the sub-charts to form a unique complete graph. By the adoption of the method, data points used for drawing can be greatly reduced on the premise that original data details are not lost as far as possible, and therefore visual drawing can be conducted on industrial mass data efficiently and with high performance.

Description

technical field [0001] The invention belongs to the technical field of data visualization, and in particular relates to a massive data drawing optimization method based on the largest triangle three-segment algorithm. Background technique [0002] In recent years, industrial remote operation and maintenance and online monitoring systems have been widely used, and in industrial monitoring scenarios, the visualization of time series data is an unavoidable topic. Because many monitoring systems need to frequently collect and report the data of field devices, and display them in real-time visual charts. These data are often updated frequently, and the amount of data updated each time is relatively large, which will result in a time-series data set with a large amount of data. [0003] There are some problems in the use of these massive data: First, the characteristics are not obvious. The magnitude of the data is large, the fluctuations are frequent, and the data points are ov...

Claims


Application Information

Patent Timeline
IPC IPC(8): G06T11/20
CPCG06T11/206
Inventor 陈科明蔡坤黄盼盼邢豪蔚
Owner HANGZHOU DIANZI UNIV
Why Eureka
Try Eureka