
Method, system and device for realizing 3D pie chart and readable storage medium

A 3D and pie chart technology, applied in the field of data visualization front-end display, can solve problems such as large project size and incompatible chart styles, and achieve the effects of simplifying usage, enriching usage scenarios, and improving readability

Pending Publication Date: 2022-07-01
XIAN THERMAL POWER RES INST CO LTD +1
View PDF0 Cites 0 Cited by
  • Summary
  • Abstract
  • Description
  • Claims
  • Application Information

AI Technical Summary

Problems solved by technology

In general, the solution is to introduce other basic tool libraries with 3D pie charts, which will not only cause the project size to be too large, but also cause chart styles to be incompatible

Method used


Image

  • Method, system and device for realizing 3D pie chart and readable storage medium
  • Method, system and device for realizing 3D pie chart and readable storage medium
  • Method, system and device for realizing 3D pie chart and readable storage medium

Examples


Embodiment Construction

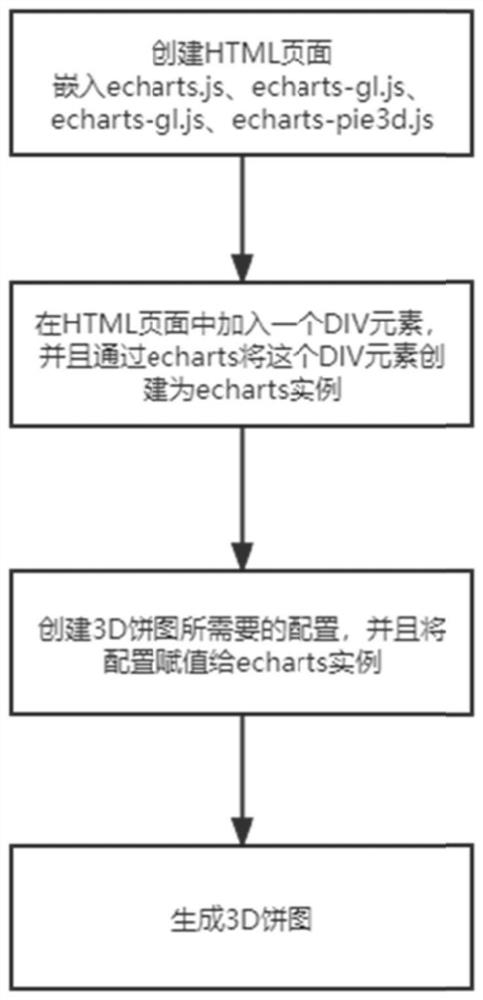
[0096] In order to make those skilled in the art better understand the solutions of the present invention, the technical solutions in the embodiments of the present invention will be clearly and completely described below with reference to the accompanying drawings in the embodiments of the present invention. Obviously, the described embodiments are only Embodiments are part of the present invention, but not all embodiments. Based on the embodiments of the present invention, all other embodiments obtained by persons of ordinary skill in the art without creative efforts shall fall within the protection scope of the present invention.

[0097] It should be noted that the terms "first", "second" and the like in the description and claims of the present invention and the above drawings are used to distinguish similar objects, and are not necessarily used to describe a specific sequence or sequence. It is to be understood that the data so used may be interchanged under appropriate ...


PUM


Abstract

The invention discloses a method, a system, equipment and a medium for realizing a 3D pie chart. The method comprises the following steps of: creating an HTML (Hypertext Markup Language) page, and embedding javascript scripts echarts.js, echarts-gl.js and echarts-pie3d.js into the HTML page through a script label; the method comprises the following steps of: adding a DIV element into an HTML (Hypertext Markup Language) page, and creating the DIV element as an echarts instance through echarts; configuration items required by the 3D pie chart are created, the configuration items are assigned to echarts examples, and echarts-pie3d. Js generates the corresponding 3D pie chart on an HTML (hypertext markup language) interface. According to the method, the 3D pie chart lacking echarts is supplemented, and the data display mode of the echarts is enriched.

Description

technical field [0001] The invention belongs to the technical field of front-end display of data visualization, and in particular relates to a method, a system, a device and a readable storage medium for realizing a 3D pie chart based on echarts. Background technique [0002] In the era of big data, with the advancement of informatization and the growth of geometric progression of data, traditional data reports and tables have been unable to intuitively display the laws of data, and a large amount of data can only be understood through data visualization. echarts is a basic tool library for data visualization, which provides a variety of chart display methods. Based on echarts, a gorgeous data visualization scene interface can be developed. [0003] Although echarts has built-in a variety of chart display methods, after multiple iterations, echarts has not provided 3D pie charts. According to the official statement, 3D pie charts cannot be accurately compared due to visual ...

Claims


Application Information

Patent Timeline
IPC IPC(8): G06F8/34G06F8/38G06F16/958
CPCG06F8/34G06F8/38G06F16/986
Inventor 刘鹏飞王毅赵亮
Owner XIAN THERMAL POWER RES INST CO LTD
Features
  • Generate Ideas
  • Intellectual Property
  • Life Sciences
  • Materials
  • Tech Scout
  • Unparalleled Data Quality
  • Higher Quality Content
  • 60% Fewer Hallucinations
Learn More