
Data visualization method and device, equipment and storage medium

A data and data output technology, applied in the fields of equipment and storage media, data visualization methods, and devices, can solve the problems of low data analysis and development efficiency, and data cannot be visualized in time, so as to improve the timeliness of visualization, avoid interference, and improve accuracy. sexual effect

Pending Publication Date: 2022-07-12
PINGAN INT SMART CITY TECH CO LTD
View PDF0 Cites 0 Cited by
  • Summary
  • Abstract
  • Description
  • Claims
  • Application Information

AI Technical Summary

Problems solved by technology

However, in the current data visualization method, front-end development and back-end development often need to be jointly debugged through the interface. However, this method leads to low efficiency of data analysis and development, resulting in data that cannot be visualized in time

Method used


Image

  • Data visualization method and device, equipment and storage medium
  • Data visualization method and device, equipment and storage medium
  • Data visualization method and device, equipment and storage medium

Examples


Embodiment Construction

[0057] In order to make the objectives, technical solutions and advantages of the present invention clearer, the present invention will be described in detail below with reference to the accompanying drawings and specific embodiments.

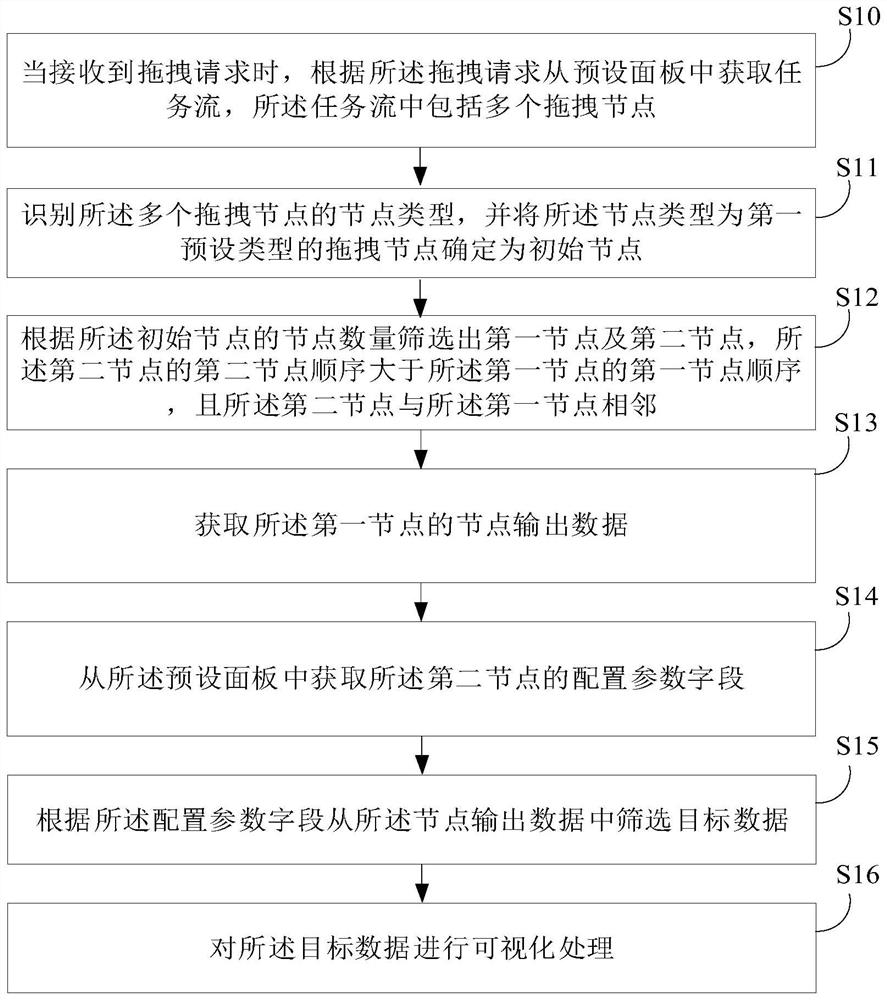
[0058] like figure 1 Shown is a flow chart of a preferred embodiment of the data visualization method of the present invention. According to different requirements, the order of the steps in this flowchart can be changed, and some steps can be omitted.

[0059] The data visualization method can acquire and process related data based on artificial intelligence technology. Among them, artificial intelligence (AI) is a theory, method, technology and application system that uses digital computers or machines controlled by digital computers to simulate, extend and expand human intelligence, perceive the environment, acquire knowledge and use knowledge to obtain the best results. .

[0060] The basic technologies of artificial intelligence general...


PUM


Abstract

The invention relates to data display, and provides a data visualization method and device, equipment and a storage medium. The method comprises the following steps: acquiring a task flow from a preset panel, wherein the task flow comprises a plurality of drag nodes; identifying the node types of the plurality of drag nodes, and determining the drag node of which the node type is a first preset type as an initial node; first nodes and second nodes are screened out according to the number of the initial nodes, the second node sequence of the second nodes is larger than the first node sequence of the first nodes, and the second nodes are adjacent to the first nodes; acquiring node output data of the first node; acquiring a configuration parameter field of the second node from the preset panel; screening target data from the node output data according to the configuration parameter field; and performing visualization processing on the target data, thereby improving the visualization efficiency. In addition, the invention also relates to a block chain technology, and the target data can be stored in a block chain.

Description

technical field [0001] The present invention relates to the technical field of data display, and in particular, to a data visualization method, apparatus, device and storage medium. Background technique [0002] Data visualization refers to the process of using data analysis and development tools to obtain data and display the obtained data in a graphical form. However, in the current data visualization method, front-end development and back-end development are often required to be jointly debugged through interfaces. However, this method leads to low data analysis and development efficiency, resulting in data not being visualized in time. SUMMARY OF THE INVENTION [0003] In view of the above content, it is necessary to provide a data visualization method, device, device and storage medium, which can visualize the target data in time. [0004] In one aspect, the present invention provides a data visualization method, and the data visualization method includes: [0005] ...

Claims


Application Information

Patent Timeline
Patent Type & Authority Applications(China)
IPC IPC(8): G06F3/0486G06F16/26G06F9/445G06F9/451
CPCG06F3/0486G06F16/26G06F9/44505G06F9/451Y02D10/00
Inventor 周异成
Owner PINGAN INT SMART CITY TECH CO LTD
Learn More