

Methods of treating a subject with a high gleason score prostate cancer
a prostate cancer and high gleason score technology, applied in the field of biomarker analysis, to achieve the effect of high risk
- Summary
- Abstract
- Description
- Claims
- Application Information
AI Technical Summary
Problems solved by technology
Method used
Image

Examples
example 1
and Methods
[0166]Primer / Probe Sequences: The kits and methods for detecting urine biomarker cohorts use the following primer / probe sequences. The following abbreviations are used in Table 1 below: probes from Integrated DNA Technologies are designated as “IDT,” 5′-FAM refers to a 5′ reporter dye, “31ABkFQ” refers to a 3′-IowaBlack quencher and “ZEN” refers to an in-sequence-ZEN™ quencher from IDT.
[0167]
TABLE 1Primer / Probe SequencesTargetDesignationSequence / ModificationsSPDEF0881_SPDEF_e3-4_fF_CCACCTGGACATCTGGAAG (SEQ ID NO: 10)IDTSPDEF0884_SPDEF_e3-4_r1_IDTAATCGCCCCAGGTGAAGT (SEQ ID NO: 11)SPDEF0883_SPDEF_E3-4_P_ZEN / 56-FAM / CGG CCT GGA / ZEN / TGA AAG AGCG / 3IABkFQ / (SEQ ID NO: 12)ERG0498_ERG_ex11-12_IDT_fGCGTCCTCAGTTAGATCCTTATCAG (SEQ ID(ERG LDT F1)NO: 13)ERG0499_ERG_ex12-CTGGCCACTGCCTGGATT (SEQ ID NO: 14)13_IDT_R (ERG LDT R1)ERG0500_ERG_ex12_IDT_FAM_ / 56-FAM / CTT GGA CCA / ZEN / ACA AGT AGCZEN_probeCGC CTT GC / 3IABkFQ / (SEQ ID NO: 15)PCA30539_PCA3_ex3-GCA CAT TTC CAG CCC CTT TA (SEQ ID4_malig...
example 2
ohort 7 Sample Preparation
[0168]A cohort of patient samples was used to identify biomarkers useful for detecting prostate cancer from nucleic acids extracted from the urine-derived microvesicles. A patient cohort of 258 subjects, referred to as “cohort 7” in this example, were enrolled in this study. Of the 258 subjects, 196 had their first biopsy, and 59 had repeat biopsies. Of the primary biopsy patients, 87 had positive biopsy results, and 109 had negative biopsy results. Of the repeat biopsy patients, 15 had positive biopsy results, and 44 had negative biopsy results.
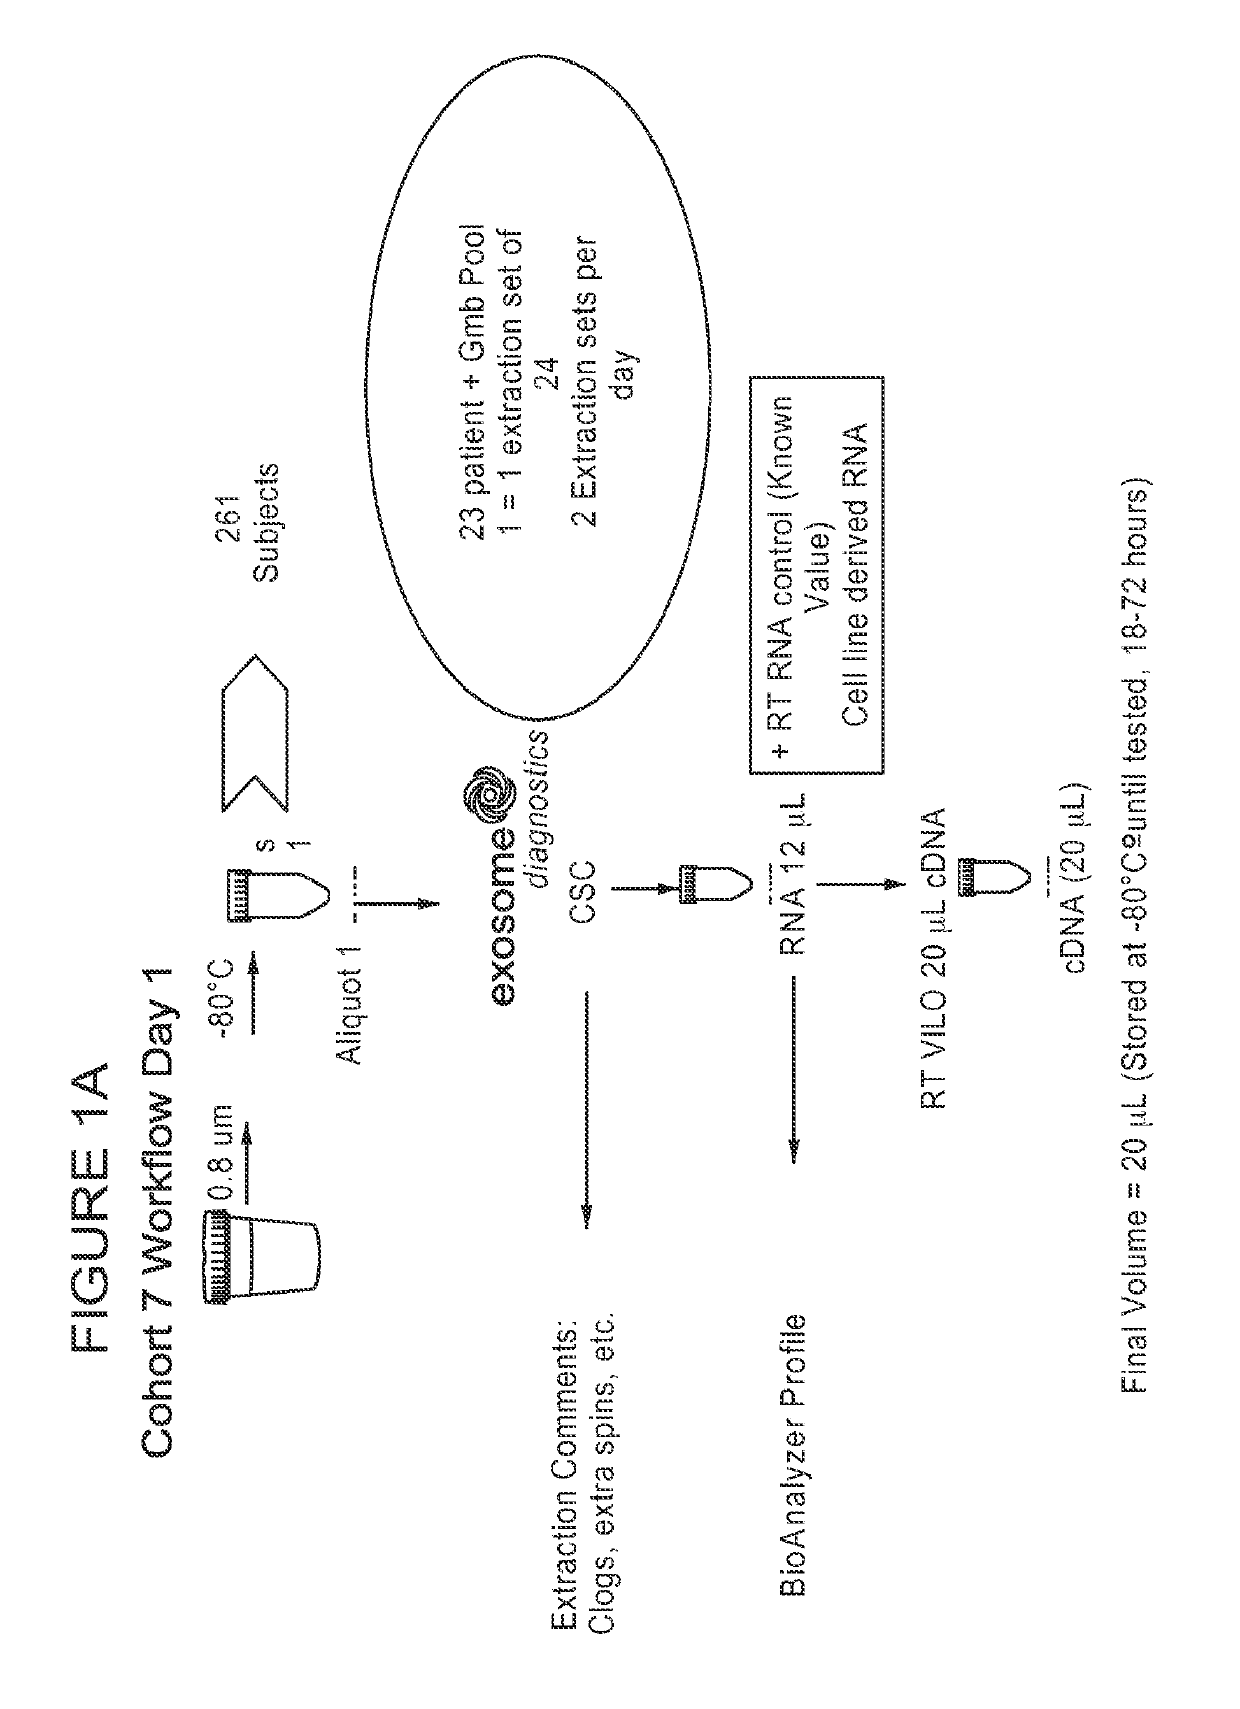
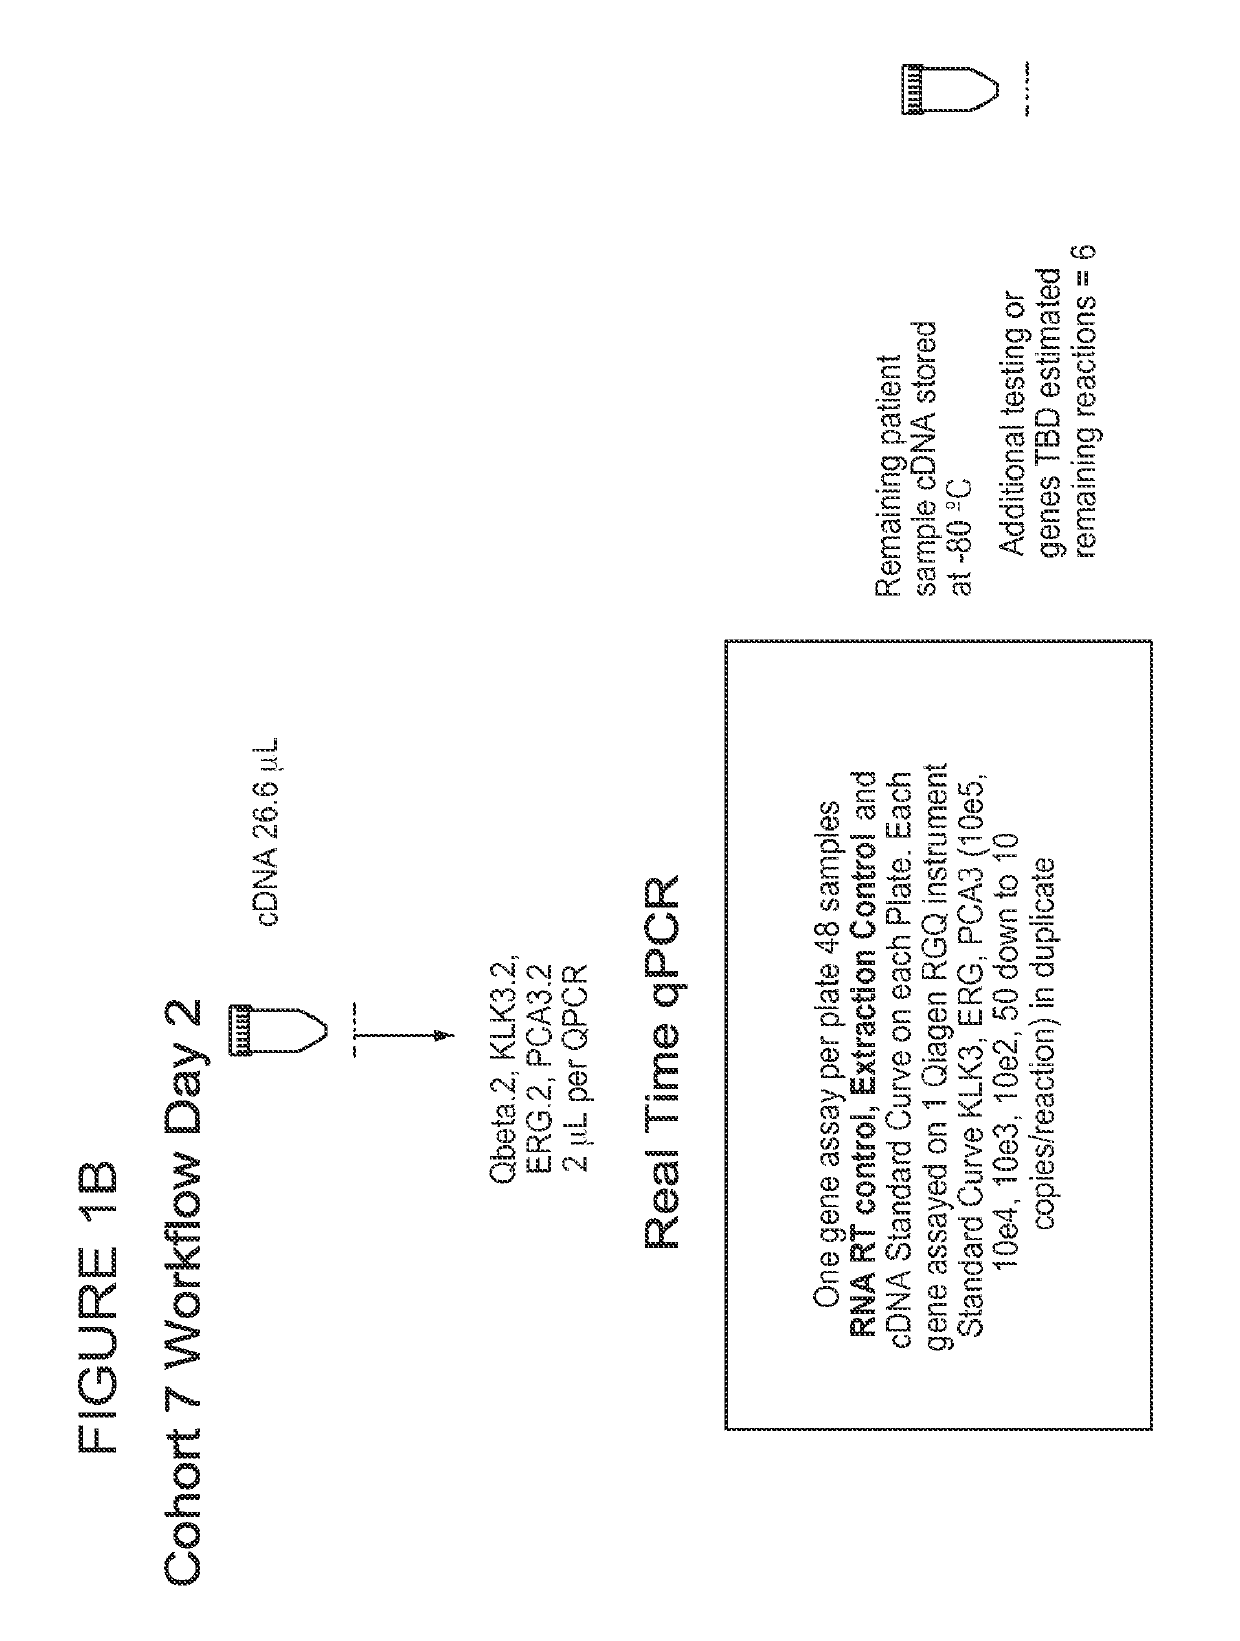
[0169]Urine sample volumes ranged from 20-100 mL. The distribution of the initial volume of urine samples from the patients were as follows: sample volume (V) is equal to 20 mL (i.e., V=20 mL), 21% of the patients (n=55); sample volumes is greater than 20 mL but less than or equal to 40 mL (i.e., 20 mL40 mL), 52% of the patients (n=133).
[0170]Urine samples from cohort 7 were analyzed as depicted in FIGS. 1A and 1B. ...
example 3
ERG Gene Expression Analysis
[0174]Multiple analyses were performed using the gene expression results from of qPCR experiment. ROC curves were generated based on the delta Ct or copy number relative to the normalizer gene KLK3. Imputation may be used to obtain missing values. ROC analysis of PCA3, using KLK3 as the normalizer gene, generated an AUC value of 0.727 (FIG. 3). ROC curve analysis of PCA3 and ERG produced an increased AUC value of 0.756 (FIG. 4). In other experiments, the normalizer gene utilized was SPDEF (FIG. 13) and AUC values generated from analysis using SPDEF normalization showed that KLK3 and SPDEF performed equivalently.
[0175]Model, or output, values for PCA3 and ERG gene expression were also calculated for each sample using the following formula, which was determined from data analysis of a different patient cohort (Cohort 5):
Model Value=(ΔCtERG×0.233)+(ΔCtPCA3×0.446)[0176]where ΔCtERG=CtERG−CtKLK3; ΔCtPCA3=CtPCA3−CtKLK3
A model cutoff value was chosen, for examp...
PUM
| Property | Measurement | Unit |
|---|---|---|
| volumes | aaaaa | aaaaa |
| volume | aaaaa | aaaaa |
| volume | aaaaa | aaaaa |
Abstract
Description
Claims
Application Information