Methods of cancer detection

a cancer and detection method technology, applied in the field of cancer detection, to achieve the effect of high-resolution characterization of the morphology of the tissu

Active Publication Date: 2019-11-05
UNIVERSITY OF MAINE
View PDF9 Cites 1 Cited by
  • Summary
  • Abstract
  • Description
  • Claims
  • Application Information

AI Technical Summary

Benefits of technology

[0004]The present invention provides, among other things, methods of identifying cancerous or pre-cancerous tissue including providing a first region of tissue from a subject, calculating a roughness exponent (e.g., a Hurst exponent) for the first region of tissue, and comparing the roughness exponent of the first region of tissue to 0.5, wherein a difference of less than 0.2 between the roughness exponent of the first region of tissue and 0.5 indicates that the tissue is cancerous or pre-cancerous. In some embodiments, the providing, calculating, and comparing steps are each performed a plurality of times. In some embodiments, the plurality of times is at least 10, at least 100, or at least 1,000. In some embodiments, performing the providing, calculating and comparing steps a plurality of times allows for a higher resolution characterization of the morphology of the tissue surrounding a region of tissue suspected to be cancerous or pre-cancerous.

Problems solved by technology

However, not all of these mutations result in cancer.

Method used


Image

  • Methods of cancer detection
  • Methods of cancer detection
  • Methods of cancer detection

Examples


example 1

Characterization of Breast Tumor Organization

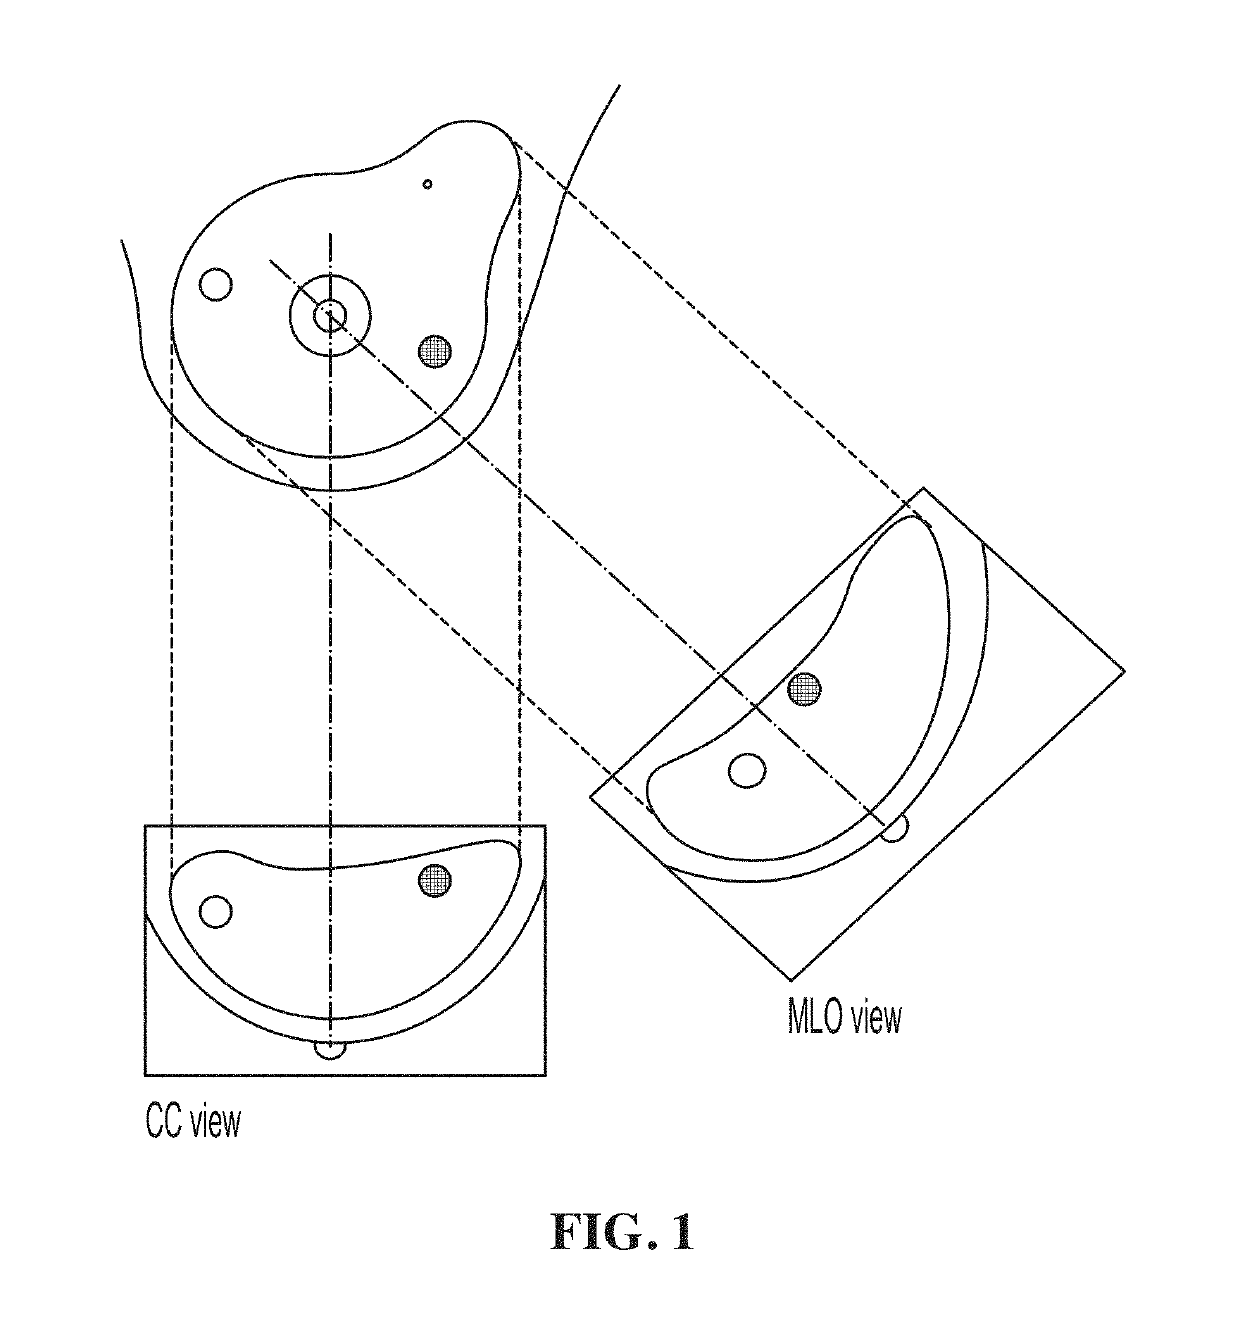
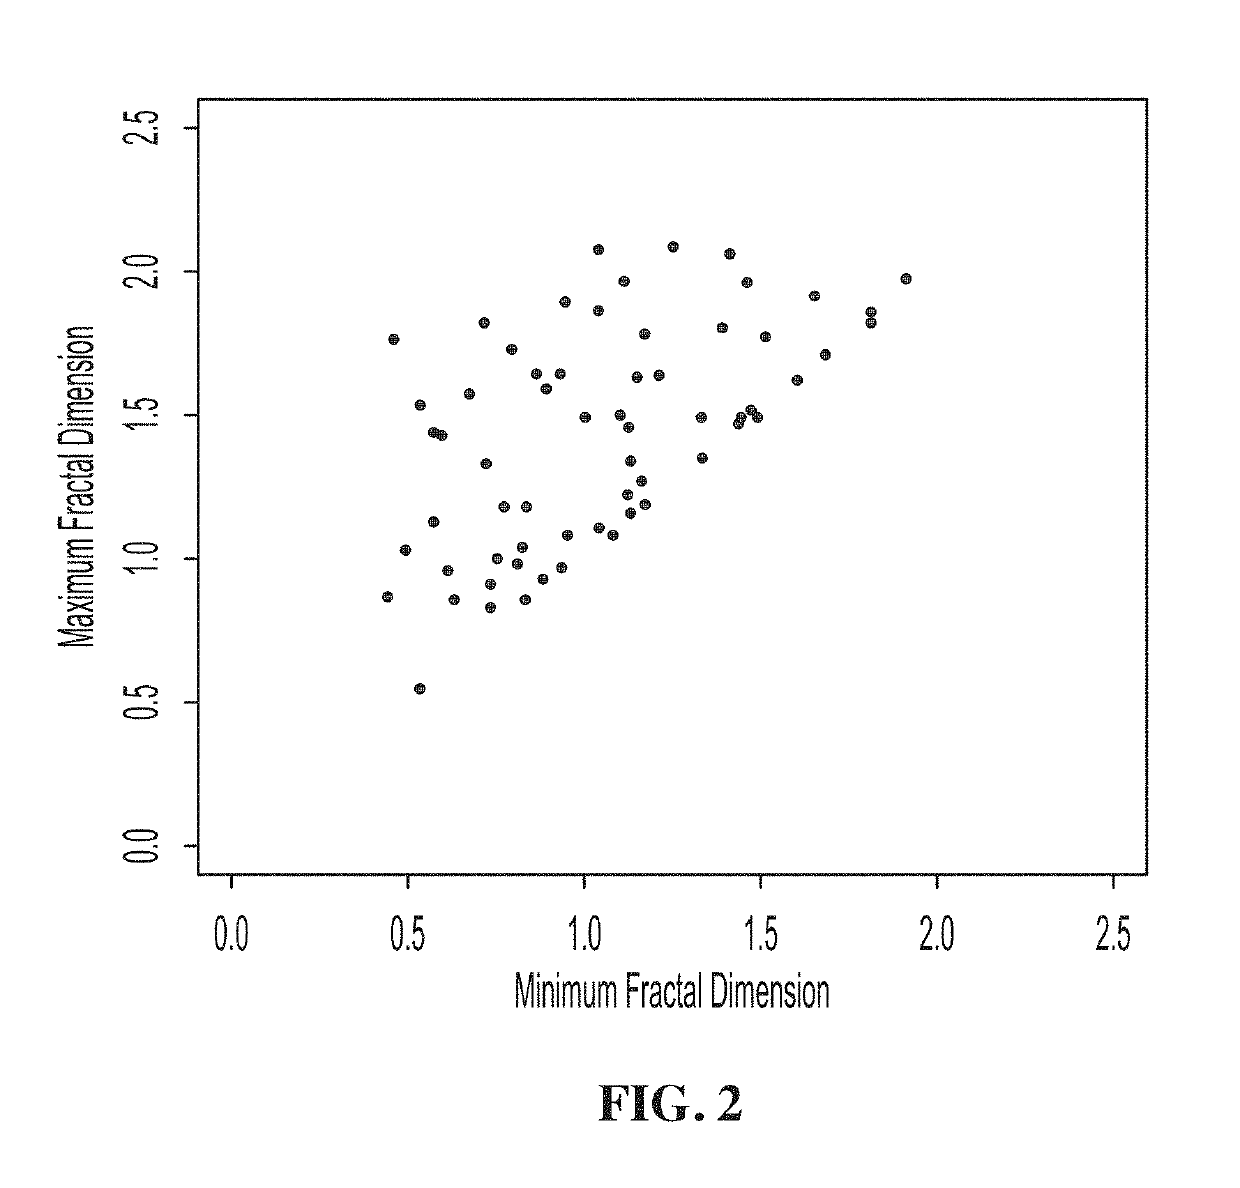
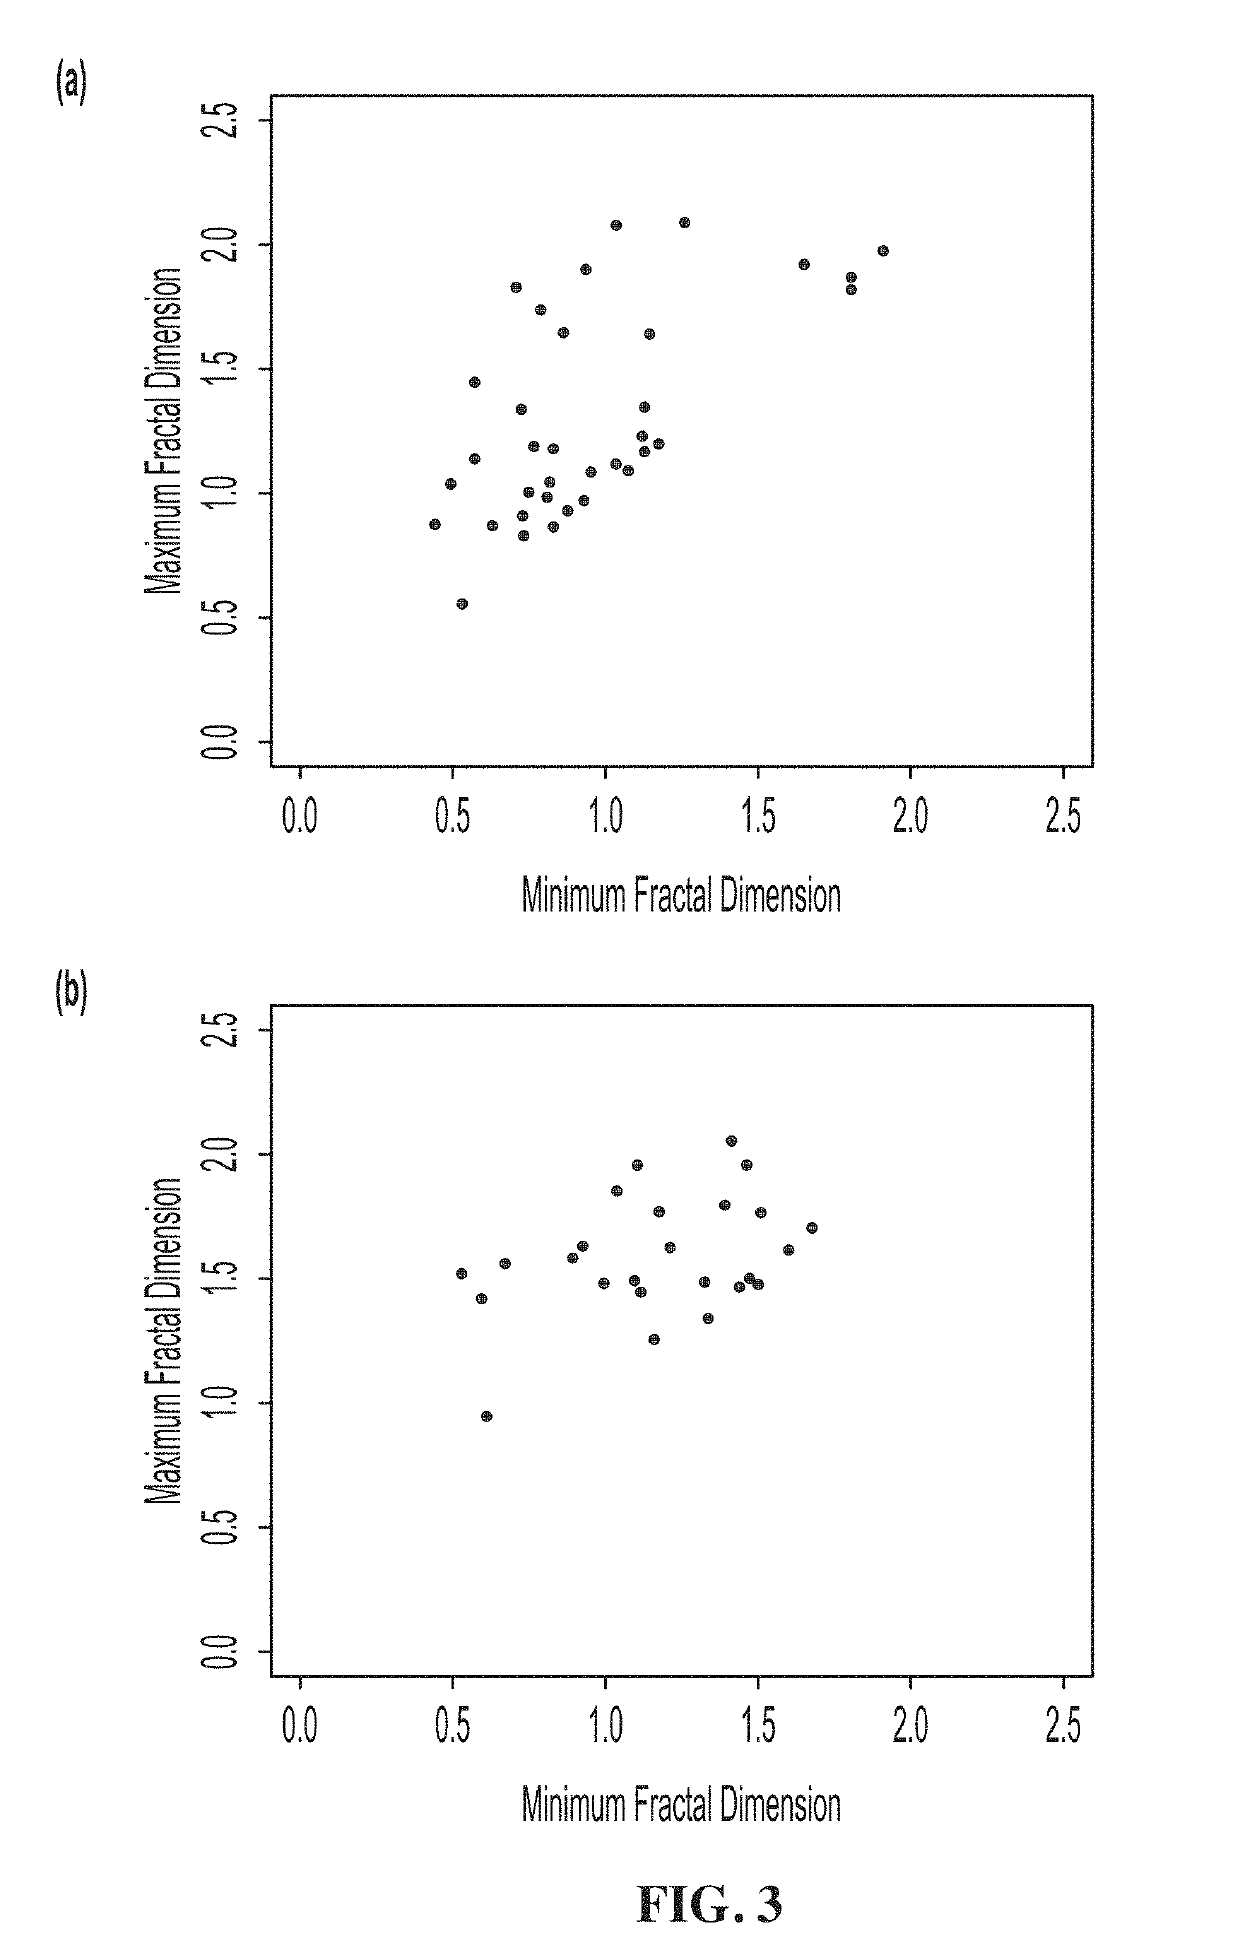
[0173]This Example shows that the 2D WTMM method has the ability to characterize breast tumors and their microenvironment. Data was obtained from the Digital Database for Screening Mammography (DDSM), described above. Cases having a suspicious region, i.e. containing a benign or malignant tumor, were considered. From these cases, only cases having one set of microcalcifications were kept for further investigation and masses were disregarded for this analysis. Using the methods described above, we were able to fully characterize the lesion by the fractal dimension of the breast tumor and the roughness of the microenvironment given by the Hurst exponent.

[0174]In this Example, a total of 128 images, 78 of which are benign and 50 of which are malignant, were analyzed. Since each mammographic case contains two images, one corresponding to the mediolateral oblique (MLO) view, and the other to the cranio-caudal (CC) view with their projections s...

example 2

Classification of Tumor Prone Tissue

[0177]This example illustrates how provided methods may be used to better understand the mechanisms that drive the differing organization of benign and malignant tumors, and specifically the microenvironment of a radiologist-identified suspicious region.

[0178]To gain a deeper understanding of the behavior and development of breast lesions, neighboring tissue was classified according to the two dimensional WTMM methods described above to survey the microenvironment of the tumors (also see Kestener et al., Wavelet-based multifractal formalism to assist in diagnosis in digitized mammograms, 2001, Image Anal Stereol, 20: 169-174 for an application of this methodology). Briefly, the 2D WTMM method was used to analyze mammary parenchyma. This analysis was used to generate a Hurst exponent (H) as a measure of the roughness of a sample. The Hurst score was used to classify breast tissue as fatty (H=0.25±0.05), dense (H=0.65±0.05).

[0179]To categorize the n...

example 3

Alternative Analysis of Prone Tissue

[0194]As indicated above in Example 2, obtaining one average ΔH value per subject by averaging the calculated |H −0.5| values of neighboring tissue for both the MLO and CC views provided valuable insight that the loss of microenvironmental structure is indicative of the development of tumors, with a higher level of disorder being found in more serious (malignant) tumors.

[0195]In this example, rather than calculating a single average ΔH value per subject (consisting of up to 16 neighbors per image, 8 in each of the MLO and CC views), the distribution of ΔH=|H −0.5| for each of the neighboring regions was taken individually. This methodology provides a significantly larger sample size than the analysis in Example 2 because the sample size becomes the number of subjects x the number of neighboring images around each lesion, for a total of (up to) 16 ΔH=|H −0.5| values per subject. When the data in Example 2 is analyzed using this method, the p-value ...


PUM


Abstract

The present invention provides, among other things, methods of identifying cancerous or pre-cancerous tissue including providing a first region of tissue from a subject, calculating a roughness exponent for the first region of tissue, and comparing the roughness exponent of the first region of tissue to 0.5, wherein a difference of less than 0.2 between the roughness exponent of the first region of tissue and 0.5 indicates that the tissue is cancerous or pre-cancerous. Additionally, the present invention provides methods including providing a first view of a region of tissue, providing a second view of a region of tissue, calculating a first fractal dimension for the first view of the region of tissue, and calculating a second fractal dimension for the second view of the region of tissue, wherein if the fractal dimension of at least one of the first fractal dimension and the second fractal dimension is in the fractal zone, the region of tissue is considered cancerous. Also provided are systems for performing these assessments.

Description

BACKGROUND[0001]The human body is composed of about ten trillion cells, and throughout a lifetime cells go through many damaging processes that concern their genetic programming. However, not all of these mutations result in cancer. As it turns out, many individuals actually have occult tumors throughout their bodies that are only discovered through microscopic investigation during autopsy. Therefore, there must be some mechanism that prohibits the growth and development of tumors.[0002]Recent research has pointed to the microenvironment of potential tumors to help suppress malignant phenotype and instruct otherwise malignant cells to participate in normal development. The microenvironment may actually provide tumor suppressive signals as long as the tissue architecture is controlled, but as the structure of healthy tissue is lost, the tissue has the potential to become a tumor promoter. Thus, considering the tissue surrounding the tumor, along with the lesion, may be important in i...

Claims


Application Information

Patent Timeline
Patent Type & Authority Patents(United States)
IPC IPC(8): G06T7/00A61B5/00A61B6/00G06T7/48A61B5/08A61B5/20
CPCA61B6/502A61B5/726G06T7/0016G06T7/48A61B5/7257G06T2207/30024A61B5/08A61B2576/00A61B5/4064A61B5/425A61B5/4325A61B5/201A61B5/4244G06T2207/20021G06T2207/20064A61B5/444G16H30/40A61B5/4312
Inventor KHALIL, ANDREBATCHELDER, KENDRA ANN
Owner UNIVERSITY OF MAINE
Why Eureka
Try Eureka