Quality control material for reagentless measurement of analytes
What is AI technical title?
AI technical title is built by PatSnap AI team. It summarizes the technical point description of the patent document.
a technology of quality control material and reagentless measurement, which is applied in the direction of instruments, chemical methods analysis, material analysis, etc., can solve the problems of no teaching that this method is effective, no reliable method for selecting qcm, and no compromise in sample integrity
Inactive Publication Date: 2003-08-21
NELLCOR PURITAN BENNETT LLC
View PDF15 Cites 12 Cited by
Summary
Abstract
Description
Claims
Application Information
AI Technical Summary
This helps you quickly interpret patents by identifying the three key elements:
Problems solved by technology
Method used
Benefits of technology
Problems solved by technology
The presence of such interferents affects the ability to perform tests on the serum or plasma and as such can be said to compromise sample integrity.
There is no teaching that this method is effective under atmospheric conditions.
Furthermore no reliable method for selecting QCM has been described.
However, they do not discuss QCM for monitoring calibration for any of the analytes.
Method used
Image
Click on the blue label to locate the original text in one second.
Reading with bidirectional positioning of images and text.
Examples
example 1
Hemoglobin
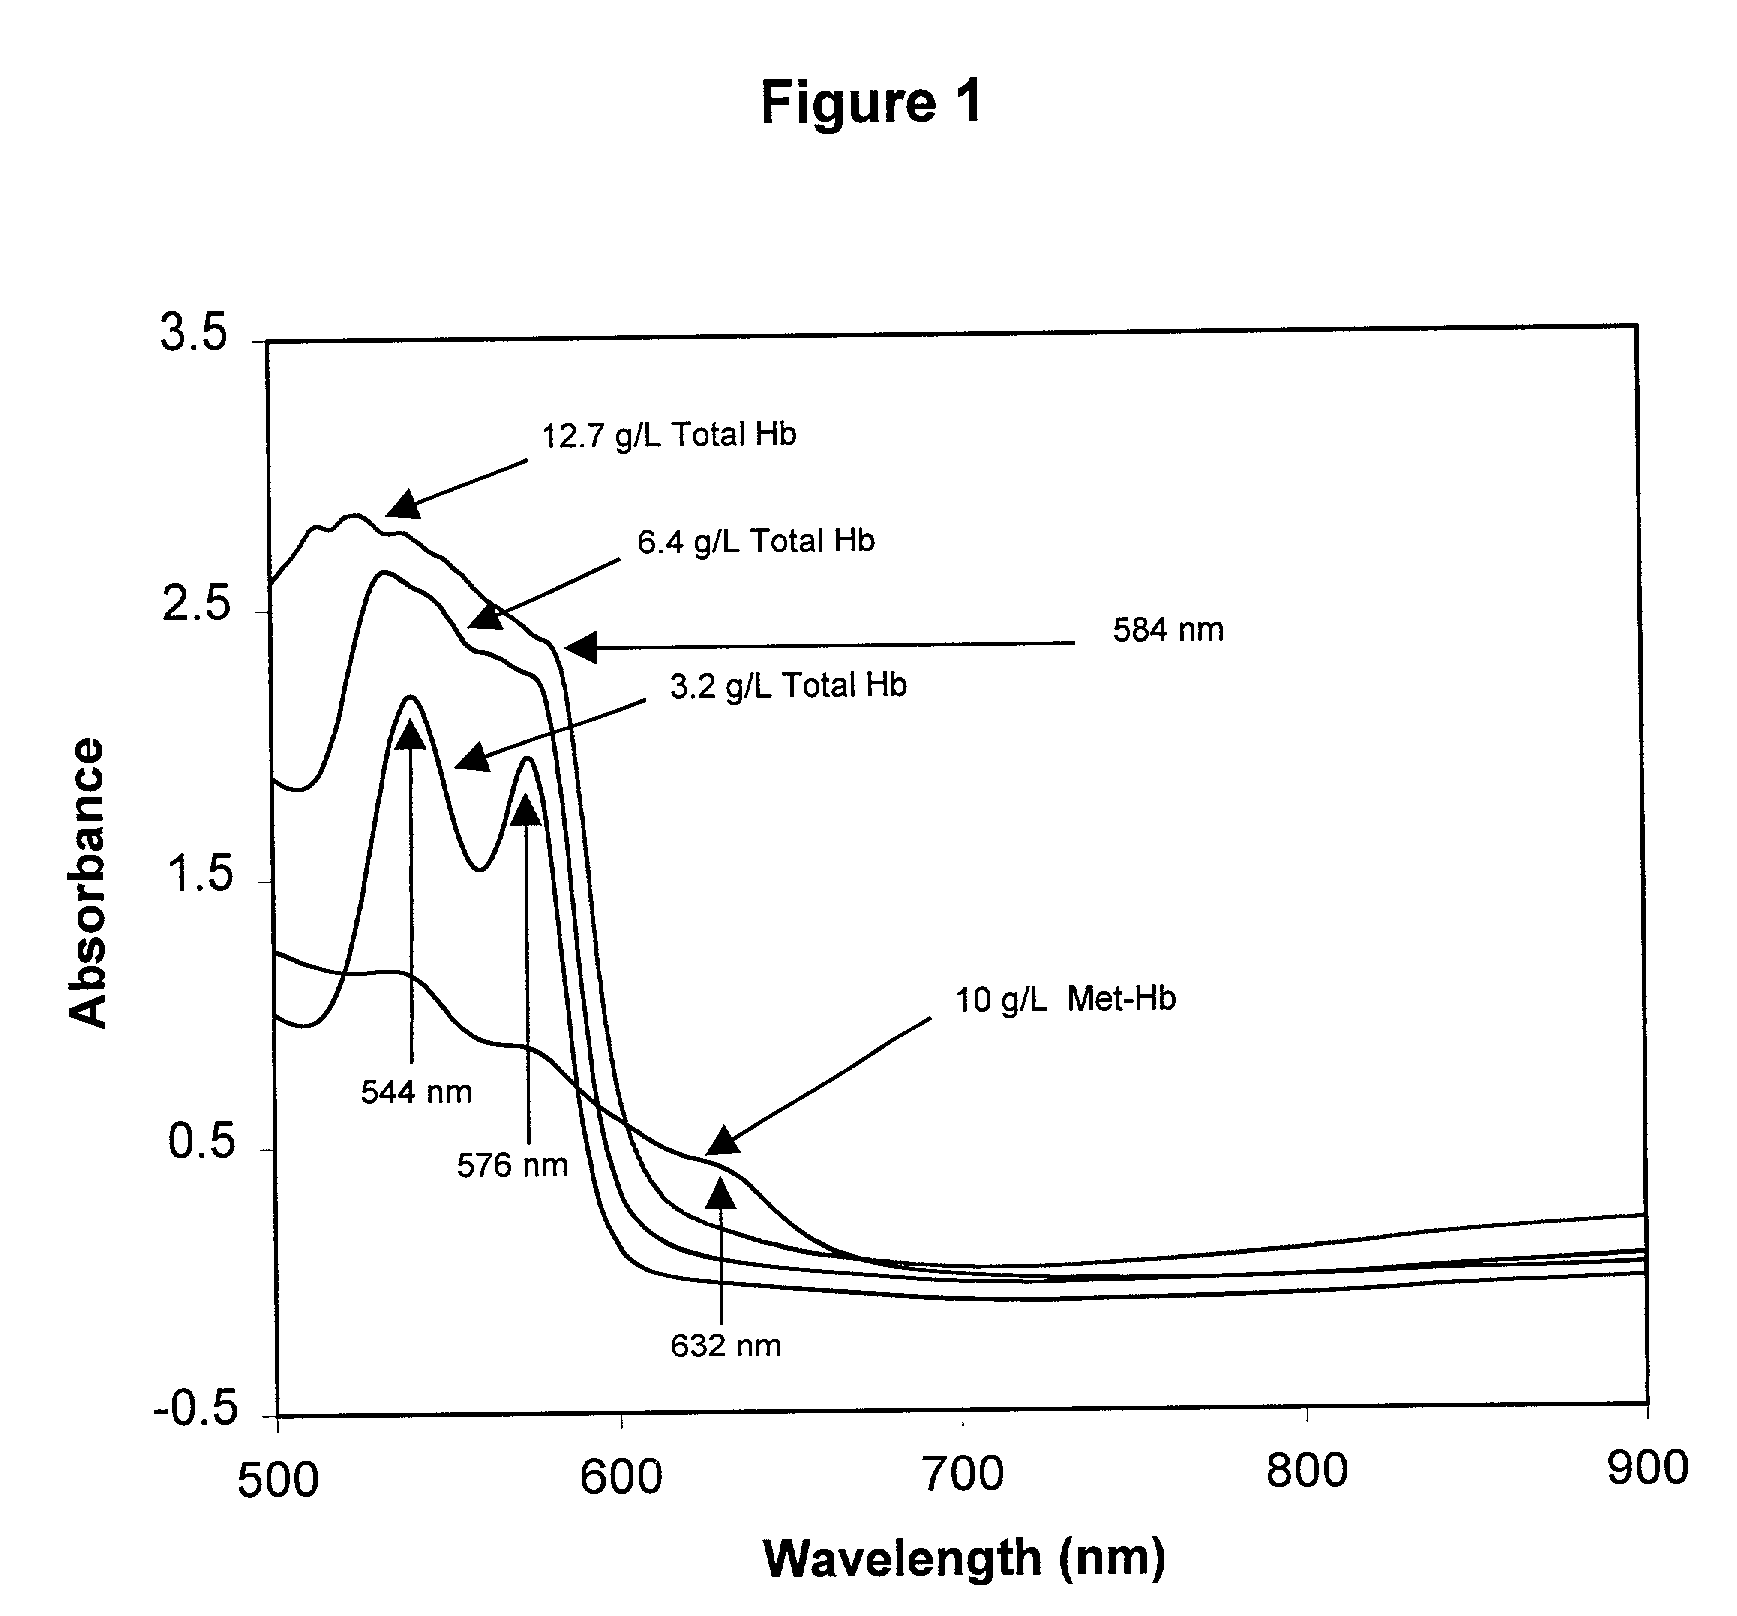
[0268] To prepare a Primary Calibration Algorithm for hemoglobin, sixty serum specimens with no visible interferents were stored refrigerated or frozen until used. More or fewer specimens may be used so long as a sufficient number is used to provide robust algorithm(s). Hb, IL, BR and BV were added to the normal sera to give final concentrations of 0-6.1 g / L, 0-5.1 g / l, 0-42.7 mg / dL, and 0-4.4 mg / dL respectively. Stock Hb was prepared by replacing the plasma (must be free from all interferents) from a blood sample, with twice its volume of water, and lysing the cells through three freeze-thaw cycles. For each cycle the blood was left in the freezer for 45-60 minutes, and then removed and placed on a rocker at room temperature for 30-45 minutes. Hb content of the lysate was measured by a spectrophotometric method for measuring oxy-Hb described by Tietz (Tietz Textbook of Clinical Chemistry, 2.sup.nd Ed, 1994, pp 2022-2025), after removing the RBC debris and unlysed RBC's by...
example 2
Hb-Based Blood Substitutes
[0283] The following is an example of a primary calibration algorithm for Hb-based blood substitute as described in WO 98 / 39634.
[0284] Equation 7 (obtained using disposable polypropylene dispensing tips)
g / L Hb-based blood substitute=23.97(1st D A541)-76.01(1st D A558)+130.84(1st D A600)-113.61(1st D A616)+0.30
[0285] where (1st D A) is the first derivative of the absorbance measurement at the wavelength specified in nanometers.
example 3
Biliverdin
[0286] The following examples of primary calibrations algorithms for biliverdin are described in U.S. Pat. Nos. 6,268,910 B1 and 5,846,492 and WO 97 / 47972.
[0287] Equation 8 (obtained using blood bag tubing)
mg / L BV-45.40(1st D A649)+323.15(1st D A731)-493.79(1st D A907)-1.14
[0288] where (1st D A) is the first derivative of the absorbance measurement at the wavelength specified in nanometers.
[0289] Equation 9 (obtained using disposable plastic dispensing tips)
mg / L BV=98.07(1st D A724 nm)-122.73(1st D A803 nm)+0.07
[0290] where (1st D A) is the first derivative of the absorbance measurement at the wavelength specified in nanometers.
[0291] Equation 10 (obtained using translucent pipette tips)
mg / dL BV=160.29(1st D A718)-206.15(1st D A781)+1.42
[0292] where (1st D A) is the first derivative of the absorbance measurement at the wavelength specified in nanometers.
PUM
Property
Measurement
Unit
length
aaaaa
aaaaa
wavelengths
aaaaa
aaaaa
wavelengths
aaaaa
aaaaa
Abstract
The present invention provides a method of monitoring calibration of a spectrophotometric apparatus that comprises one or more calibration algorithms for one or more analytes. This method comprises measuring absorbance of a quality control material with the apparatus to obtain a measurement, where the quality control material exhibits an absorbance spectra characterized as having a negative slope for a continuous spectral segment from about 5 nm to about 200 nm in length, and where the spectral segment includes a principal calibration wavelength for the one or more analytes. The method then involves calculating one or more concentration values from the measurement using the one or more calibration algorithms, followed by comparing the one or more concentration values with an assigned value given to the quality control material for each of the one or more analytes, and determining if there is a violation of a pre-established quality control rule. In this way one or more calibration algorithms of the apparatus may be monitored. A reagentless method for determining the concentration of one or more analytes in a sample in a spectrophotometric apparatus comprising at least one primary calibration algorithm is also disclosed. The present invention also provides to a method for selecting one or more substances as a quality control material for monitoring at least one primary calibration algorithm on a spectrophotometric apparatus. The present invention includes a quality control material for mimicking two or more analytes comprising, one or more substances having a combined absorption spectrum exhibiting a negative slope for a continuous spectral segment from about 5 nm to 200 nm in length, in a portion of an absorption spectrum, including one or more principal calibration wavelengths, for the two or more analytes."
Description
[0001] This application is a continuation-in-part of U.S. Ser. No. 09 / 147,373, filed Jun. 12, 1997, which claims priority from GB serial number 9612264.3, filed Jun. 12, 1996.[0002] This invention relates to the field of reagentless spectrophotometric measurements of analytes in biological and non-biological samples. More specifically, the invention relates to the calibration and monitoring of calibration algorithm(s) of spectrophotometric apparatus used for analyte measurements.[0003] Clinical laboratory tests are routinely performed on the serum or plasma of whole blood. In a routine assay, red blood cells (RBC) are separated from plasma by centrifugation, or RBC's and various plasma proteins are separated from serum by clotting prior to centrifugation. Hemoglobin (Hb), light-scattering substances like lipid particles, and bile pigments bilirubin (BR) and biliverdin (BV) are typical blood components which will interfere with and affect spectrophotometric and other blood analytical...
Claims
Application Information
Patent Timeline
Application Date:The date an application was filed.
Publication Date:The date a patent or application was officially published.
First Publication Date:The earliest publication date of a patent with the same application number.
Issue Date:Publication date of the patent grant document.
PCT Entry Date:The Entry date of PCT National Phase.
Estimated Expiry Date:The statutory expiry date of a patent right according to the Patent Law, and it is the longest term of protection that the patent right can achieve without the termination of the patent right due to other reasons(Term extension factor has been taken into account ).
Invalid Date:Actual expiry date is based on effective date or publication date of legal transaction data of invalid patent.
Patent Type & AuthorityApplications(United States)

