Crossplot analysis of A.V.O. anomolies in seismic surveying

a technology of cross-plot analysis and seismic surveying, which is applied in the field of cross-plot analysis of a.v.o. anomolies in seismic surveying, can solve the problems of large seismic 3-d survey volume, inability to carry out manual matching by simple inspection, and geologists often miss avo anomalies

Active Publication Date: 2004-12-02
ASPEN PARADIGM HLDG LLC
View PDF2 Cites 21 Cited by
  • Summary
  • Abstract
  • Description
  • Claims
  • Application Information

AI Technical Summary

Problems solved by technology

Seismic 3-D surveys are very large and contain gigabytes and even terabytes of data.
Double plots of the kind shown in FIG. 5 can disclose A.V.O. anomalies, howeverdue to the size of typical surveys it is not practical for the matching to be carried out manually by simple inspection.
A geologist may often miss an AVO anomaly when inspecting dual attribute datasets.
However, one disadvantage is that, unlike the double plotting of FIG. 5, the crossplot itself loses the location information of the point mapped.
The problem with Conventional AVO Crossplotting
Unfortunately, reality is not as kind as FIG. 7 implies.
In reality the separation of AVO anomalies from the rest of the data using AVO crossplotting does not work in most cases.
All the data is concentrated together and there is no way of reliably discriminating between AVO and non-AVO effects.
Hence, each reflection is contaminated by the shape of the source function--the wavelet.
The wavelet variations lead to distortions, which affect the AVO attributes and typically distort the simplified picture, causing a scatter of points around the lines of FIG. 13.
The extent of the scattering is such that it is difficult to resolve between the different trend lines, and thus recognizable clustering is not seen.
However, be that as it may, the two datasets in the crossplot space of FIG. 15 cannot be separated because they do not form distinct clusters.
Again when color coded it is easy to see that the data lines up along two different trend lines, but without prior knowledge there is no way of identifying the trends.
Hence, theoretical division of the crossplot space to different AVO regions turns out to be unrealistic because there is no one-to-one mapping of crossplot space to AVO signatures.
Indeed, straightforward use of the angle plot crossplot does not allow for the separation of Class IV from Class I. However, as will be explained in greater detail below, a preprocessing stage of constraining the input data can allow for separation between Class I and class IV.

Method used


Image

  • Crossplot analysis of A.V.O. anomolies in seismic surveying
  • Crossplot analysis of A.V.O. anomolies in seismic surveying
  • Crossplot analysis of A.V.O. anomolies in seismic surveying

Examples


Embodiment Construction

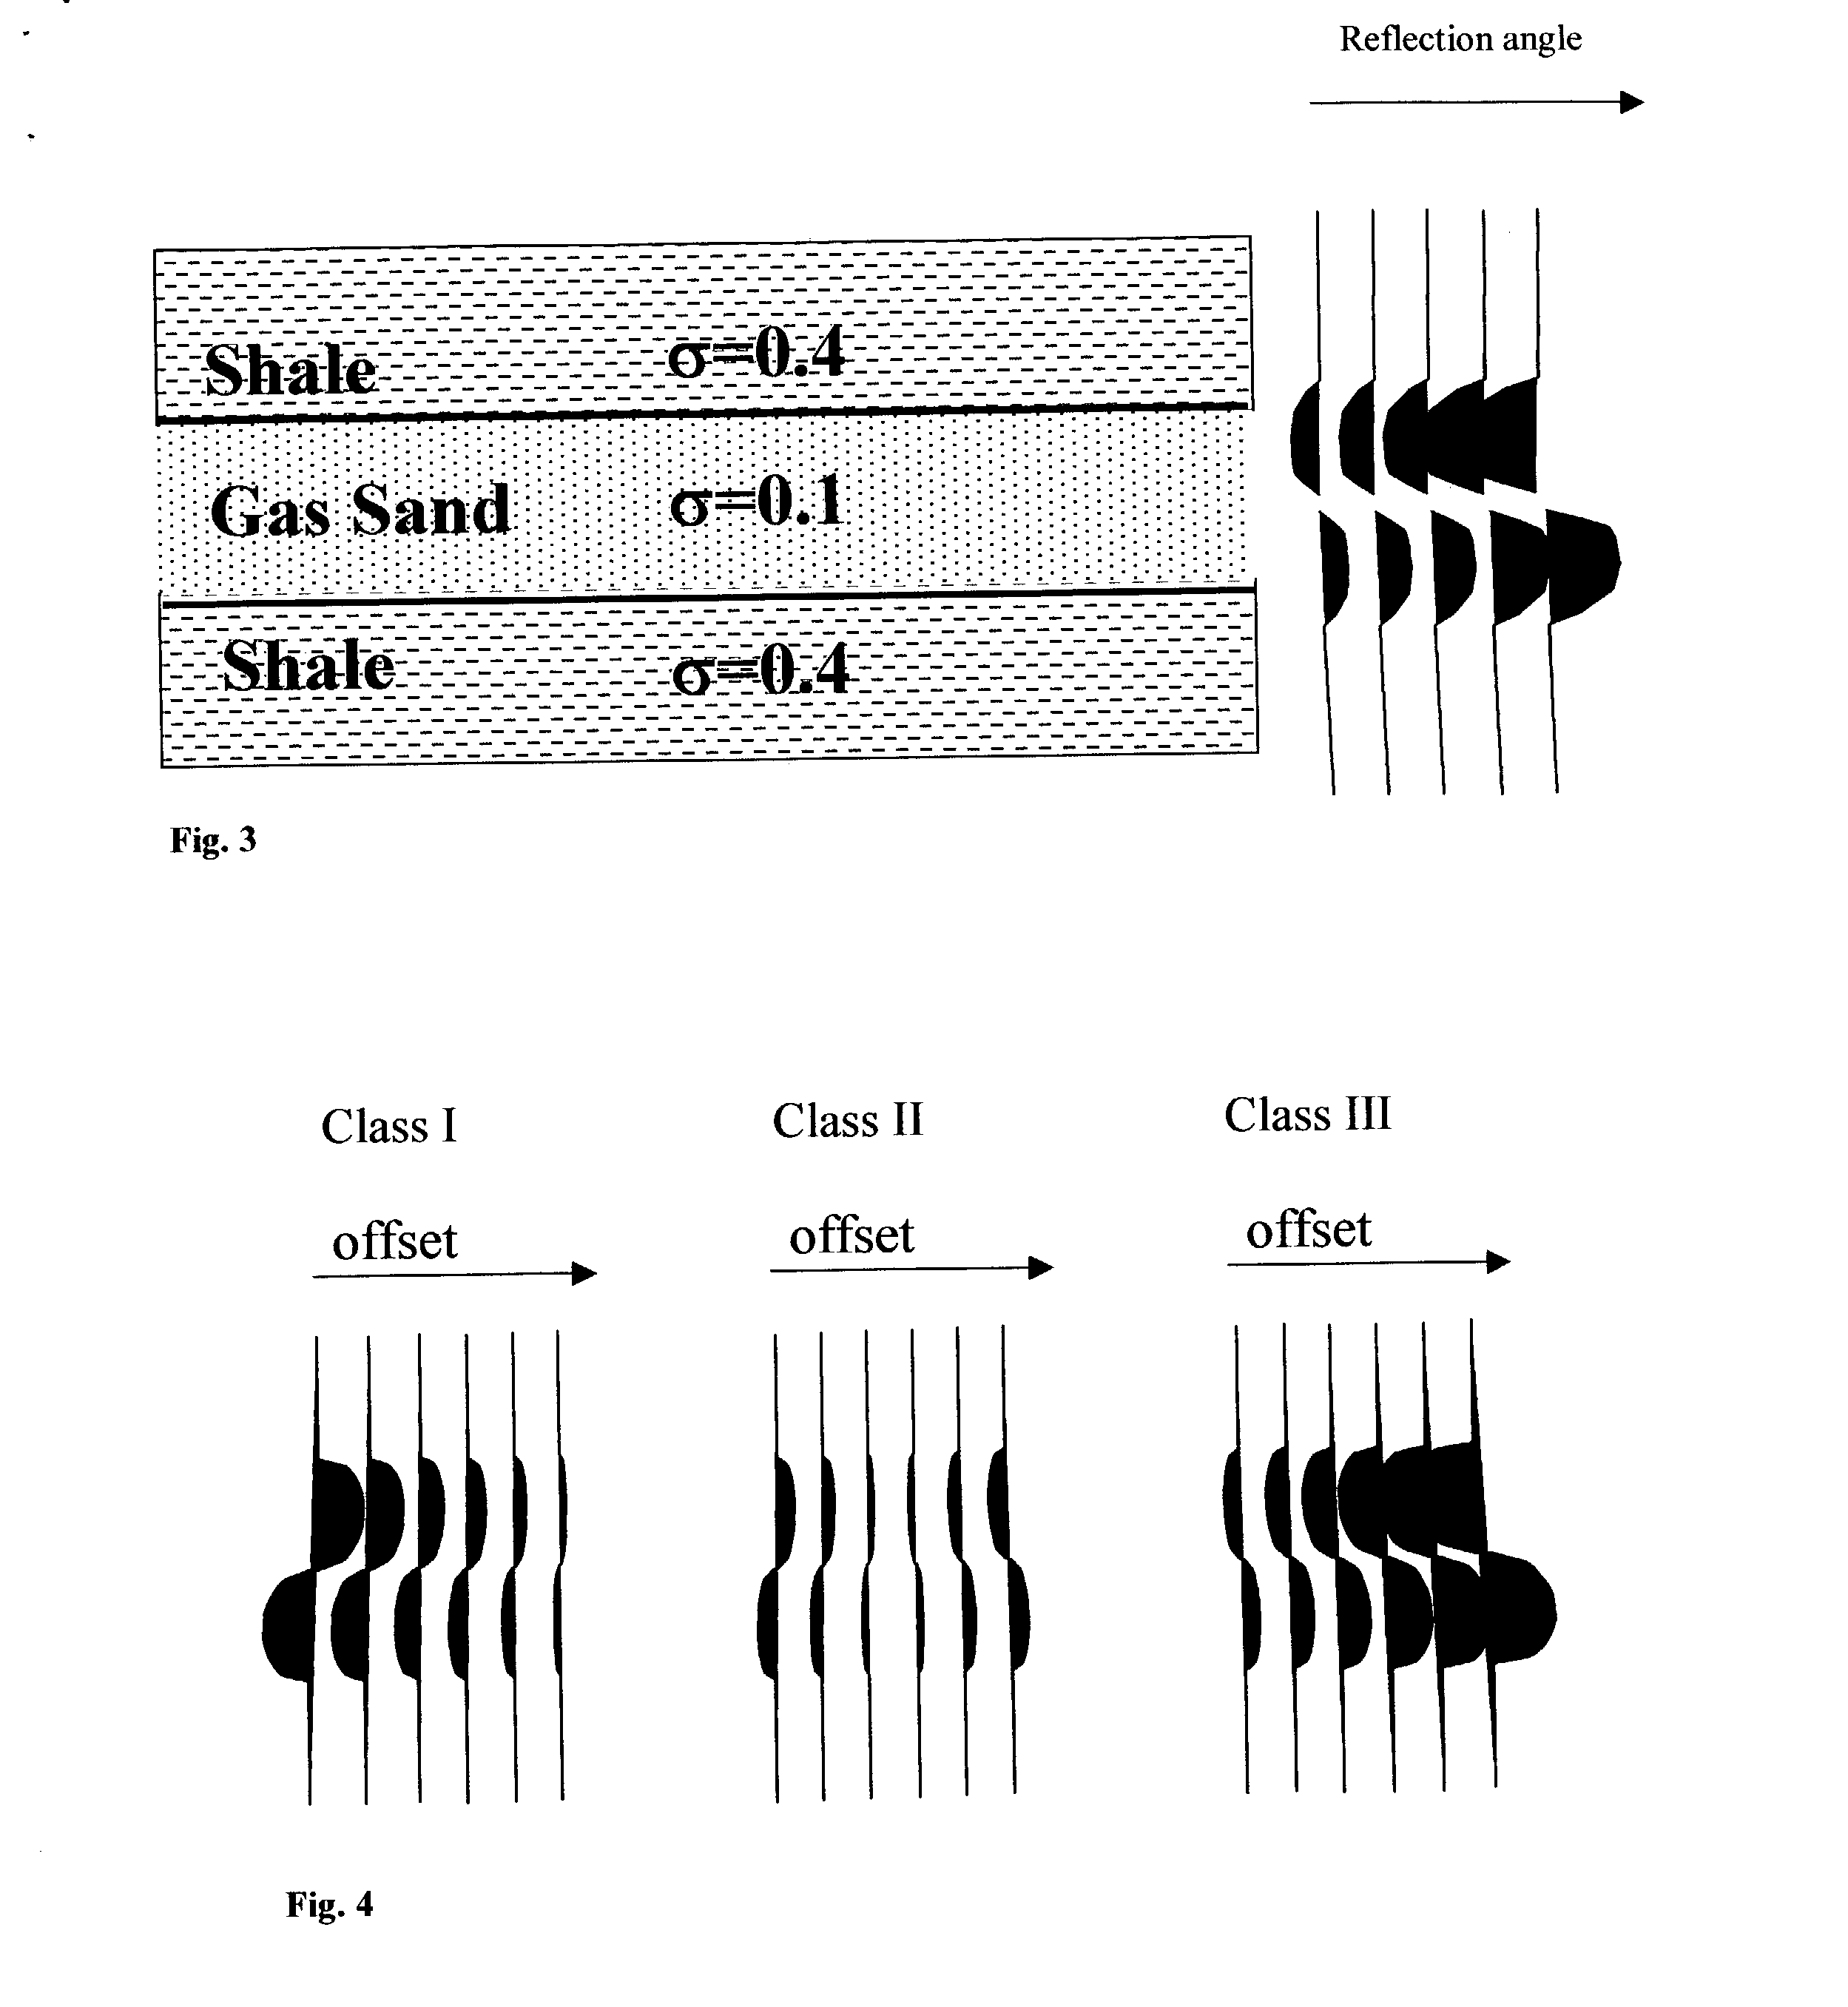
[0141] Reference is now made to FIG. 21, which shows seismic traces of synthetic seismic data on which the crossplot--angleplot procedure was practiced. FIG. 21 shows two different seismic data sets which were computer generated, one for brine filled sand / shale contact, that is a set of "no-oil" data, and the other for gas sand / shale contact. Each of the data set therefore contains different clustering. Between the two datasets there are four events representing AVO anomalies of classes I, II, III, and IV (top to bottom respectively in the figure). Elastic parameters for the AVO data were taken from Barnola and White, 2001. The objective of the example is to show that when using the crossplot--angleplot procedure it is possible to identify all classes of AVO anomalies and separate them from the no-oil data. The two datasets displayed in FIG. 21 are seismic traces as a function of reflection angle. The AVO signature indicates how the amplitude changes as a function of the reflection ...


PUM


Abstract

A method of seismic data analysis to provide clustering of A.V.O. data into A.V.O. anomaly types, the method comprising: obtaining successive values of a plurality of seismic attributes, each seismic attribute comprising a respective property of a seismic reflection event, grouping said values using a running window of a predetermined size into a plurality of groups, for each group identifying first and second parameters corresponding to said first and second attributes, and plotting each group as a single event based on said group parameters, said group parameters having been selected to cause clustering of said seismic reflection events on said plot according to the presence or absence of A.V.O. anomalies.

Description

FIELD AND BACKGROUND OF THE INVENTION[0001] The present invention relates to improvements to crossplot analysis of A.V.O. anomalies in seismic surveying and, more particularly, but not exclusively to apparatus and a method for identifying an A.V.O. anomaly indicative of the presence of oil or gas, via an improved A.V.O. crossplot.[0002] Seismic surveying is the basic technology used for imaging the subsurface for oil exploration. Seismic surveying involves the transmission of sound energy into the subsurface and recording the echoes that are reflected from the boundaries between the layers in the subsurface. The recorded signal is processed and displayed as seismic sections. FIG. 1 is an example of a typical seismic section in which the vertical axis represents depth and the horizontal axis represents surface distance. The seismic section in FIG. 1 is a vertical cross-section of the sub-surface, showing layers 10, faults 12, folds 14 and other subsurface features. Using such section...

Claims


Application Information

Patent Timeline
Patent Type & Authority Applications(United States)
IPC IPC(8): G01V1/30
CPCG01V1/30G01V2210/632
Inventor CANNING, ANAT
Owner ASPEN PARADIGM HLDG LLC
Why Eureka
Try Eureka