
Displaying image data

a technology of image data and data, applied in the field of display of image data, can solve the problems of increasing the difficulty of identifying data of interest, increasing the difficulty of users, and increasing the number of sets, and achieve the effect of facilitating the representation and display

Active Publication Date: 2005-01-27
AUTODESK INC
View PDF4 Cites 1 Cited by
  • Summary
  • Abstract
  • Description
  • Claims
  • Application Information

AI Technical Summary

Benefits of technology

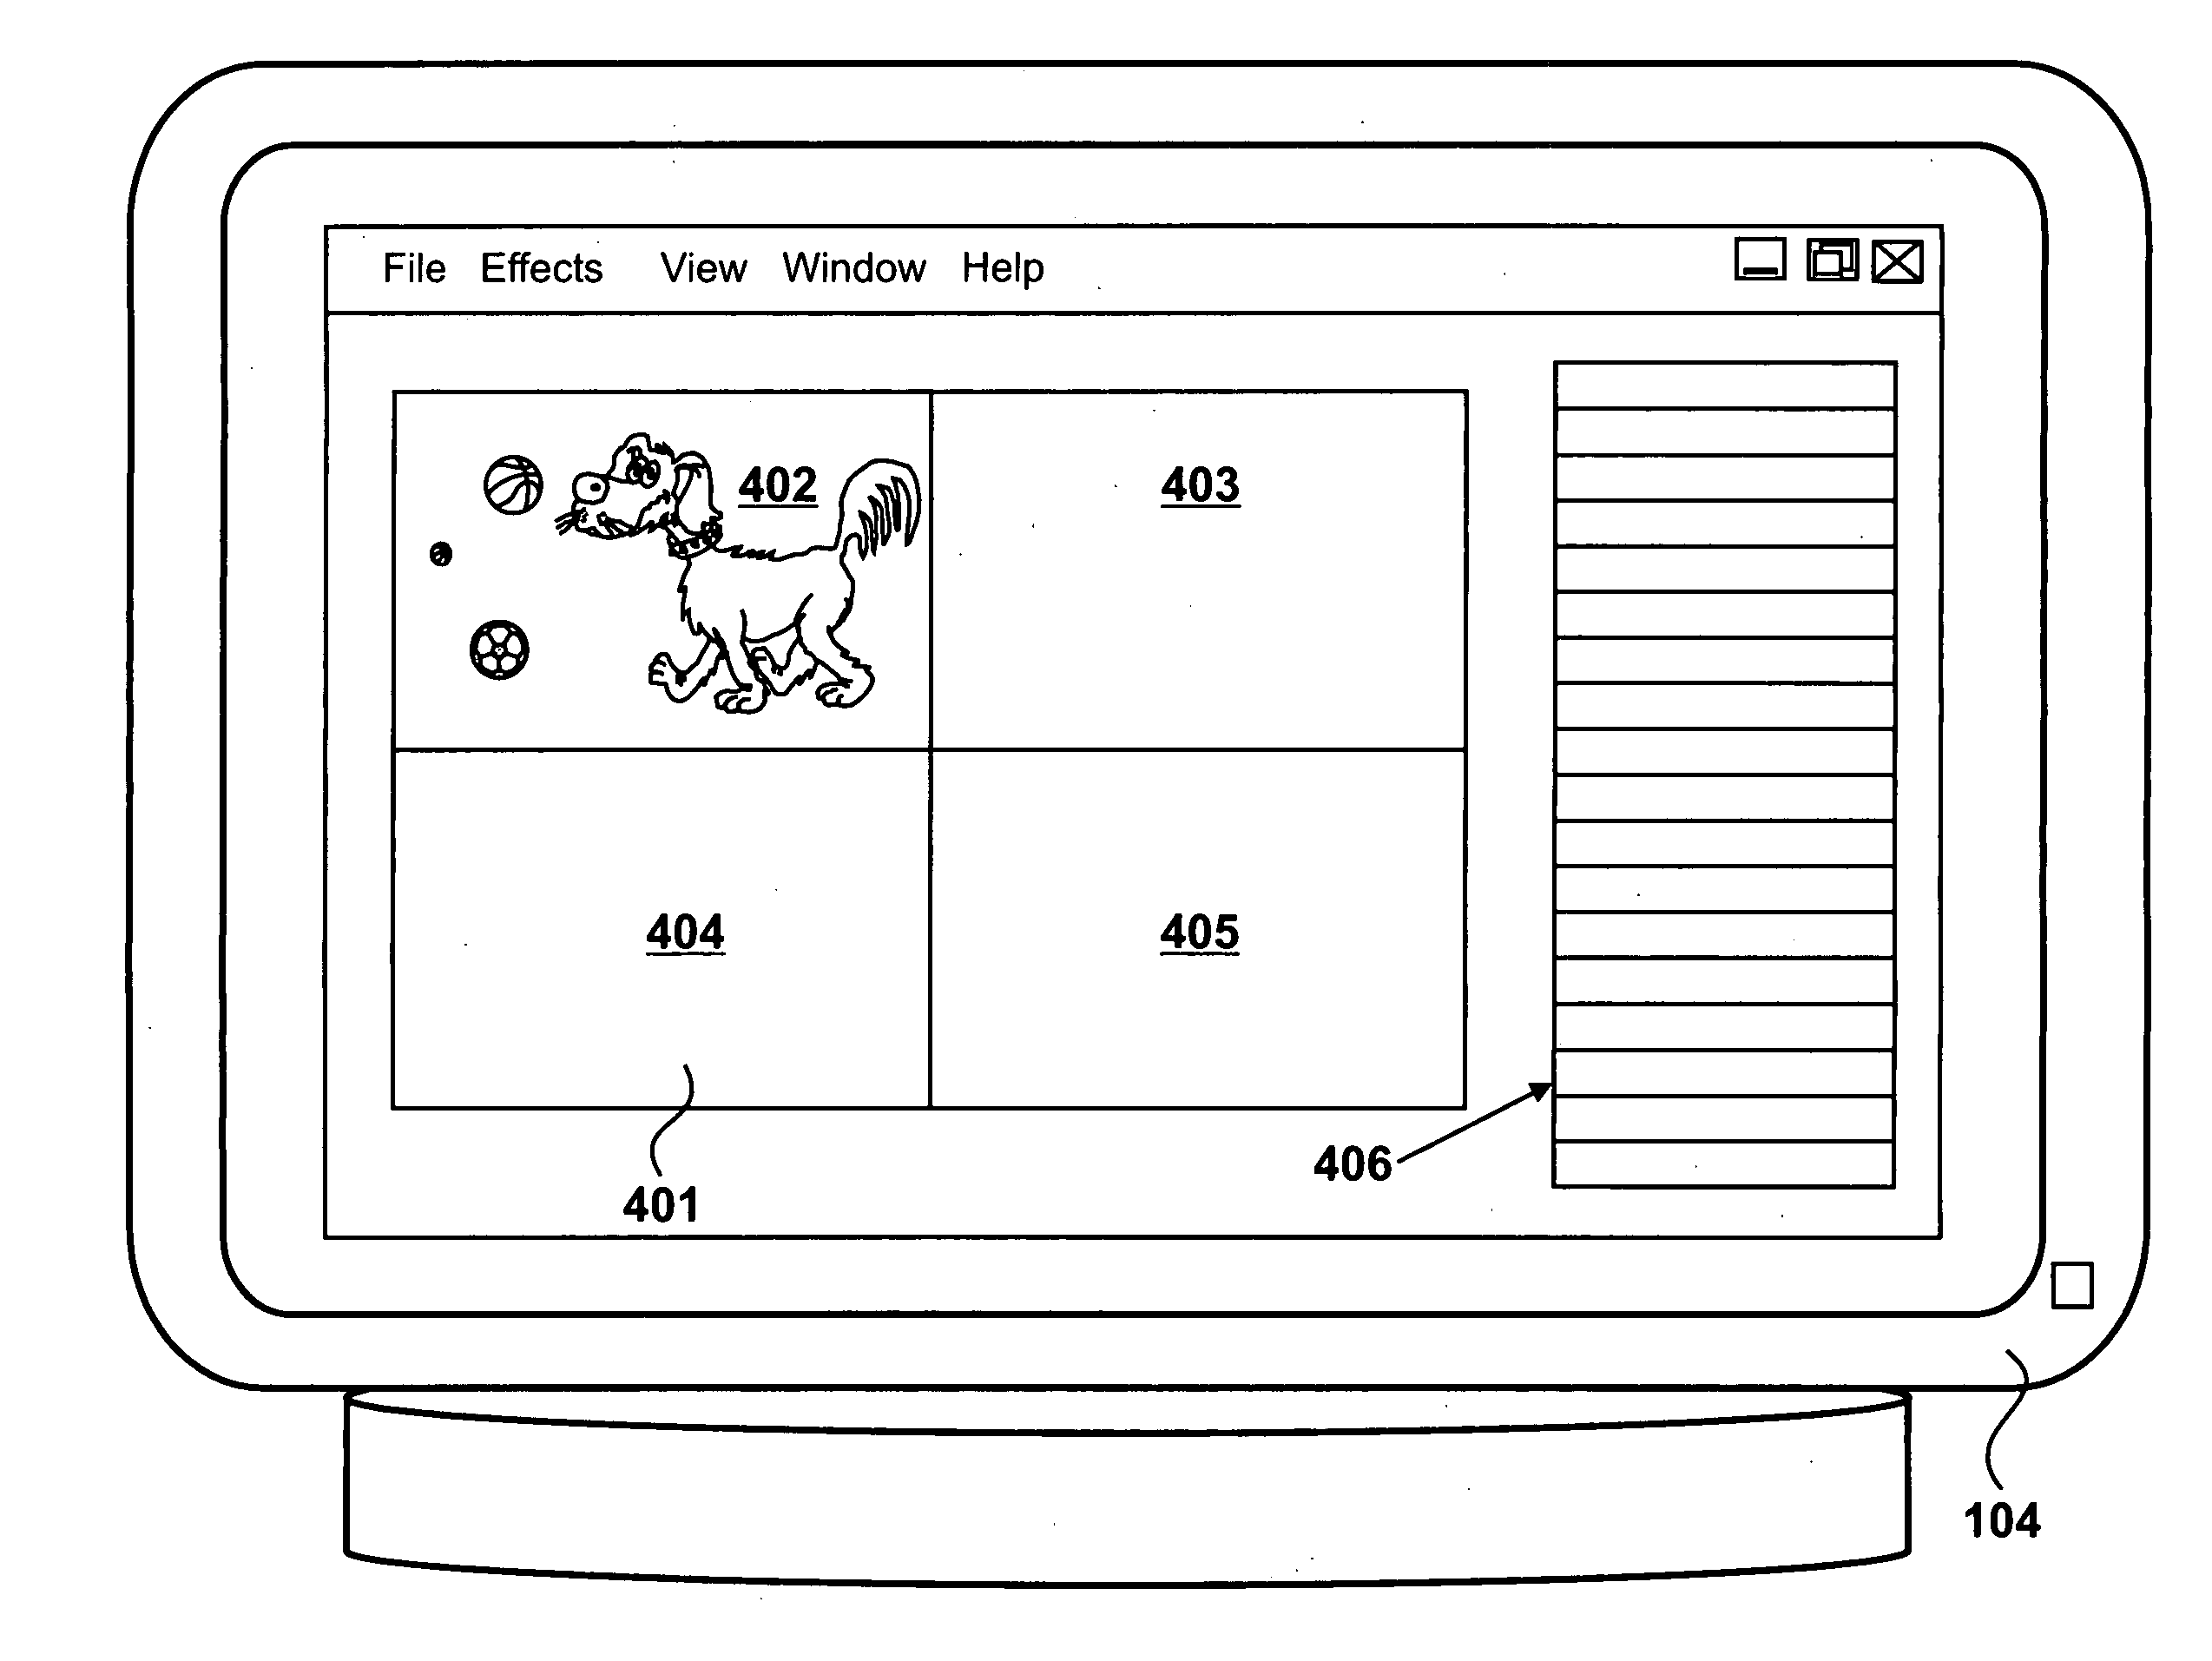
[0007] The present invention generally facilitates the representation and display of three dimensional object data and relationships between object elements. A list of relationships between elements of the scene is generated, wherein each entry on said list identifies two elements and the nature of a relationship between the two elements. A displayable schematic representation of the scene is created in which elements of the scene are defined by nodes and relationships between the nodes are represented by links. Input data is received in response to displaying the list of relationships that identifies one of the relationships. A portion of the schematic representation is displayed showing the elements related by the relationship identified by the input data.

Problems solved by technology

A problem associated with representing three-dimensional data is that a user often encounters difficulties in terms of identifying data of interest.
This problem becomes more acute as data sets become larger.

Method used


Image

  • Displaying image data
  • Displaying image data
  • Displaying image data

Examples


Embodiment Construction

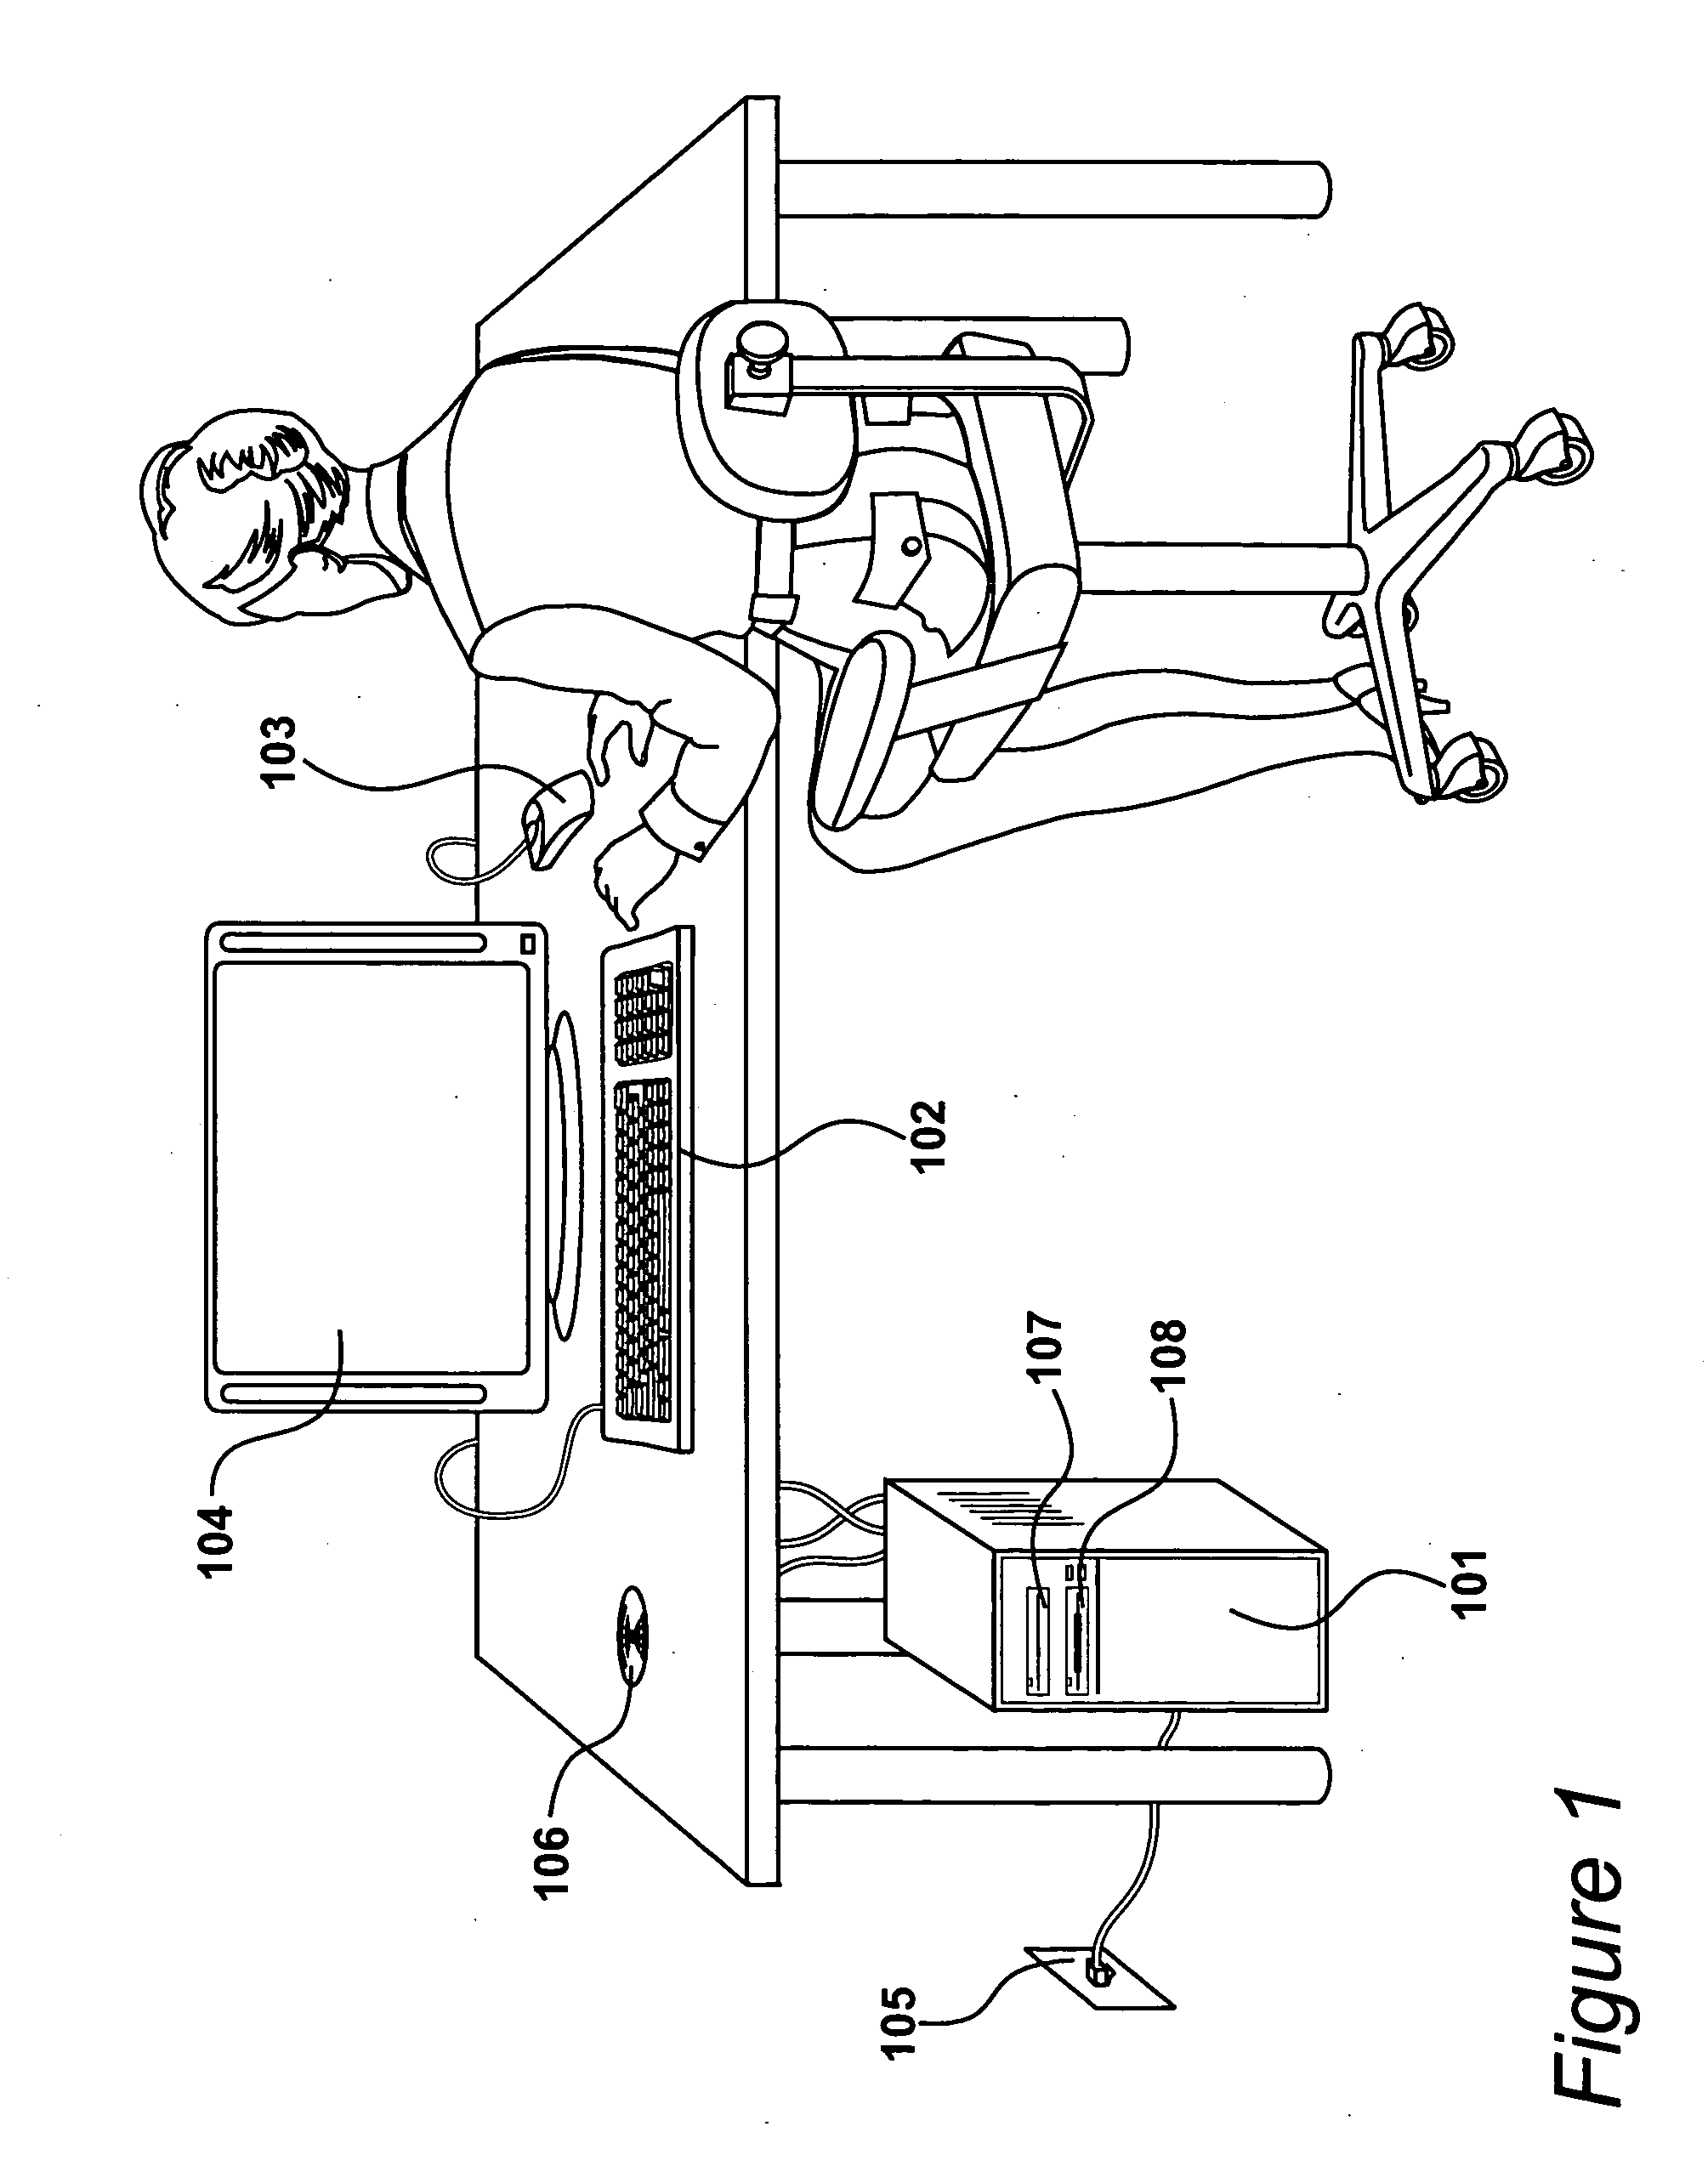
[0035]FIG. 1 shows an environment for representing a machine-readable definition of a three-dimensional object, according to one embodiment of the present invention. Data processing is effected by a programmable computer system 101 that responds to input data from a user via a keyboard 102 and a mouse 103. Alternatively, other input devices may be used such as a stylus and tablet or a tracker-ball. Output data from computer system 101 is displayed to the user via a visual display unit 104. A network connection 105 allows computer system 101 to communicate with a local server and also facilitates communication externally via the internet.

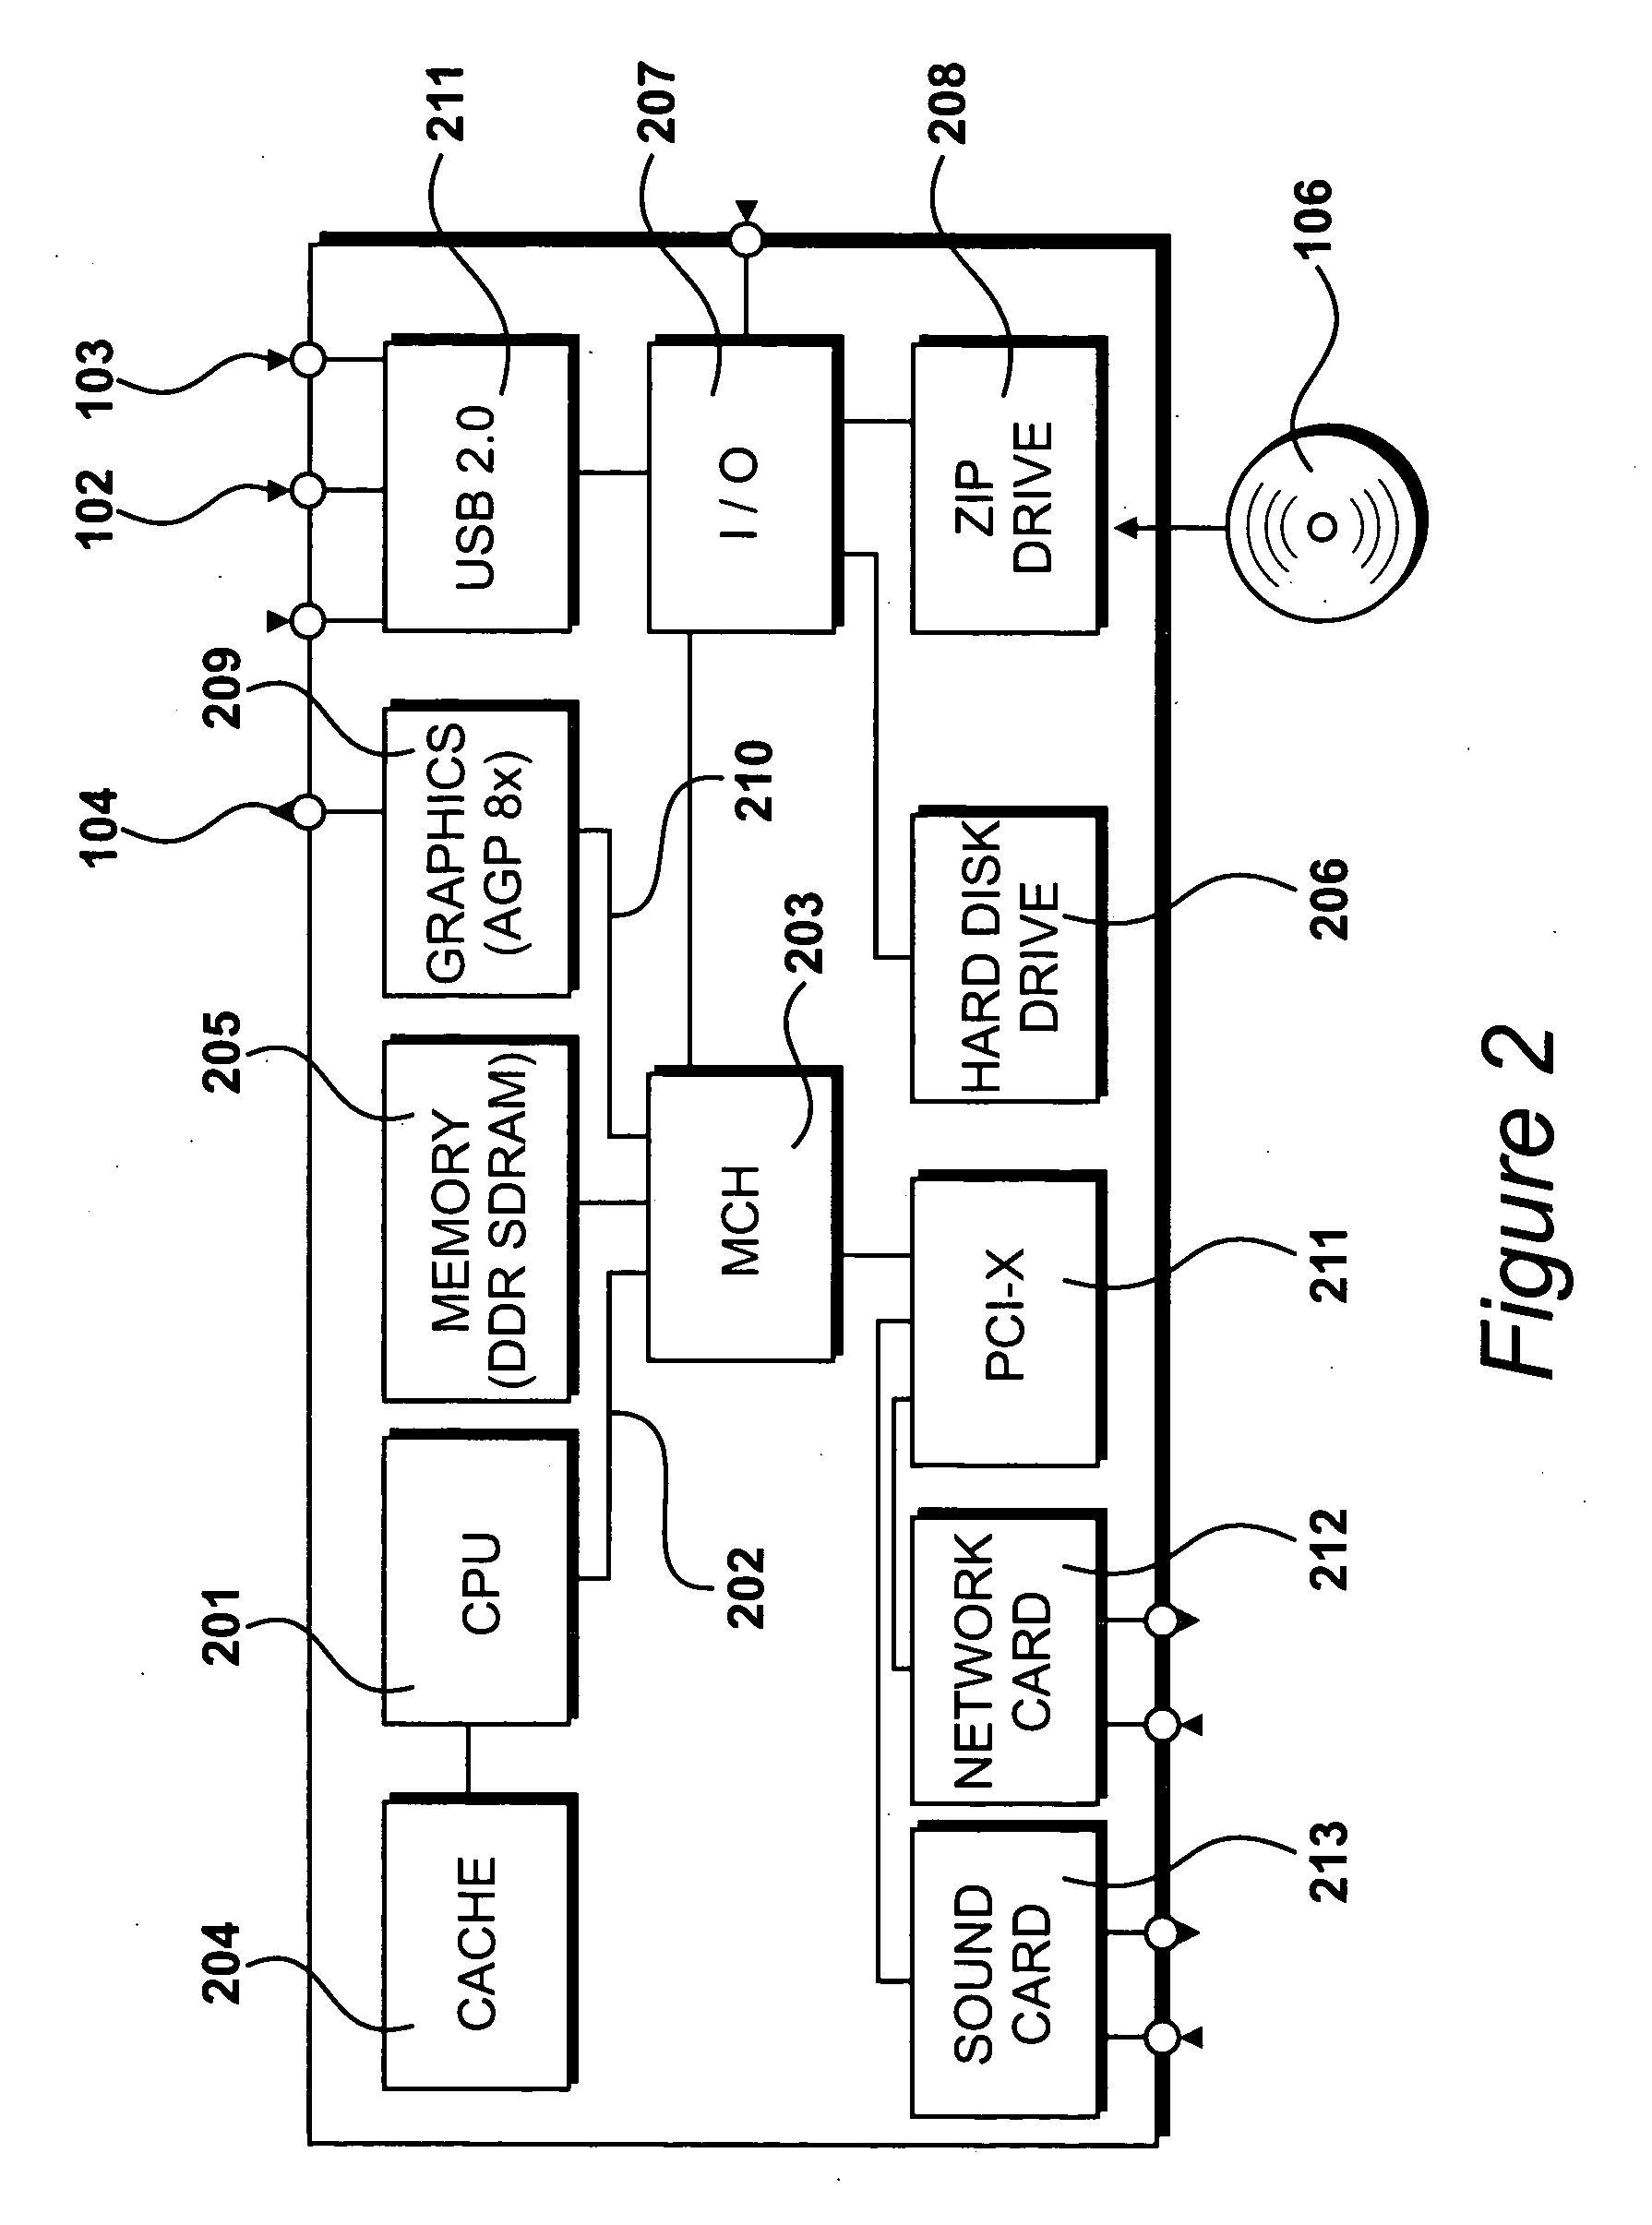
[0036] Computer system 101 receives input data from the keyboard 102 and other input devices via cable connections although in alternative embodiments radio interfaces could be provided. Many different types of programmable computer system 101 could be deployed and in alternative embodiments of the present invention the functionality could be provid...


PUM


Abstract

A machine-readable definition of a three-dimensional scene is represented. A list of relationships between elements of the scene is generated, wherein each entry on said list identifies two elements and the nature of a relationship between the two elements. A displayable schematic representation of the scene is created in which elements of the scene are defined by nodes and relationships between the nodes are represented by links. Input data is received in response to displaying the list of relationships that identifies one of the relationships. A portion of the schematic representation is displayed showing the elements related by the relationship identified by the input data.

Description

CROSS-REFERENCE TO RELATED APPLICATIONS [0001] This application claims benefit of U.S. provisional patent application Ser. No. 60 / 489,308, filed Jul. 22, 2003, which is herein incorporated by reference.BACKGROUND OF THE INVENTION [0002] 1. Field of the Invention [0003] Embodiments of the present invention generally relate to representing a schematic of a scene including three dimensional objects and the relationships between the objects. [0004] 2. Description of the Related Art [0005] The present invention relates to representing a machine-readable definition of a three-dimensional image. [0006] A problem associated with representing three-dimensional data is that a user often encounters difficulties in terms of identifying data of interest. This problem becomes more acute as data sets become larger. SUMMARY OF THE INVENTION [0007] The present invention generally facilitates the representation and display of three dimensional object data and relationships between object elements. A ...

Claims


Application Information

Patent Timeline
Patent Type & Authority Applications(United States)
IPC IPC(8): G06F17/00G06T17/00
CPCG06T17/00
Inventor NIES, IAN A.RUSSO, MICHAEL JOHN
Owner AUTODESK INC
Learn More