Information displaying method, information displaying device, and computer program

Inactive Publication Date: 2005-03-17
SONY CORP
3 Cites 255 Cited by

AI-Extracted Technical Summary

Problems solved by technology

However, when the number of icons within a window becomes large, it is no longer possible to fit all of the icons within a single window.
This makes it difficult to discern which files belong to which window.
In other words, browsability is impaired.
Further, browsability is also impaired in a similar manner when the number of icons is not changed but the window size is reduced.
Moreover, as when a large number of icons are present within a window, when a large number of windows are open on the desktop screen, the windows may overlap with each other and the screen may similarly become difficult for the u...

Method used

[0092] By ensuring that the percentage area occupied on the desktop screen by the total area of the windows does not exceed the fixed value, in hierarchical window displaying, it is possible to ensure browsability of the icon display, and all information can be displayed on the computer screen in a manner that is easy to understand.
[0095] Further, it is possible to set a margin of a certain extent in the occupancy percentage in such a manner that it is possible to guarantee easy browsability without having to carry out unnecessary processing. Namely, an upper limit value and a lower limit value may be set for the occupancy percentage of the total area of the windows on the desktop screen and it is also possible to provide fixed control to perform recalculating and resetting of the window sizes within this range.
[0100] The menu item “Relax” is for designating whether to carry out processing to cause repulsion between displayed objects so as to alleviate overlapping of the objects when the occupancy percentage of the displayed objects on the desktop screen or within a window is increased.
[0105] Next, a description is given taking note of one window arranged on the desktop screen. Operations such as adding displayed objects such as icons, moving displayed objects between windows, and deleting displayed objects are possible according to, for example, user operations via a mouse within the windows, so that the number of displayed objects contained in a window can be increased or reduced.
[0110] As a result, the browsability of the displayed objects on the computer screen is ensured. Further, margin regions where there are always no objects displayed can be ensured in operating regions such as the desktop or window frame so as to alleviate the psychological operation load felt by the user in such a case of adding display objects.
[0114] Further, assume that five more icons are moved from the left-side window to the right-side window. At t...

Benefits of technology

[0049] As described in detail above, according to the present invention, it is possible to provide a superior information displaying method, information displaying device, and computer program capable of displaying objects such as documents and photographs managed in a hierarchical manner using directories and folders on a GUI screen in a manner that is easy to see.
[0050] Further, according to the present invention, it is possible to provide a superior information displaying method, information displaying device, and computer program capable of displaying objects on a GUI screen in a manner which is easy to see according to the number of icons within a window, changes in the window size, and the number of objects displayed on the desktop screen.
[0051] According to the presen...

Abstract

In order to display all information to be displayed on a computer screen in a manner which is easy to understand in hierarchical window displaying, an entire screen is taken as a root window, and display objects of windows and icons corresponding to child windows of the root window are arranged on the root window. Lower order windows and icons are also present within the child windows. The sizes of the windows are user-programmable, and each window has its own independent scale. The scales are decided in such a manner that a proportion occupied by the total surface area of the display objects within a window is fixed or does not exceed a fixed value with respect to the surface area of the window.

Application Domain

Technology Topic

Image

  • Information displaying method, information displaying device, and computer program
  • Information displaying method, information displaying device, and computer program
  • Information displaying method, information displaying device, and computer program

Examples

  • Experimental program(1)

Example

[0067] In the following, a detailed description of the present invention is given with reference to the attached drawings.
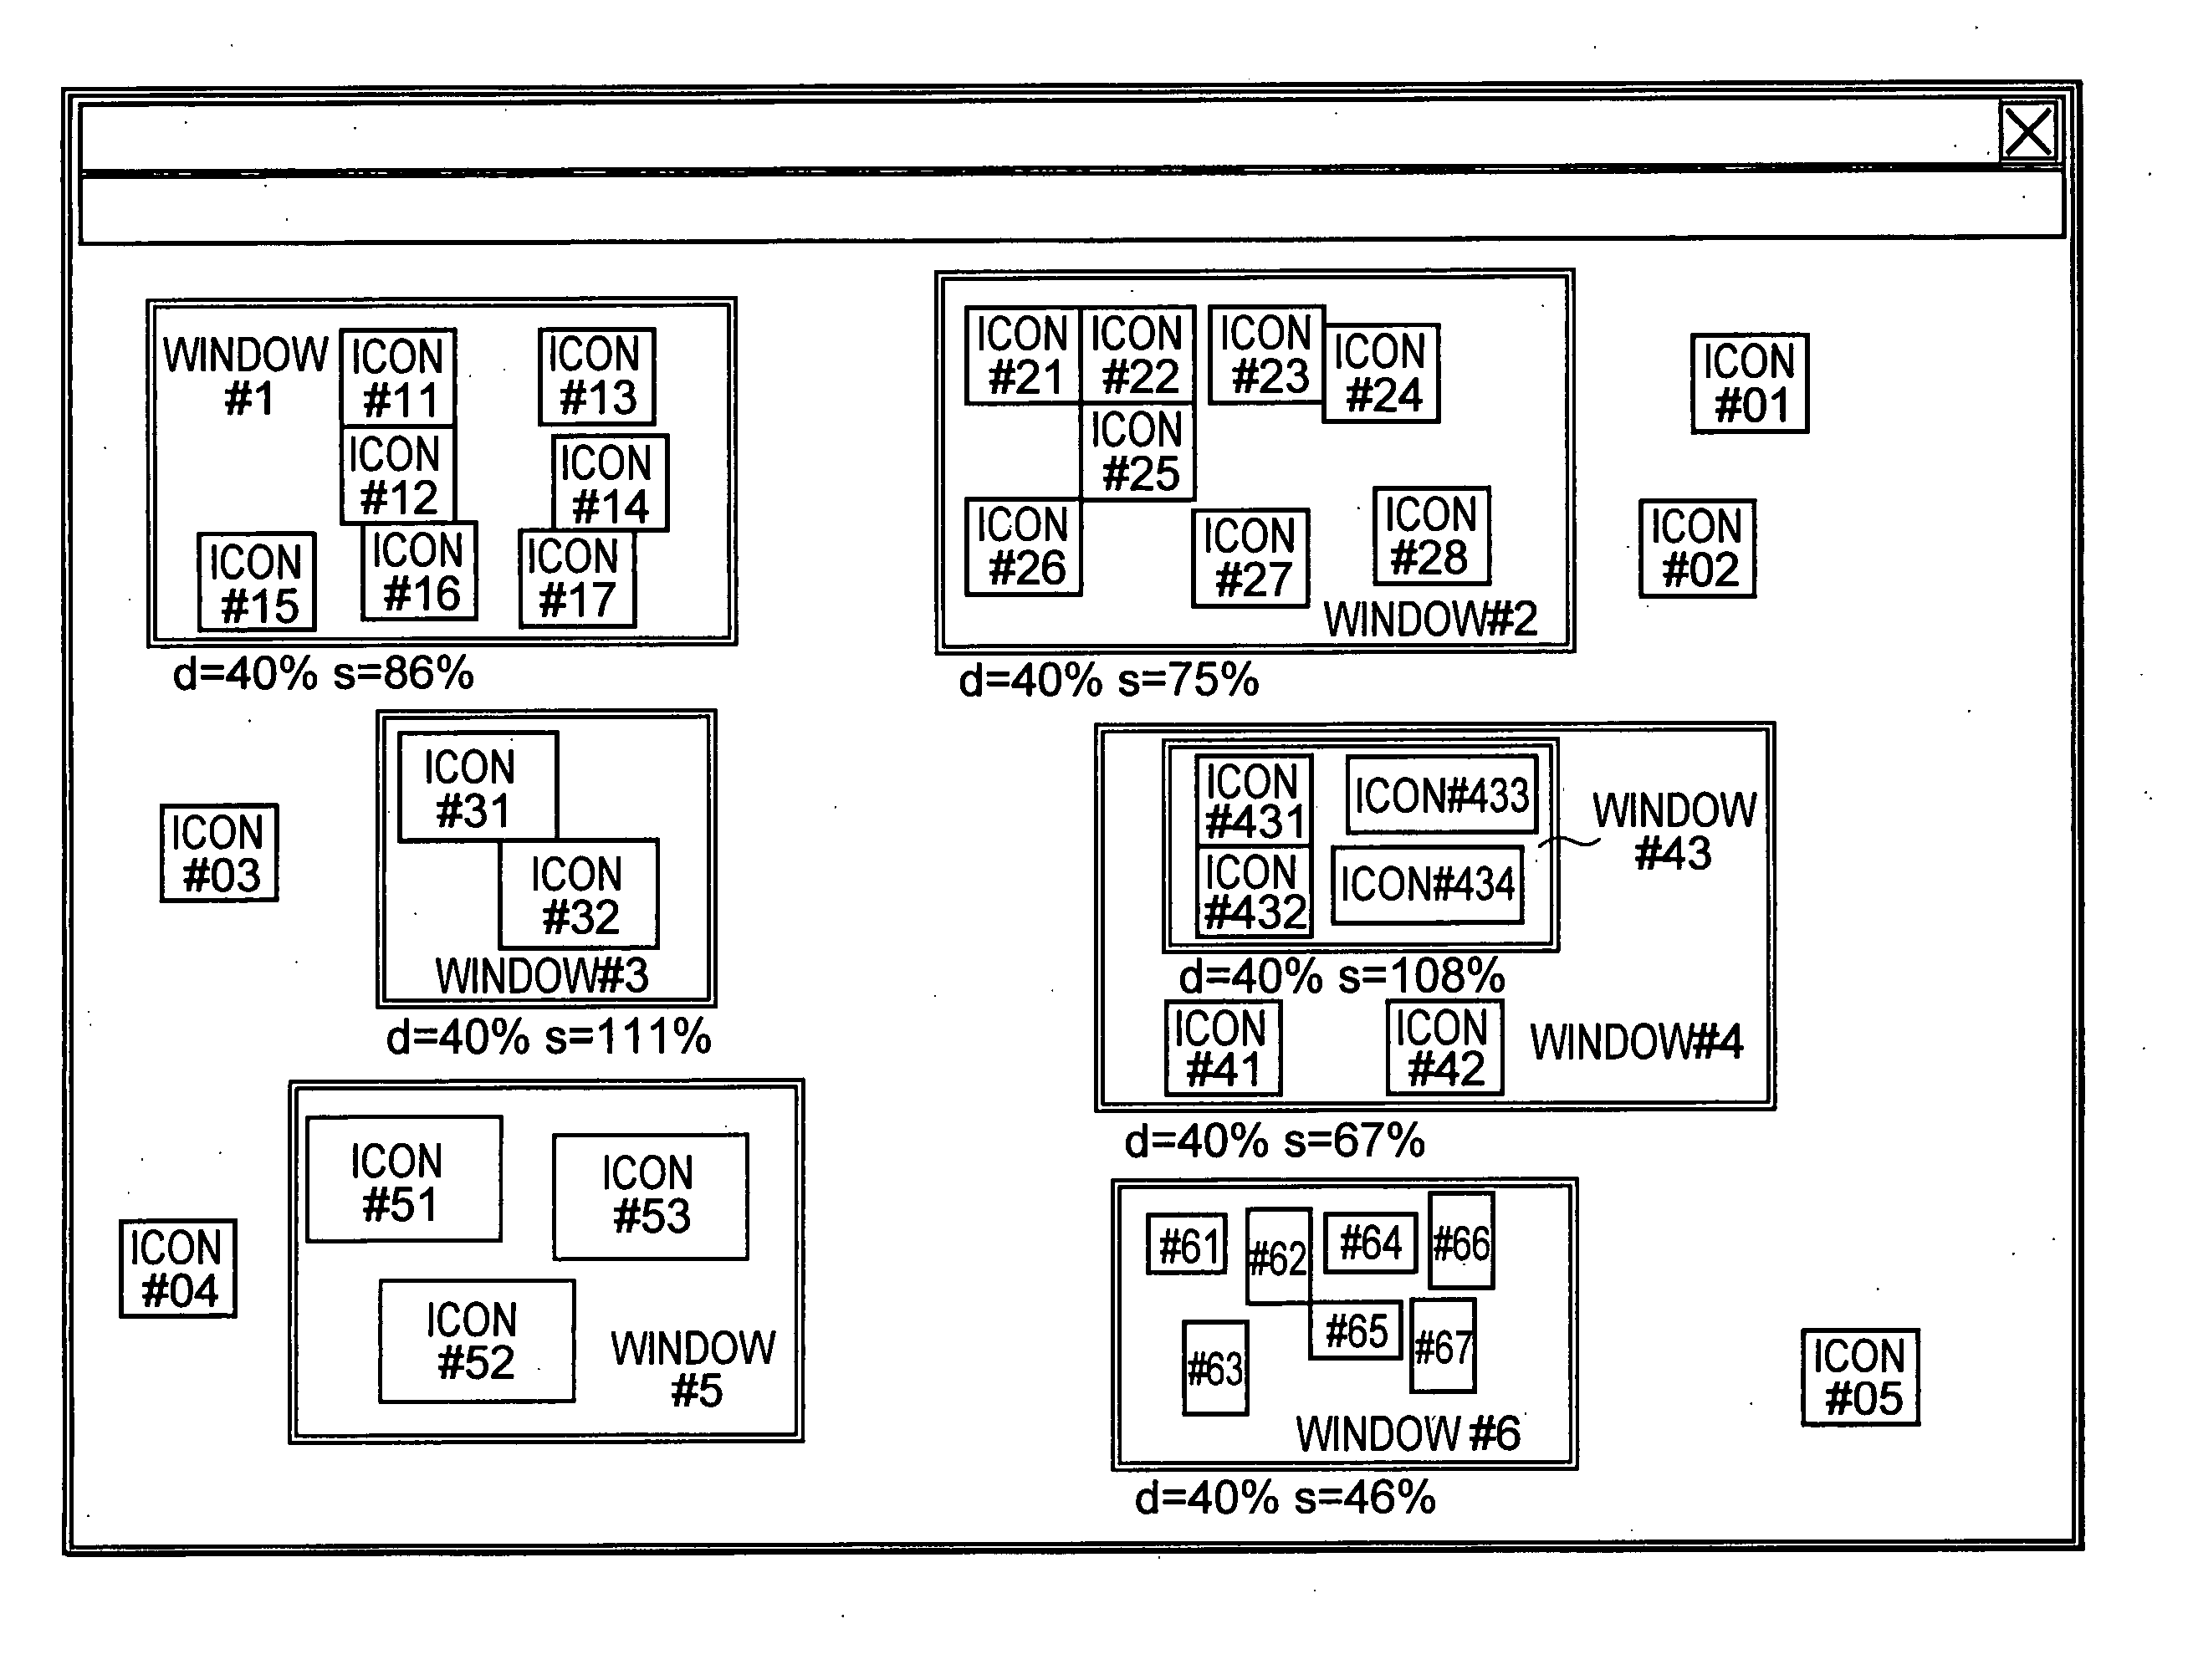
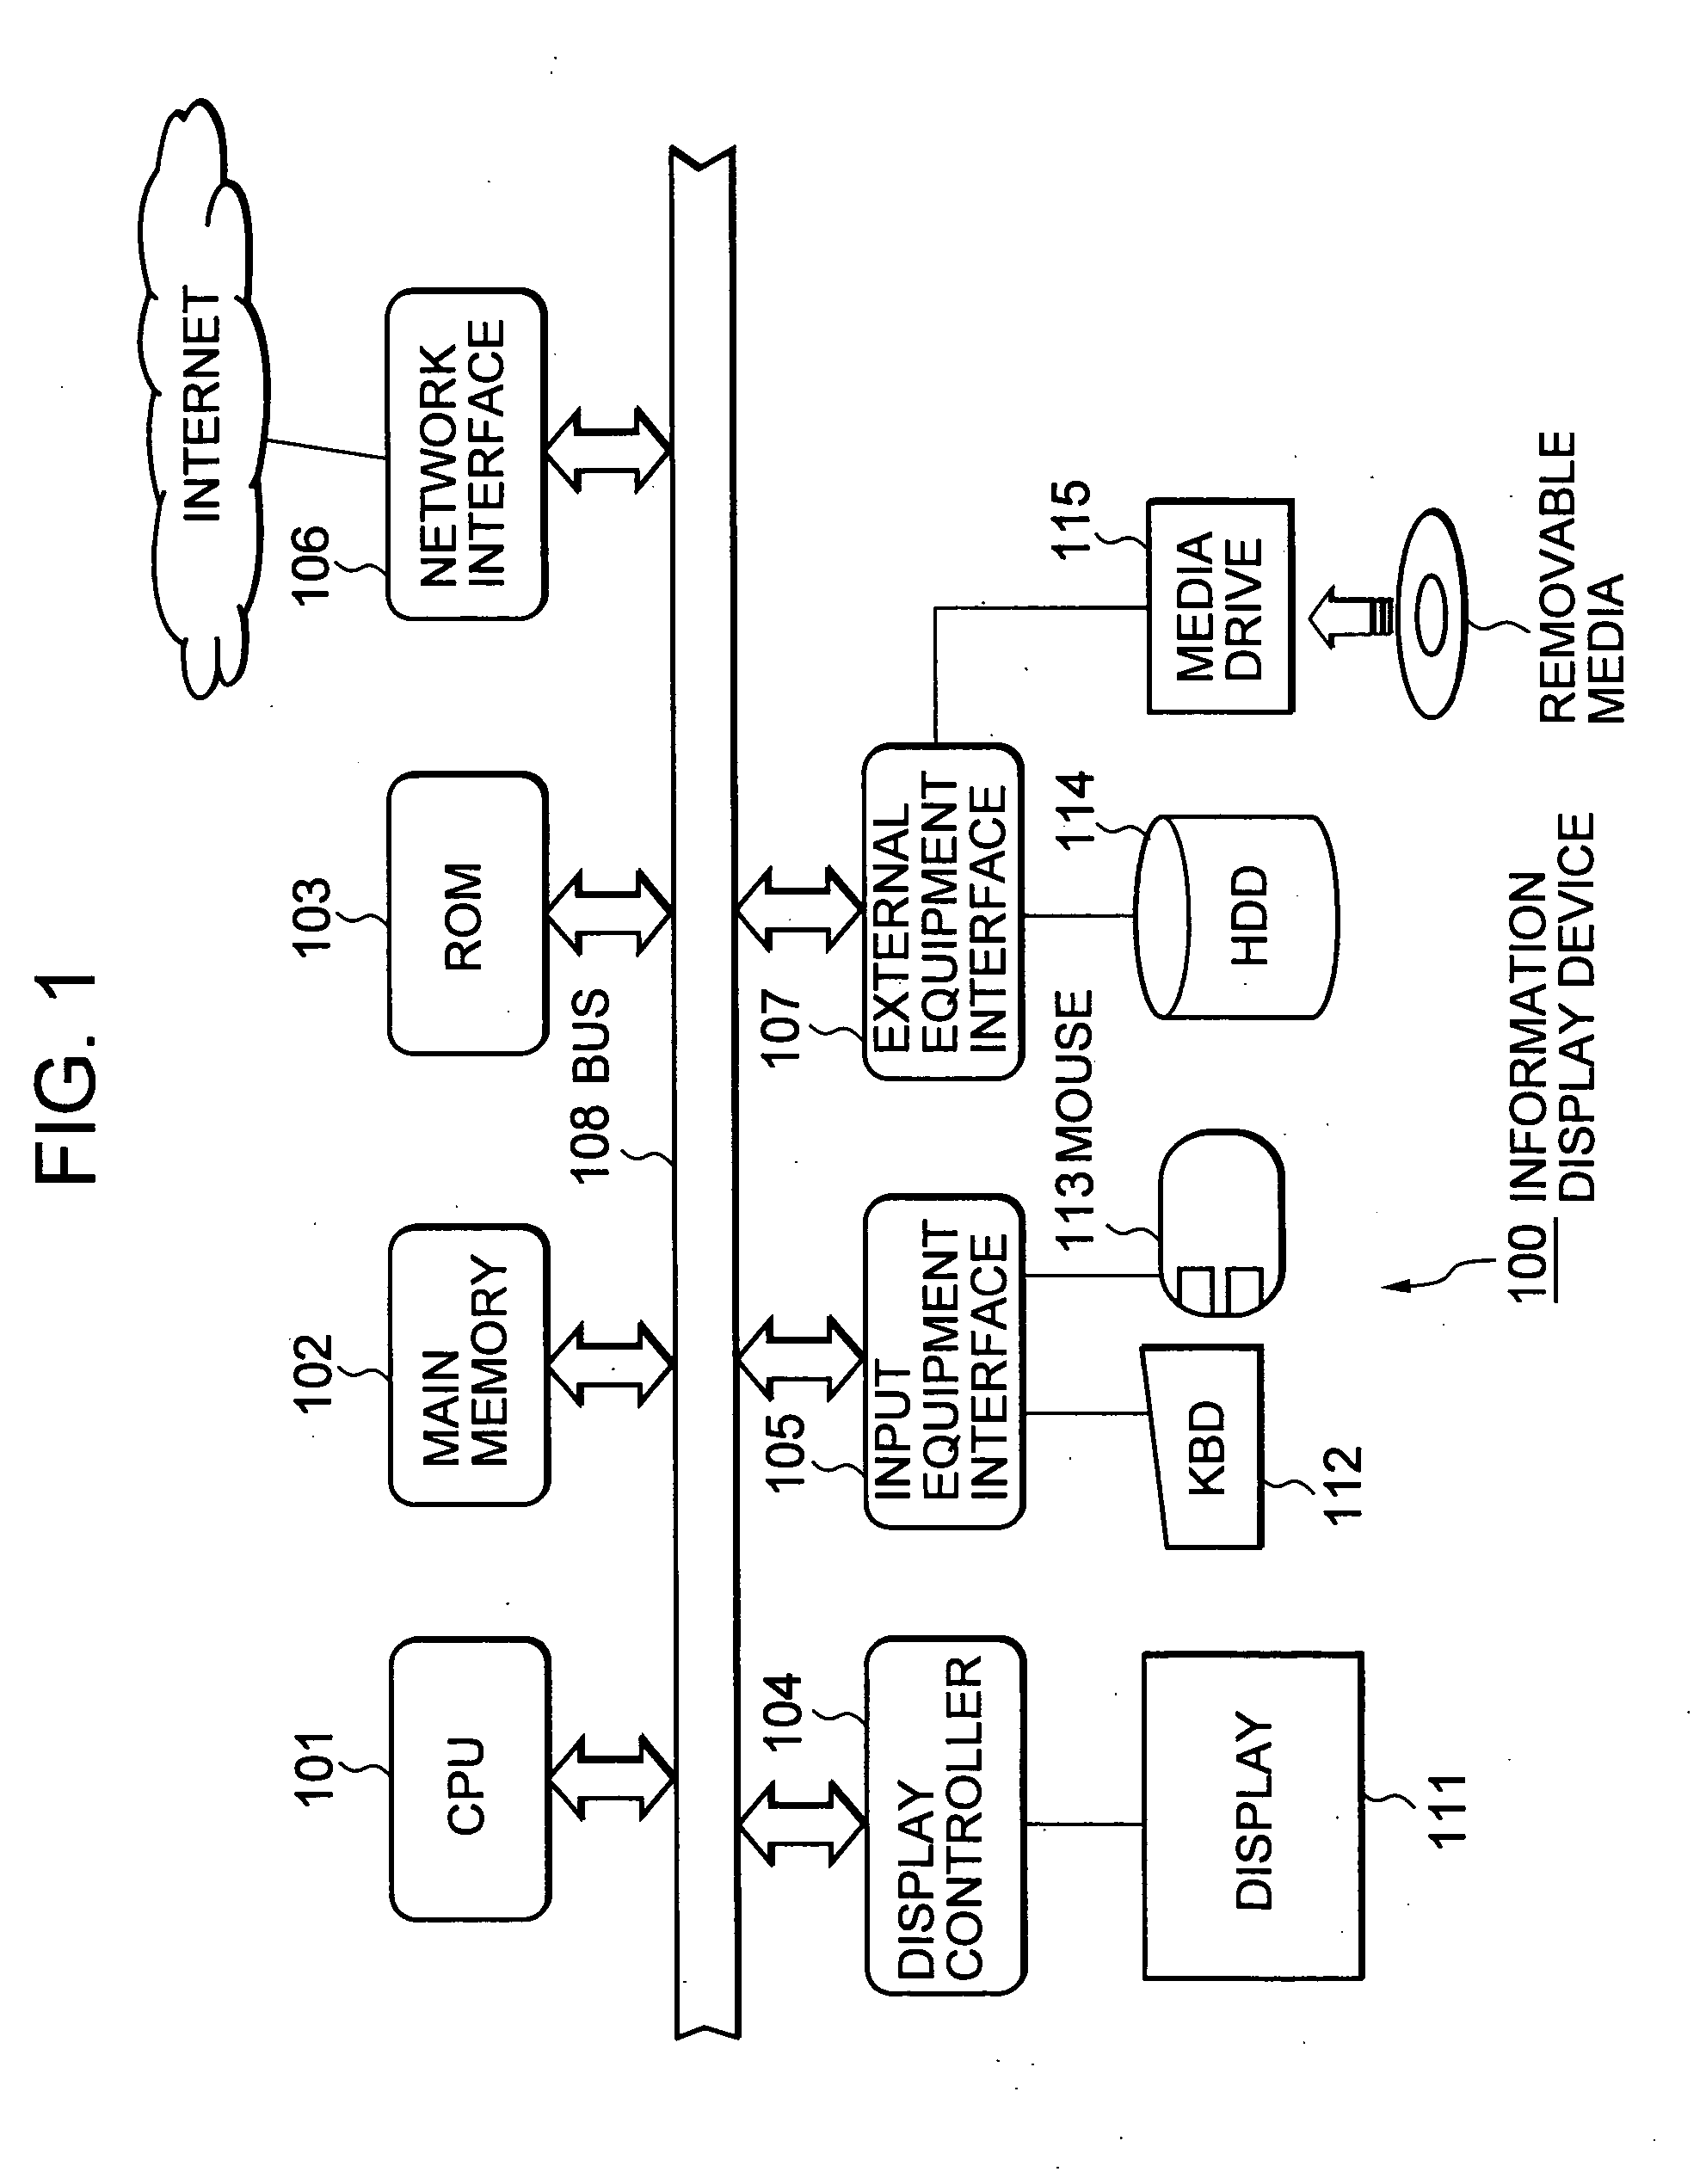
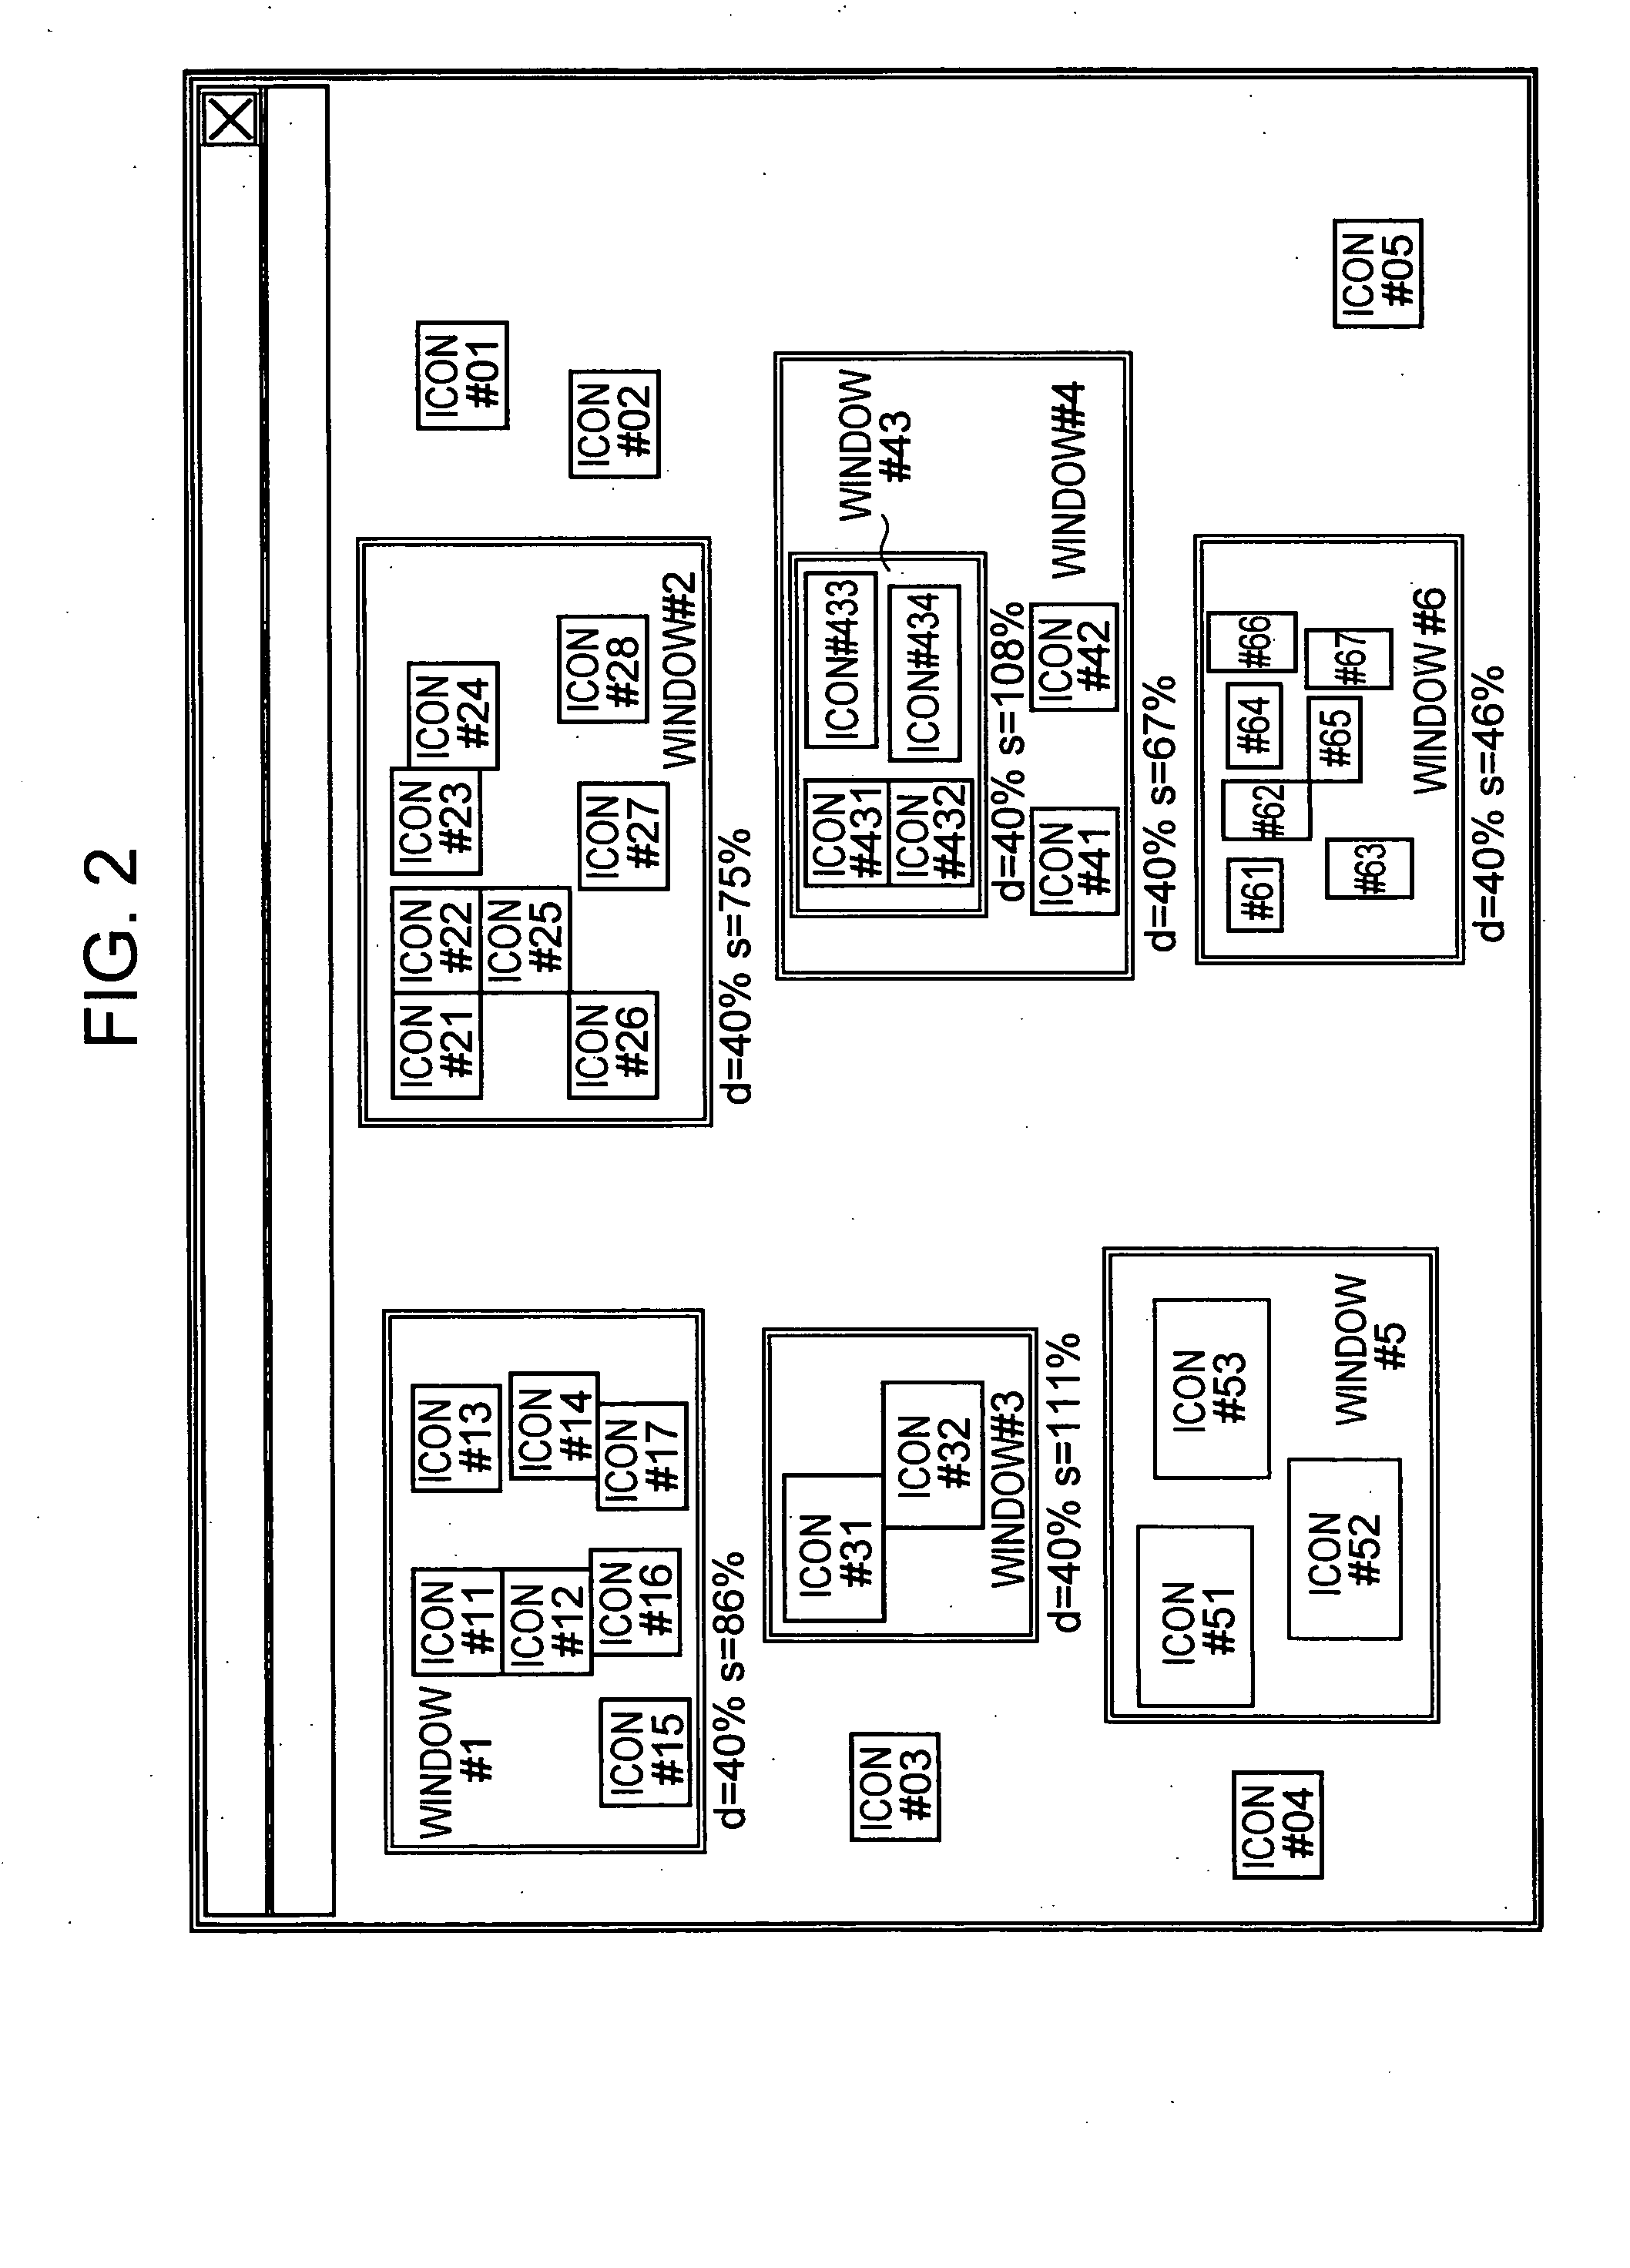
[0068] By displaying all objects such as documents and photographs, etc. managed hierarchically using directories and folders, etc. on a GUI (Graphical User Interface) screen for providing a graphics-based operating environment in a manner which is easy to see, it is anticipated that the information displaying device of the present invention will be still more effective. A hardware configuration for an information displaying device 100 of a first embodiment of the present invention is schematically shown in FIG. 1.
[0069] A CPU (Central Processing Unit) 101 constituting a main controller executes a variety of applications under the control of the operating system (OS). The operating system is equipped with sub-systems including a memory manager for managing a system memory space, a file manager for managing a file space, a resource manager for carrying out system resource management, a window manager for managing window operations in the GUI environment, and so on.
[0070] As shown in FIG. 2, the CPU 101 is mutually connected to other types of equipment (described later) by a bus 108.
[0071] Main memory 102 is a storage device used for loading program code to be executed by the CPU 101 and for temporarily storing work data during execution of the programs and may be configured from semiconductor memory such as, for example, a DRAM (Dynamic RAM). For example, the operating system and applications may be loaded in the main memory 102 as executed programs.
[0072] A ROM (Read Only Memory) 103 is a semiconductor memory for permanently storing data and is written with POST (Power On Self Test) code, hardware input/output program code (BIOS: Basic Input/Output System), etc.
[0073] A display controller 104 is a dedicated controller for actual processing of drawing commands issued by the CPU 101. Drawing data processed by the display controller 104 is output as images on a display 111 after being written temporarily to, for example, a frame buffer (not shown). The display screen of the display 111 typically has a role of providing feedback to enable a user to visualize input content and processing results, as well as errors and other system messages. The display controller 104 and the display 111 of this embodiment are capable of bitmap displaying and a GUI operating screen can be presented on the display screen.
[0074] An input equipment interface 105 is a device for connecting user input equipment, such as a keyboard 112 or a mouse 113, etc., to the information displaying device 100. The keyboard 112 and the mouse 113 have a role of taking user input such as data and commands into the system. In this embodiment, the mouse 113 is used in order to carry out window and icon operations (opening and closing of windows on the desktop screen, addition of icons to and deletion of icons from a window, and moving of icons between windows) on the desktop screen.
[0075] A network interface 106 is capable of connecting the information displaying device 100 to a local network such as a LAN (Local Area Network) or to a wide-area network such as the Internet in accordance with a prescribed communication protocol such as an Ethernet (registered trademark).
[0076] A plurality of terminals (not shown) are connected to the network in a transparent state so as to construct a distributed computing environment over a network. It is possible to carry out distribution services over the network, such as for software programs and data content. It is then possible, for example, to download programs such as operating systems, applications, modules constituting a program, or the like via a network.
[0077] An external equipment interface 107 is a device for connecting external devices such as a hard disk drive (HDD) 114 and a media drive 115 to the information displaying device 100.
[0078] The HDD 114 is an (well-known) external storage device mounted with a fixed magnetic disk as a storage medium and is superior to other external storage devices with respect to storage capacity and data transfer speed. Putting software programs onto the HDD 114 in an executable state is referred to as “installing” the program onto the system. For example, an operating system and application programs executed by the CPU 101 and device drivers for operating each item of peripheral equipment are installed in the HDD 114.
[0079] The media drive 115 is a device for mounting removable media, such as CDs (Compact Discs), MOs (Magneto-Optical discs), and DVDs (Digital Versatile Discs), and for accessing the data recording surfaces of these media. The removable media is mainly used for the purpose of backing up software programs and data files, etc. as computer-readable data and for moving the data between systems (including selling, circulating and distributing). For example, operating systems and application programs, programs such as device drivers and program modules can be circulated and distributed physically between a plurality of items of equipment by utilizing this removable media.
[0080] An example of the information displaying device 100 as shown in FIG. 1 would be an IBM USA personal computer “PC/AT (Personal Computer/Advanced Technology)—compatible computer, or one of its successors. Naturally, it is also possible for computers configured from other architectures to be applied as the information displaying device 100 of this embodiment.
[0081] With the information displaying device 100 of this embodiment, file spaces are managed by hierarchical directory structures, with directories being made to correlate to files and lower order directories. Icons symbolizing files such as computer programs and computer data and icons symbolizing directories comprised of file sets are presented on the desktop screen.
[0082] Further, an operating window is defined for every directory on the desktop screen. Namely, the whole of the desktop screen is allotted to a root directory, and displayed objects of lower order files and directories are displayed on the screen so as to be contained within an operating window frame of the closest upper order directory. User operations with respect to the displayed objects, such as windows and icons are, for example, carried out via a mouse.
[0083] The information displaying device 100 of this embodiment of the invention displays all information on a computer screen in a manner which is easy to understand using hierarchical window displaying. For example, objects are displayed on the computer screen in a manner that is easy to see according to the number of icons within a window, changes in window size, and the number of objects displayed on the desktop screen. The method shown in the following is adopted to this end. [0084] (1) The screen is assumed to have a hierarchical structure for windows. Namely, the entire screen is taken as a root window, with child windows being arranged on the root window. Further, each of the child windows has therein lower order windows. The size of the windows can be changed by the user using a mouse. [0085] (2) The respective windows have their own independent scales. It is not necessary for the user to explicitly specify the scales of all of the windows. [0086] (3) The scales are decided in such a manner that a ratio of the area of the information (icons and lower order windows) displayed within a window and the area of the whole window becomes fixed.
[0087] An example configuration for a desktop screen of the information displaying device 100 of this embodiment is shown in FIG. 2. In the desktop screen of this embodiment, the whole of the desktop screen is allotted to a root directory, and displayed objects of lower order files and directories are contained within an operating window frame of a closest upper order directory.
[0088] The windows in this embodiment can be displayed in a hierarchical manner. In the example shown in FIG. 2, six windows #1 to #6 and five icons #01 to #05 are displayed on the desktop screen. Icons #11 to #17 are contained in window #1, icons #21 to #28 are contained in window #2, icons #31 and #32 are contained in window #3, icons #41 and #42 and a window #43 are contained in window #4, icons #51 to #53 are contained in window #5, and icons #61 to #67 are contained in window #6.
[0089] Each window on the desktop screen possesses an independent scale. However, rather than the user explicitly specifying scales for all of the windows, the window sizes are dynamically decided in such a manner that a percentage of total area occupied by the windows on the desktop does not exceed a fixed value.
[0090] For example, when a new window is added to the desktop screen or the size of a certain window is enlarged as a result of a user operation, or when icons are added to or deleted from a window, the total area of the windows on the desktop screen and the total area of the icons within the windows are recalculated. When the percentage area occupied by the windows on the desktop screen exceeds a fixed value or the percentage area occupied by the icons within the windows exceeds a fixed value, the scale of each window and the scale of the icons displayed within each window is decided in such a manner that this fixed value is no longer exceeded.
[0091] In the example shown in FIG. 2, an icon display scale s of 86% is decided for window #1, an icon display scale s of 75% is decided for window #2, an icon display scale s of 111% is decided for window #3, an icon display scale s of 67% is decided for window #4, an icon display scale s of 141% is decided for window #5, and an icon display scale s of 46% is decided for window #6 based on calculation results for the percentage of area occupied.
[0092] By ensuring that the percentage area occupied on the desktop screen by the total area of the windows does not exceed the fixed value, in hierarchical window displaying, it is possible to ensure browsability of the icon display, and all information can be displayed on the computer screen in a manner that is easy to understand.
[0093] It is therefore possible to ensure browsability when a sufficient margin remains on the desktop screen, i.e., when the percentage of the area occupied by the windows is sufficiently low. It is therefore also possible to not carry out an operation of enlarging the display size of windows even when the number of windows open is small. In this case, the occupancy percentage may only be adjusted within a range where the scale of the windows does not exceed one.
[0094] It is also possible to change the size of a specific operating window according to a change in a weighting possessed by the window, a user operation, or another event. In this case, the total area of a window may be recalculated according to a change in the size of any particular window on the desktop screen, and the size or scale of other windows present on the desktop screen may be adjusted in such a manner that the occupancy percentage with respect to the area of the desktop screen becomes a fixed value or less than the fixed value.
[0095] Further, it is possible to set a margin of a certain extent in the occupancy percentage in such a manner that it is possible to guarantee easy browsability without having to carry out unnecessary processing. Namely, an upper limit value and a lower limit value may be set for the occupancy percentage of the total area of the windows on the desktop screen and it is also possible to provide fixed control to perform recalculating and resetting of the window sizes within this range.
[0096] Alternatively, it is possible to set an upper limit value and a lower limit value for scale so that each window has a size of one.
[0097] Further, it is also possible to cause a repulsion action to occur between windows so as to cause the respective display positions of the windows to move in order to ensure that each of the operating windows does not overlap when new windows are added to the desktop screen.
[0098] Menu items including “KeepAspect”, “Relax”, “Limit”, “TopScale”, “ScaleBub” and designating the occupancy percentage of displayed objects are prepared on a menu bar of the desktop screen of the present embodiment.
[0099] The menu item “KeepAspect” is for designating whether to keep an aspect ratio of the displayed object the same as the original image while performing recalculations and updating the object display when the occupancy percentage of a displayed object on the desktop screen of a window is increased.
[0100] The menu item “Relax” is for designating whether to carry out processing to cause repulsion between displayed objects so as to alleviate overlapping of the objects when the occupancy percentage of the displayed objects on the desktop screen or within a window is increased.
[0101] The menu item “Limit” is for designating whether to provide a limit for scale percentage ratios of windows on the desktop.
[0102] The menu item “TopScale” is a GUI component for designating whether to control the display size of displayed objects including windows, subwindows, frames, icons, thumbnails, and others, of lower hierarchical directories in the operation display region of the uppermost hierarchical layer based on methods of this embodiment. Specifically, in the example shown in FIG. 2, this is a menu item for designating whether to set a scale ratio to the desktop as a whole.
[0103] The menu item “ScaleBub” is for designating whether to show a displayed object at a reduced sized in a hierarchical window when moving a displayed object to a lower order window.
[0104] Designating occupancy percentage of displayed objects is a menu item for designating the occupancy percentage (i.e., density) or an upper limit value for displayed objects such as icons and windows on the desktop screen or within operating regions of the windows. In the example shown in FIG. 2, the occupancy percentage d is designated to be 40%.
[0105] Next, a description is given taking note of one window arranged on the desktop screen. Operations such as adding displayed objects such as icons, moving displayed objects between windows, and deleting displayed objects are possible according to, for example, user operations via a mouse within the windows, so that the number of displayed objects contained in a window can be increased or reduced.
[0106] An operating example for a displayed object within a conventional window is illustrated in FIG. 3. The scale of the icons (=100%) is fixed to remain as is regardless of the total number of icons and occupancy percentage within the windows. As a result, as shown in FIG. 3, as the number of icons increases, the occupancy percentage (density) of the total area of the icons within the window gradually increases so as to appear as 39%, 49%, and 98%. As a result, margins within the windows gradually disappear, the screen size becomes inadequate, and the icons become displayed in an overlapping manner. In other words, screen browsability is impaired.
[0107] On the other hand, an operating example for a displayed object within a window of the present invention is illustrated in FIG. 4. In this embodiment, the icon scale s is adjusted in such a manner that the information density d within the desktop screen and the operating region of the window, i.e., the occupancy percentage of the total area of the icons, becomes 40% (or the upper limit value does not exceed 40%).
[0108] Therefore, as shown in FIG. 4, even if one or more icons are added to a window, to ensure that the occupancy percentage d of the window does not exceed 40%, the scale s of the icons displayed is automatically adjusted to give the appearance of 100% , 90% and 63% so that an appropriate margin is always ensured within a window as a space where operations are possible. Further, this may take place without giving the user an unnatural impression because the scale of the icons changes gradually.
[0109] In this embodiment, the overall area ratio of the operating region and the displayed objects is recalculated every time there is a change (addition, deletion, movement) in the displayed objects, such as icons on operating regions such as the desktop or window frames.
[0110] As a result, the browsability of the displayed objects on the computer screen is ensured. Further, margin regions where there are always no objects displayed can be ensured in operating regions such as the desktop or window frame so as to alleviate the psychological operation load felt by the user in such a case of adding display objects.
[0111] The ensuring of a margin region within a window in the case of adding icons to the window is shown in the example in FIG. 4, but an operation for ensuring fixed margin regions at a movement source and movement destination window can also be carried out when moving icons between windows. Next, a description is given with reference to FIG. 5 to FIG. 7.
[0112] As shown in FIG. 5, a left-side window contains twelve icons and a right-side-window contains three icons. In a case where the occupancy percentage of the total area of icons in a window is set to 40%, the icon scale at the left-side window where the number of icons is large is small at 64%, whereas the scale for icons at the right-side window where there are a few icons is large at 130%.
[0113] Here, assume that just one icon is moved from the left-side window to the right-side window. At this time, as shown in FIG. 6, the icon scale in the left-side window can be raised up to 67% because the information density, i.e., the number of icons, in the left-side window has been reduced. On the other hand, in the right-side window, the scale of the icons has to be reduced to 112% in order to maintain the occupancy percentage at 40% because the information density, i.e., the number of icons, has increased.
[0114] Further, assume that five more icons are moved from the left-side window to the right-side window. At this time, as shown in FIG. 7, the icon scale in the left-side window can be raised up to 93% because the information density, i.e., the number of icons, in the left-side window has been substantially reduced. On the other hand, in the right-side window, the scale of the icons has to be reduced to 73% in order to maintain the occupancy percentage at 40% because the information density, i.e., the number of icons, has been substantially increased.
[0115] A processing procedure for automatically adjusting the scale of icons when adding icons to or deleting icons from a window is shown in FIG. 8 in the form of a flowchart.
[0116] The proportion of area taken up by information such as icons with respect to the entire area of the window is referred to as display density D. In this embodiment, the display density D is provided by the user, and the icon scale s is calculated backward in such a manner that the display density D becomes a fixed value or does not exceed the fixed value.
[0117] A natural area (i.e., the area when the scale is the default value (when setup is omitted)) for an i-th display object, such as an icon displayed in a window, is taken to be Mi. The default value may be set to one but it is also possible to have a configuration where this is changed to 0.9 or 1.1 according to the hierarchical layer containing the display object corresponding to the default value so that the user may be shown a hierarchical structure for the displayed objects in a more natural manner. The scale s utilized in displaying can be calculated from the following equation using the display density D. Here, A is an area of the window as a whole. The equal sign is for a case where the display density D is fixed, and the non-equal sign is for a case where the display density D does not exceed a fixed value. s · ∑ i = 1 n ⁢ M i ≧ D · A Equation ⁢ ⁢ 1
[0118] When an icon is added to or deleted from a window (step S1), a new scale is calculated according to the above equation (step S2).
[0119] Next, the scale of each icon within the window is changed according to the calculated scale S, and the window display is updated (step S3). Processing, such as the arrangement of the icons, is then carried out if deemed necessary (step S4).
[0120] Expressing this in an intuitive manner, automatic adjustment takes place in such a manner that the scale is large when only a few display objects are contained in a window, with the scale being decreased according to the situation as the number of displayed objects is increased. The calculation of the scale is executed every time a display object such as an icon is added to or deleted from a window, with the scale for all of the display objects within the window gradually being decreased as icons are added to the window.
[0121] It is also possible to carry out a process in the processing to arrange the icons in step S4 to ensure that displayed objects such as icons within the window do not overlap with each other. It is possible to apply processing that causes a repulsive force to act between icons so as to cause the display positions of the icons to move in such a manner as to prevent the icons from overlapping.
[0122]FIG. 9 and FIG. 10 show an example where scale calculation and layout calculation processing for displayed objects are combined in order to prevent icons from overlapping with each other.
[0123] Here, a repulsive force for resolving overlapping is defined for all combinations of two display objects. Repulsive forces for all combinations are then added together and the display objects are made to move along repulsive force vectors obtained as a result. The process is repeated until overlapping is alleviated for all of the display objects (or until a defined number of times of repeating is reached).
[0124] The situation directly after adding an icon to a window is shown in FIG. 9. As shown in FIG. 9, the new icon overlaps with other icons. The results of carrying out an adjustment of the display positions of the icons using repulsive force calculations are shown in FIG. 10, and the resolution of the overlapping of the icons shall now be understood in more detail.
[0125] A result of alleviating the overlapping is that the occupancy percentage of the total area of the icons within the window increases slightly.
[0126] With the conventional method of arranging icons shown in FIG. 3, the total area for the icons becomes larger than the area of the window. It is therefore not possible to guarantee that the overlapping of icons will be alleviated even if repulsion force calculations are carried out in a similar manner to that described above. However, with regard to this point, in this embodiment, the occupancy percentage of the total area of the icons in the window shown in FIG. 4 is kept to a fixed value or less. It is therefore possible for overlapping of the icons to be suitably alleviated by applying repulsion force calculations or by applying other icon arrangement algorithms.
[0127] A process for re-calculating the scale with respect to changes in the displayed objects, such as the addition of icons to and the deletion of icons from the window, is shown in the form of pseudo program code in FIG. 11. First, a value “sum” for the total natural (i.e., when the scale is a default value of, for example, 1) area of the displayed objects contained in the window is obtained. Window area A is then calculated.
[0128] Here, when the occupancy percentage of the displayed objects in the window, i.e., the display density D, is defined as a constant, a new scale Snew relating to the displayed objects is given by the sum of the window area A and the display density D divided by the total area sum of the displayed objects. The new scale Snew is then adjusted to fit between a lower limit value Smin and an upper limit value Smax. Namely, when Snew falls below the lower limit value Smin, Snew is substituted with Smin. Further, when Snew rises above the upper limit value Smax, Snew is substituted with Smax. When an upper limit value and a lower limit value are not set for the scale, then calculations may be performed taking Smin=0 and Smax=∞.
[0129] Further, in a case where the display density D of displayed objects in a window is defined as a lower limit value Dmin and an upper limit value Dmax which are allowable, first, a display density Dnew is calculated directly after a change in displayed objects within a window occurs, and a determination is made as to whether the display density Dnew falls between the lower limit value Dmin and the upper limit value Dmax. If the result of this determination is affirmative, the scale of the display objects is not changed.
[0130] On the other hand, if the result of this determination is negative, the scales of the display objects are adjusted, and the display density D is made to fit between the lower limit value Dmin and the upper limit value Dmax, i.e., a prescribed margin is ensured within the window. In this case, two new scales, a new scale Snew1 calculated using the lower limit value Dmin for the display density, and a new scale Snew2 calculated using the upper limit value Dmax, are calculated. If either of Snew1 and Snew2 fall between the lower limit value Smin and the upper limit value Smax, then this is substituted for the new scale Snew. In the case where both Snew1 and Snew2 exceed the maximum limit value Smax, the upper limit value Smax is substituted for the new scale Snew. In the case where Snew1 and Snew2 both fall below the minimum limit value Smin, the lower limit value Smin is substituted for the new scale Snew.
[0131] The scale handled up to this point is the area ratio, and this is converted to a square root in order to reduce a dimension ratio.
[0132] Next, the display positions of the displayed objects are moved for all of the displayed objects Ci in the window, so that Ci objects fit within the window frame.
[0133] Finally, calculations are executed to alleviate overlapping of displayed objects within the window.
[0134] A process for alleviating overlapping of displayed objects within a window is shown in the form of pseudo program code in FIG. 12. A repulsive force for resolving overlapping is defined for all combinations of two display objects. Repulsive forces for all combinations are then added together and the displayed objects are made to move along repulsive force vectors obtained as a result. The process is repeated until overlapping is alleviated for all of the displayed objects (or until a defined number of times of repeating is reached).
[0135] An example of a data structure used in order to carry out display processing for the windows and icons described above at a desktop screen is shown in FIG. 13.
[0136] As described above, the whole of a desktop screen is allotted to a root directory, and display objects of lower order files and directories are made to correlate with the closest upper order directory.
[0137] As shown in FIG. 13, control programs are prepared for each display object such as windows and icons on a desktop screen.
[0138] A control block relating to a window maintains the relative position (X, Y) from a new window, the size of the window (W, H), the scales S applied to objects displayed within the window, and references to lower order windows and icons. References to lower order objects may be maintained in either a pointer format or an array format.
[0139] Further, a control block relating to an icon may maintain the relative position (X, Y) from a new window, the size (W, H) of the icon, and display data for the icon itself, such as bitmap data.
[0140] Supplement
[0141] In the above, a detailed description is given of the present invention while referring to a specific preferred embodiment. However, it is evident that various modifications and substitutions may be made to the preferred embodiment by one skilled in the art without deviating from the scope of the present invention.
[0142] The present invention displays display objects, such as windows, icons, and thumbnail images, on a GUI-based desktop-screen dynamically in a manner that is easy to see according to screen operations such as changing the size, or adding and deleting displayed objects. The present invention may be applied to various GUI environments such as Macintosh® from Apple Computer, Inc., Windows® from Microsoft Corporation, Unix®, and the X-windows operating systems.
[0143] Further, a description is given in this specification centered on a GUI structure mainly configured from windows and icons, but the essence of the present invention is by no means limited in this respect. The present invention may also be applied to various other items taken as display regions other than windows, such as, for example, frames, objects embedded with images, applet displays, or part or all of display objects that may be utilized as display regions capable of displaying still smaller display objects within. Further, the present invention may also be applied to various items other than icons taken as display objects, such as, for example, thumbnail images for still images and moving images, GUI components, application windows, still images and moving images where it is possible to display display objects within a display region.
[0144] Moreover, a description is given in this specification mainly centered on the addition, deletion and moving of display objects to and from display regions. However, at least one aspect of the present invention may also be applied to various other user operations that result in changes in the occupancy percentage and packing (density) of displayed objects in a display region. The present invention may also be applied to cases where operations for enlarging/compressing specific objects and operations for changing the size of display regions are carried out as user operations, such as with a Zooming Interface.
[0145] Further, in the present specification a description is given of an example of use where all displayed objects are scaled uniformly, but the essence of the present invention is by no means limited in this respect. For example, display control is also possible where the effective scale is changed for displayed objects to which appropriate scales and weightings have been assigned according to the priority of each of the displayed objects.
[0146] Although not referred to in the above embodiments, it is possible to provide a lower limit for the scale so as to limit the reduction of the size of displayed objects so as not to exceed this when the scale falls below a fixed scale. In this case, it is possible to add scrolling means such as a slide bar without enlarging the size of the display region or the apparent size of the display region and then carry out substitution processing such as enlarging the substantial size of the display region. With this configuration, the present invention can be considered to be effective in applications demanding visibility of displayed objects, such as, for example, electronic photograph albums, and thumbnail image displays for software.
[0147] Although the invention herein has been described with reference to particular embodiments, it is to be understood that these embodiments are merely illustrative of the principles and applications of the present invention. It is therefore to be understood that numerous modifications may be made to the illustrative embodiments and that other arrangements may be devised without departing from the spirit and scope of the present invention as defined by the appended claims.

PUM

no PUM

Description & Claims & Application Information

We can also present the details of the Description, Claims and Application information to help users get a comprehensive understanding of the technical details of the patent, such as background art, summary of invention, brief description of drawings, description of embodiments, and other original content. On the other hand, users can also determine the specific scope of protection of the technology through the list of claims; as well as understand the changes in the life cycle of the technology with the presentation of the patent timeline. Login to view more.

Similar technology patents

Shower head having an overpressure valve

ActiveUS20190224696A1Easy to handleEasily seeBathsDouchesOverpressureEngineering
Owner:HANS GROHE GMBH & CO KG

Parcel storage box

Owner:PARCERT LTD

Classification and recommendation of technical efficacy words

  • Easily see
  • Easily understood

Device, Method and System for Facilitating a Transaction

InactiveUS20110153398A1Easily seeIncrease likelihoodCapsClosure capsTransaction processing systemMobile phone
Owner:LID POWER

Football teaching system and method

InactiveUS20070099730A1Easily seeEasily explain and visually understood and demonstrateCosmonautic condition simulationsSpace saving gamesEngineeringBall soccer
Owner:DRIVER KENO D

Selective writing assessment with tutoring

ActiveUS20070238084A1Easily understoodElectrical appliancesTeaching apparatusAssessment evaluationSoftware engine
Owner:VANTAGE TECH KNOWLEDGE ASSESSMENT
Why Eureka
Try Eureka