
Analyzing software performance data using hierarchical models of software structure

a software structure and hierarchical model technology, applied in the field of software performance profiling, can solve the problems of limiting the methods described above, affecting the user's understanding of application performance in terms of high-level abstractions, and increasing the complexity of current software applications

Inactive Publication Date: 2005-06-16
INTEL CORP
View PDF10 Cites 47 Cited by
  • Summary
  • Abstract
  • Description
  • Claims
  • Application Information

AI Technical Summary

Problems solved by technology

Current software applications are becoming larger and more complex, often consisting of multiple software layers and subsystems.
The increasing complexity of software applications and of the software environments in which they run lead to limitations on the methods described above.
For example, current methods make it very hard for the user to understand application performance in terms of the high-level abstractions, such as applications, subsystems, layers, frameworks, managed runtime environments, operating systems, etc.
Furthermore, current methods provide a challenge for mapping the instance names used by the performance tool to the high-level instances to which they belong.
When an application spans multiple computers (and thus multiple OS and MRTE instances), the number of low-level instances the user needs to deal with to understand performance increases, and understanding performance in terms of high-level abstractions becomes even more problematic.
Current methods also limit interactions and usage flow between or among multiple performance tools.
Without a common framework of high-level abstractions to unify data across multiple tools, these differences in low-level abstractions may make it difficult for the user to correlate profile data from one tool to another, and may make it difficult for tool developers to design effective usage flow chart between tools.
Current methods support comparisons of low-level instances like processes and modules, but comparison of high-level instances like layers and subsystems is generally not possible.
These limitations affect not only the user, but also expert systems (within the optimization tool) that interpret profile data.
This limits the effectiveness of the expert systems in two ways.
First, the expert system may not give advice summarizing the performance of particular layers, subsystems, and components because it has no knowledge of these high-level instances.
Second, knowledge specific to high-level abstractions may not be expressed within the knowledge databases on which the expert systems' advice is based.

Method used


Image

  • Analyzing software performance data using hierarchical models of software structure
  • Analyzing software performance data using hierarchical models of software structure
  • Analyzing software performance data using hierarchical models of software structure

Examples


Embodiment Construction

[0026] Exemplary embodiments of the invention are discussed in detail below. While specific exemplary embodiments are discussed, it should be understood that this is done for illustration purposes only. A person skilled in the relevant art will recognize that other components and configurations may be used without parting from the spirit and scope of the invention.

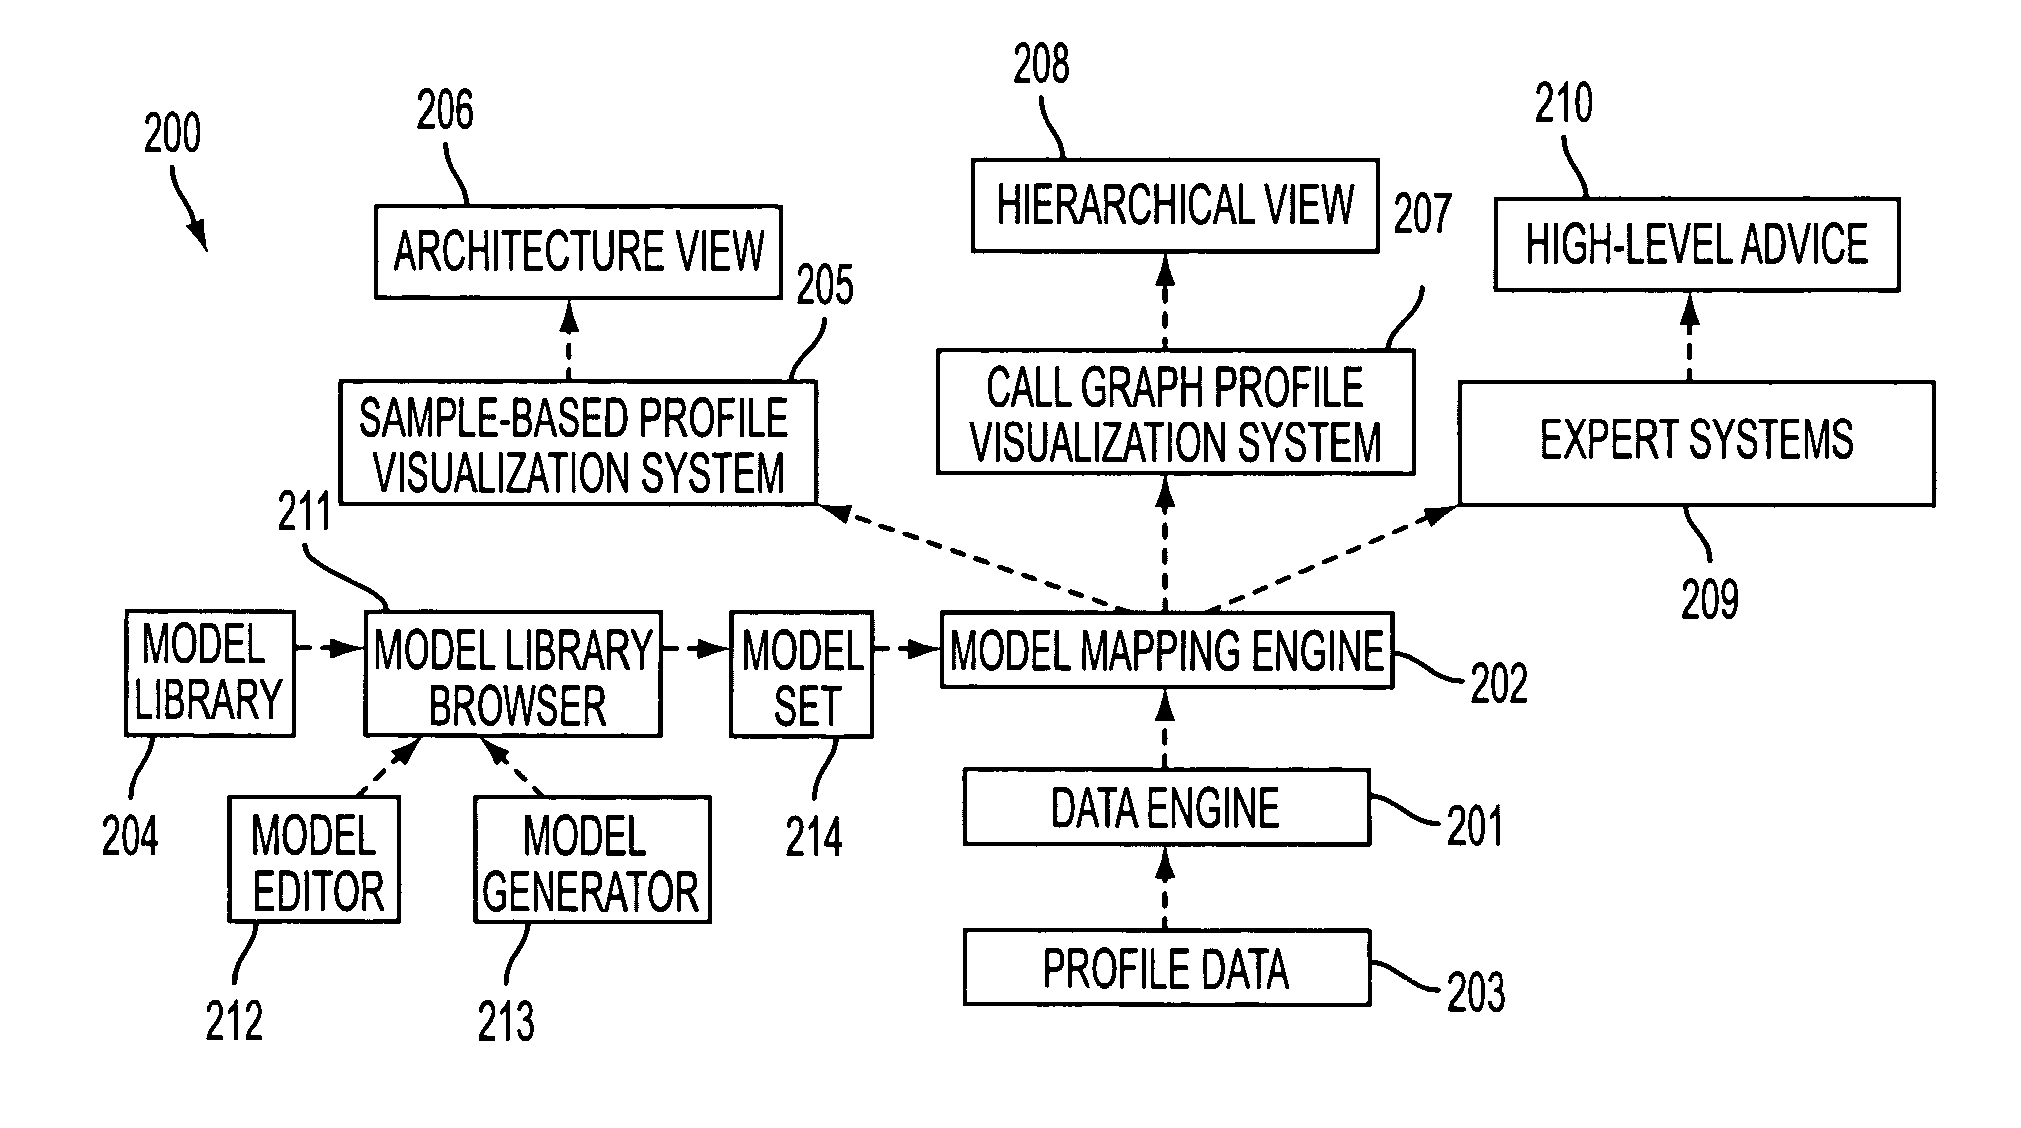
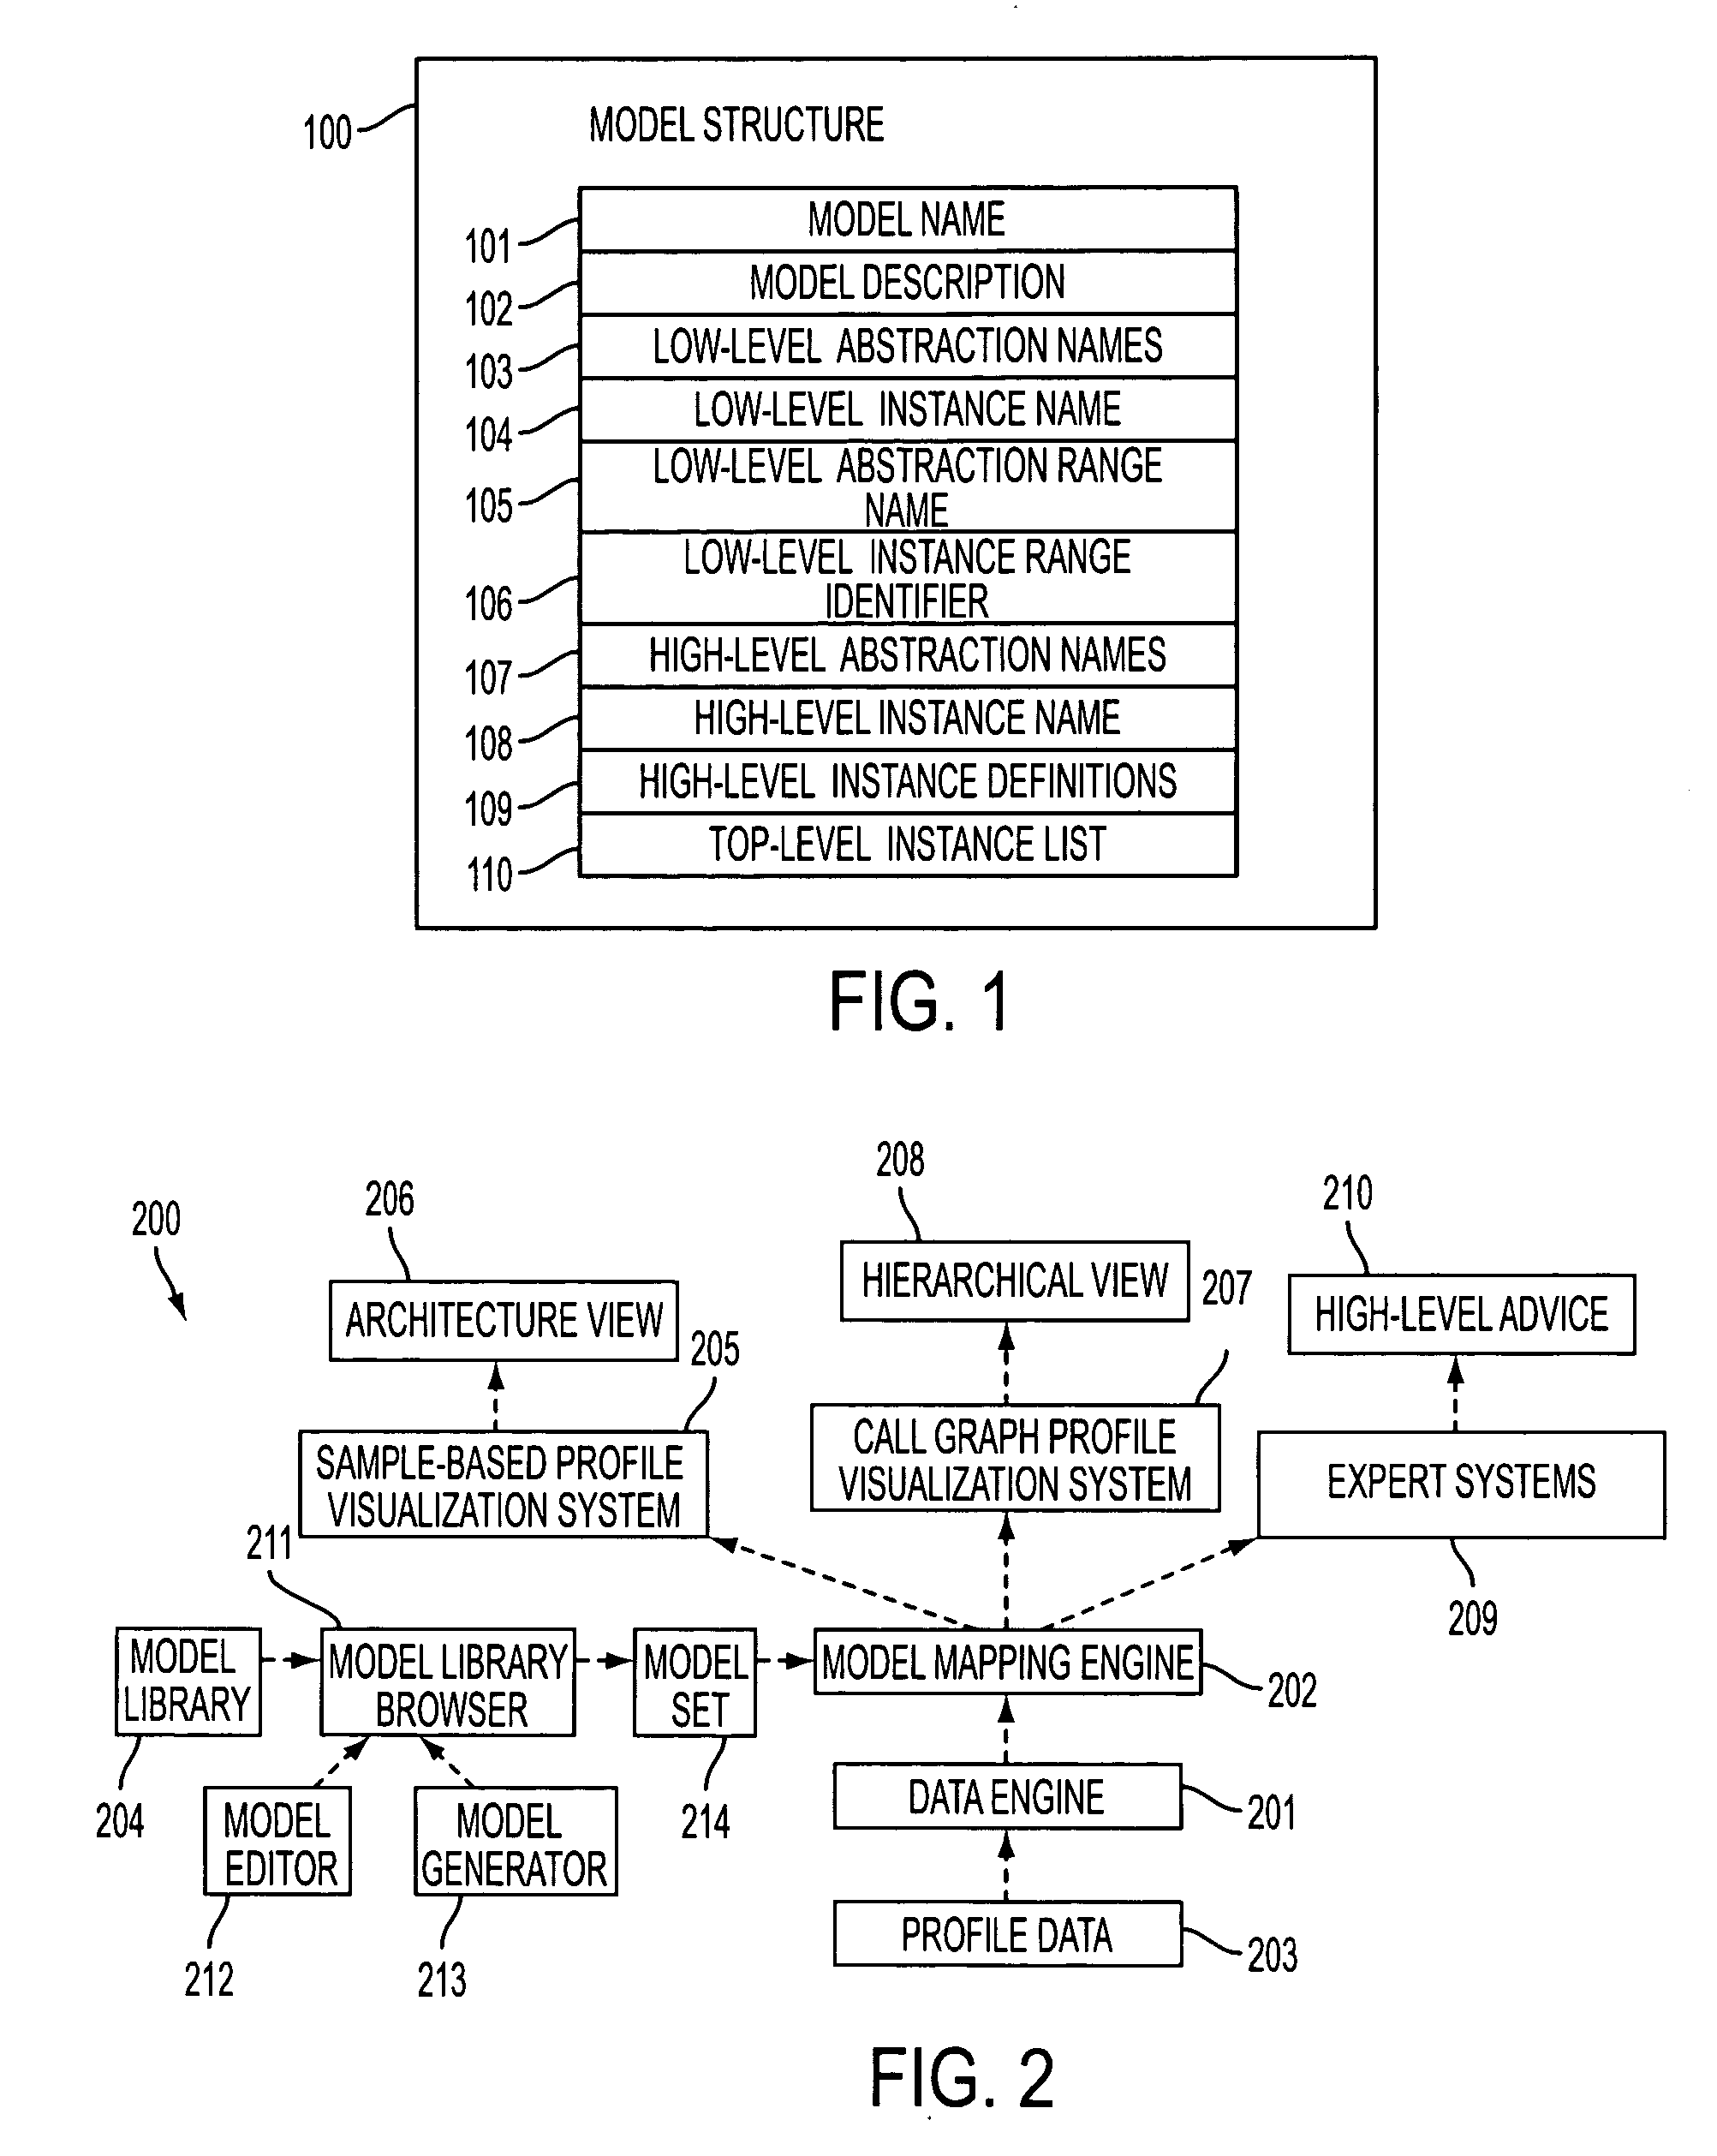
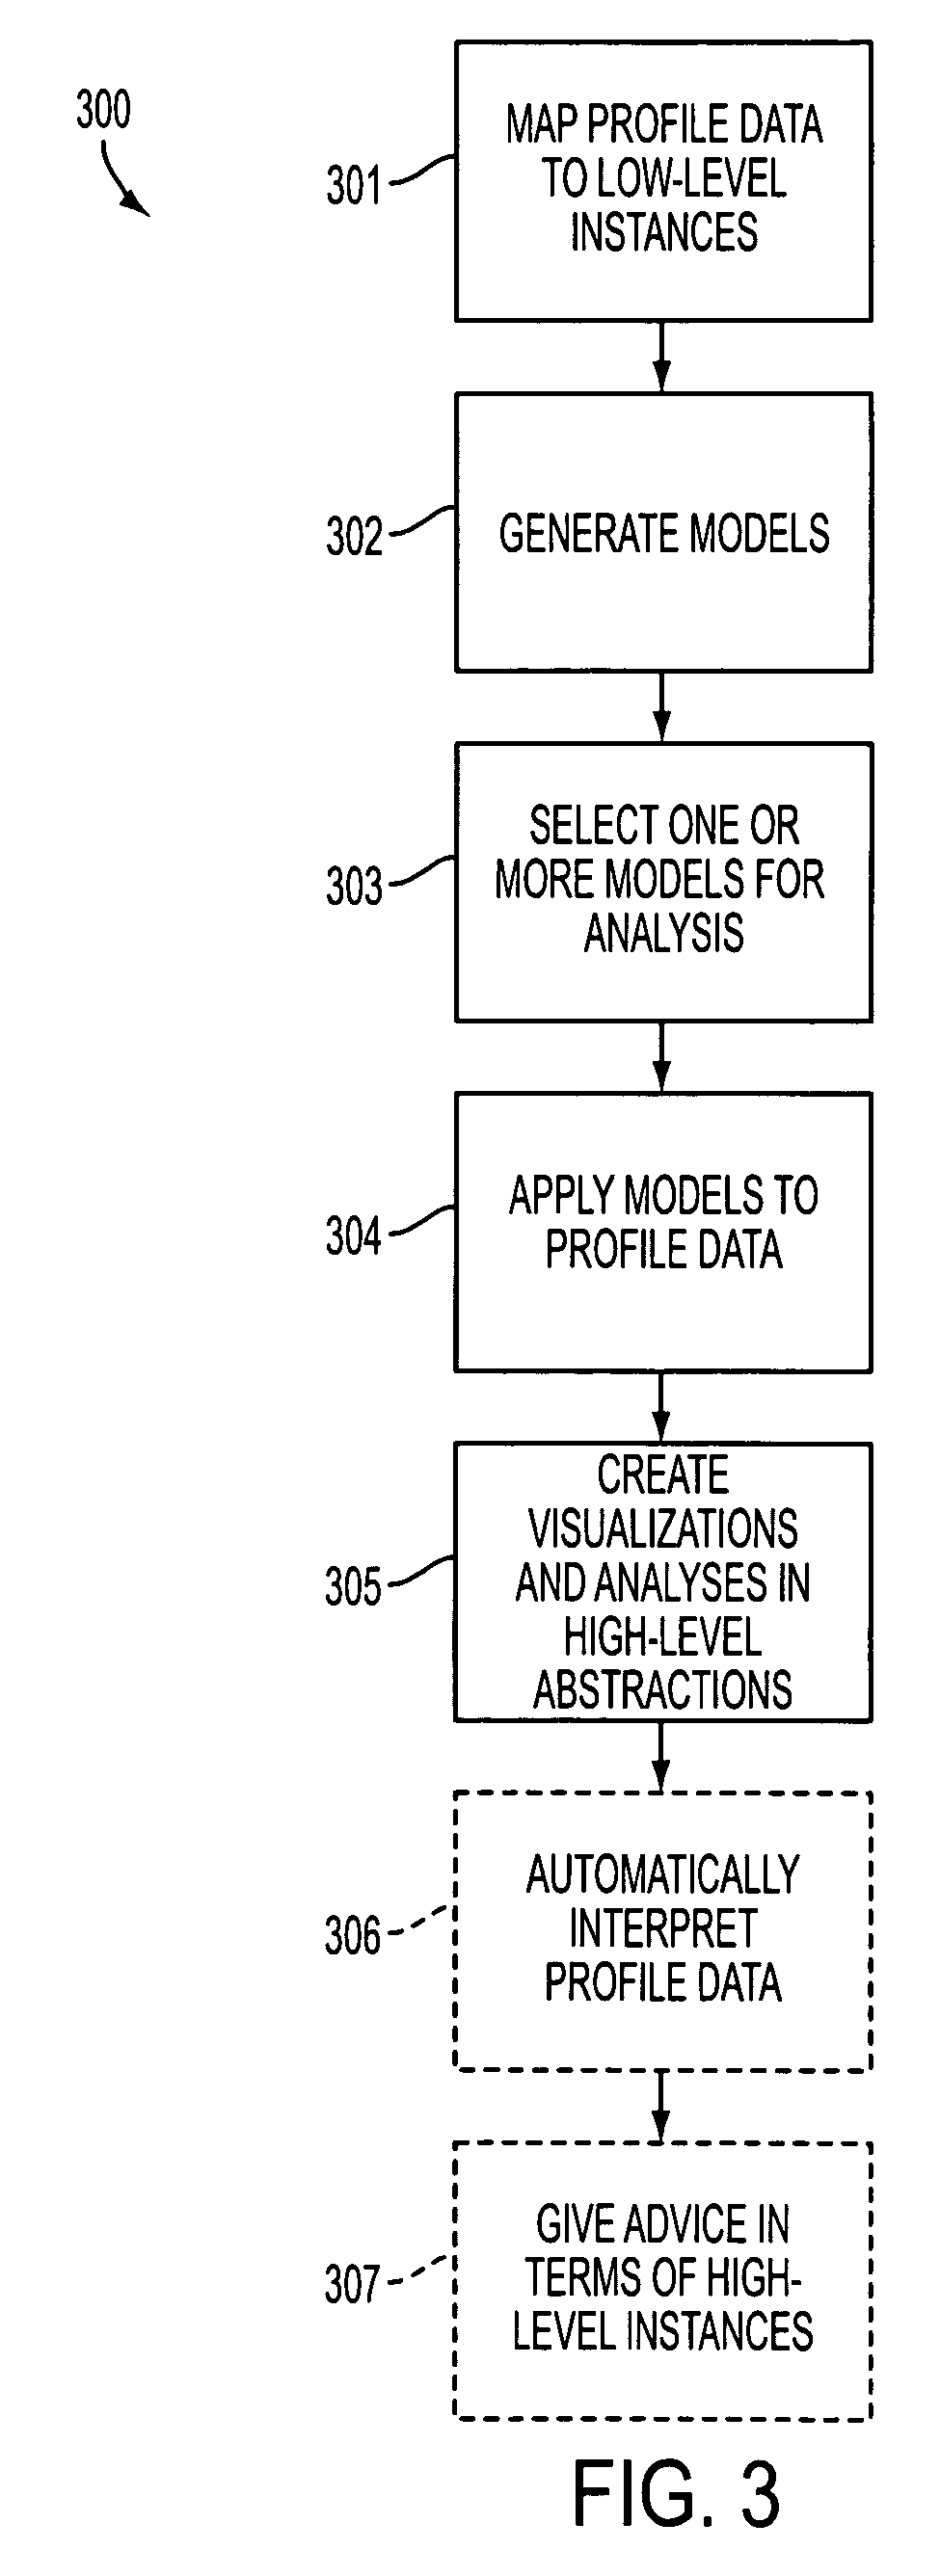
[0027] Exemplary embodiments of the present invention may enable performance tools to analyze profile data in terms of high-level units of abstraction such as, e.g., applications, subsystems, layers, frameworks, managed runtime environments, operating systems, etc. Further, exemplary embodiments of the present invention may provide an improved system and method for mapping profile data to units of abstraction.

[0028] In an exemplary embodiment of the invention, a model structure may be used to define, for example, a set of high-level abstractions, a set of named instances of those abstractions, and a mapping between each ...


PUM


Abstract

Analyzing profile data of a software application in terms of high-level instances of the software application.

Description

BACKGROUND OF THE INVENTION [0001]“Statistical sampling” and “call graph profiling” are software performance profiling methods currently used by software performance optimization tools such as the Intel® VTune™ Performance Analyzer, to enable software developers to identify the parts of a software system to focus on for performance optimization, and to identify the types of software modifications that will improve performance. [0002] Current methods and systems for visualizing and interpreting performance data collected use statistical sampling and call graph profiling. The statistical sampling profiling method may be system-wide—it may measure the impact of all software components running on the system that may affect an application's performance. Statistical sampling has low measurement overhead, and there is no need to modify the application to facilitate the performance measurement. A method commonly used for analyzing statistical samples allows the user to progressively filter ...

Claims


Application Information

Patent Timeline
Patent Type & Authority Applications(United States)
IPC IPC(8): G06F9/44G06F11/30G06F15/00G21C17/00
CPCG06F11/3604
Inventor GOTWALS, JACOB K.SRINIVAS, SURESH
Owner INTEL CORP
Learn More