Method for superimposing statistical information on tabular data

a statistical information and tabular data technology, applied in the field of display of any statistical data, can solve the problems of complicating further automated analysis, more difficult for the reader to quickly interpret the data,

Active Publication Date: 2005-10-27
HYPERFORMIX
View PDF4 Cites 9 Cited by
  • Summary
  • Abstract
  • Description
  • Claims
  • Application Information

AI Technical Summary

Benefits of technology

[0030] It is therefore the primary object of the present invention to provide a method for organizing and compactly displaying a collection of categorized data samples that simultaneously allows for ease of interpretation by the user or analyst and further automated analysis of the tabular data contained therein.
[0031] In this invention, data is organized within a single table because it offers both a compact representation of the data and can be easily interpreted by automated analysis tools such as spreadsheets. For example, to aid the user / analyst in interpreting percentage data within certain data cells, all cells containing percentage data are graphically superimposed with various shades of gray to indicate the relative percentage of samples contained in the data cell within each bucket. This provides the reader with a graphical presentation of the data distribution without requiring additional tabular space.
[0032] The present invention provides columns which identify the category, count, and buckets for the data contained. There is one row for each category and one row for the composite. The composite row can be either the first or last row. The sample count for each bucket is presented as an integer in the corresponding cell. The percentage of samples in each bucket is represented as a level of gray. While it is possible to present both the sample count and percentage as numeric values in a single cell, e.g., “312 (28%)” such an approach makes it more difficult for the reader to quickly interpret the data and greatly complicates further automated analysis.
[0033] Presenting the percentages in gray scale provides a picture of the data that can be quickly interpreted. Using gray scale depiction for percentage information allows the data to be interpreted without requiring a key. Furthermore, it is not subject to misinterpretation due to a user's physical limitations (e.g., color blindness). However, by superimposing gray scale of the cell data is not meant to provide an analyst with exact percentage information but rather a generalized quick reference. Combining the histogram data with the standard statistic measures provides a complete compact view of the data, which is easy to generate and can be viewed by HTML browsers, and also viewed and manipulated in spreadsheets.

Problems solved by technology

While it is possible to present both the sample count and percentage as numeric values in a single cell, e.g., “312 (28%)” such an approach makes it more difficult for the reader to quickly interpret the data and greatly complicates further automated analysis.

Method used


Image

  • Method for superimposing statistical information on tabular data
  • Method for superimposing statistical information on tabular data
  • Method for superimposing statistical information on tabular data

Examples


example 3

Constructing Relative Frequency and Percentage Frequency Tables

[0046] Using the data from Example 2 above, a frequency table can be constructed giving the relative frequency and percentage frequency of each interval of battery life the table would appear similar as that in Table 3.

TABLE 3Life of AA batteries, in minutesFrequencyRelativePercentBattery life, minutes (x)(f)frequencyfrequency360-36920.07 7370-37930.1010380-38950.1717390-39970.2323400-40950.1717410-41940.1313420-42930.1010430-43910.03 3Total30 1.00100 

A user / analyst reviewing and utilizing these data could now say that: [0047] 7% of AA batteries have a life of from 360 minutes up to but less than 370 minutes, and that the probability of any randomly selected AA battery having a life in this range is approximately 0.07.

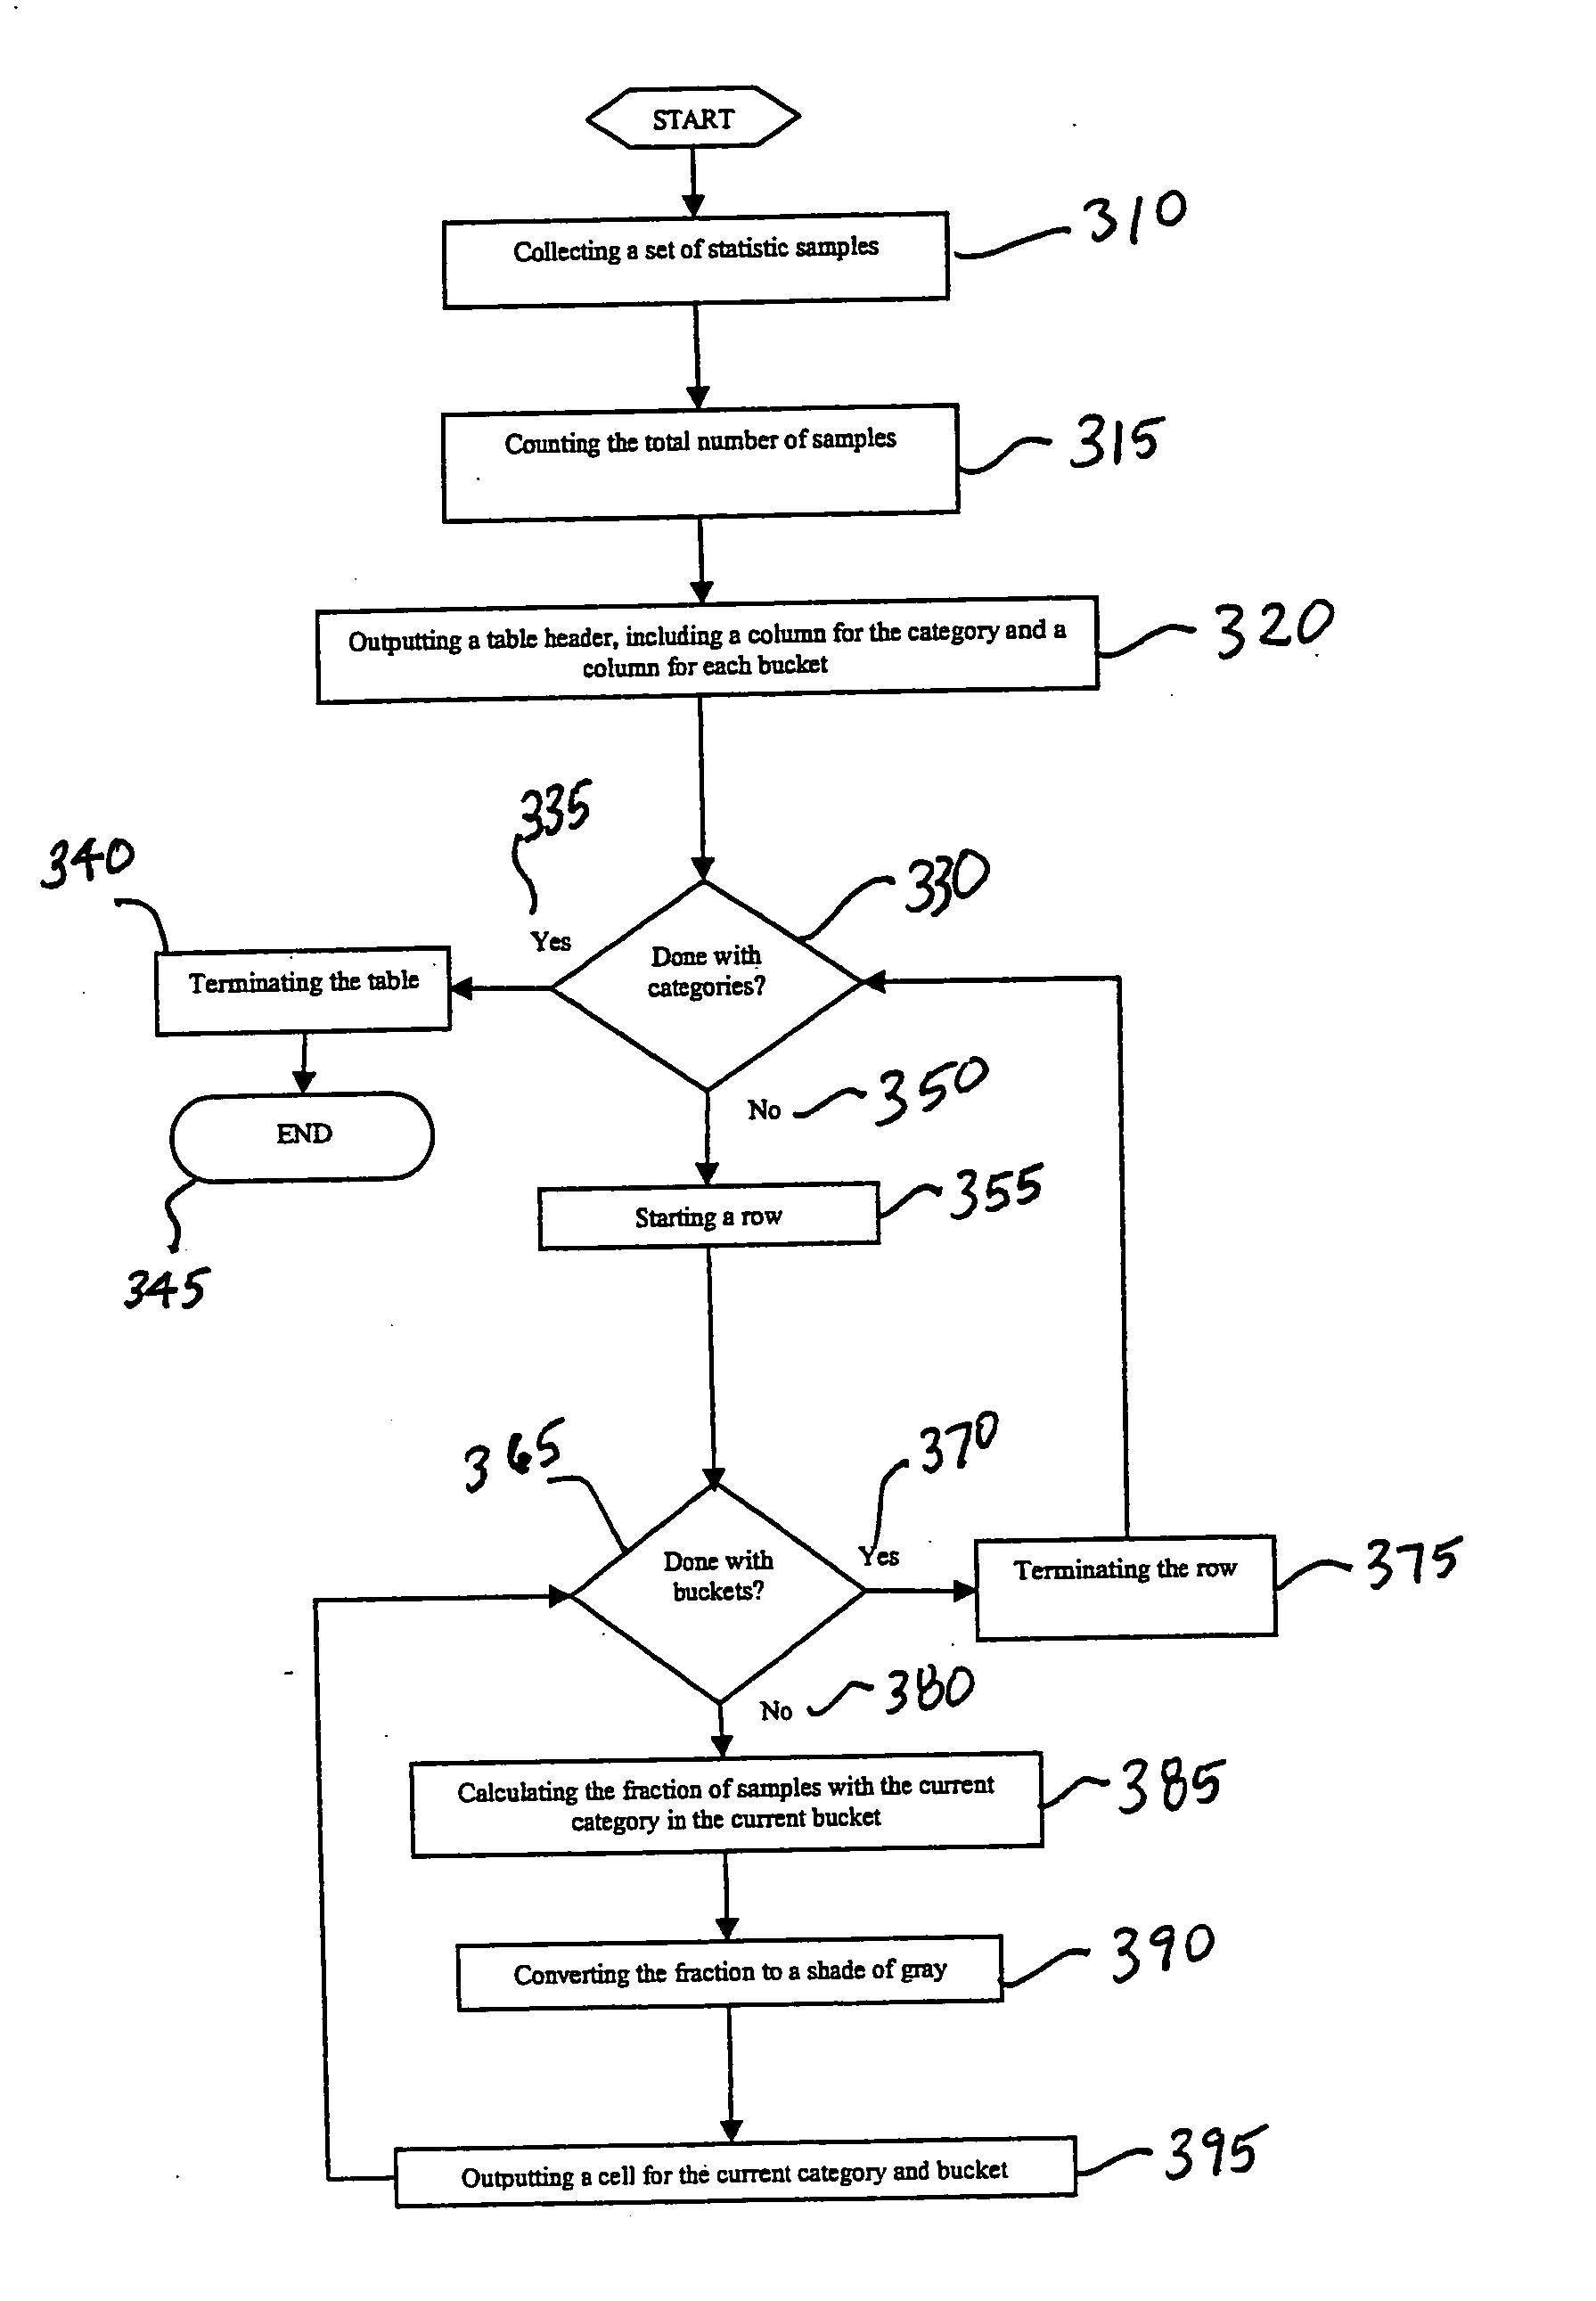
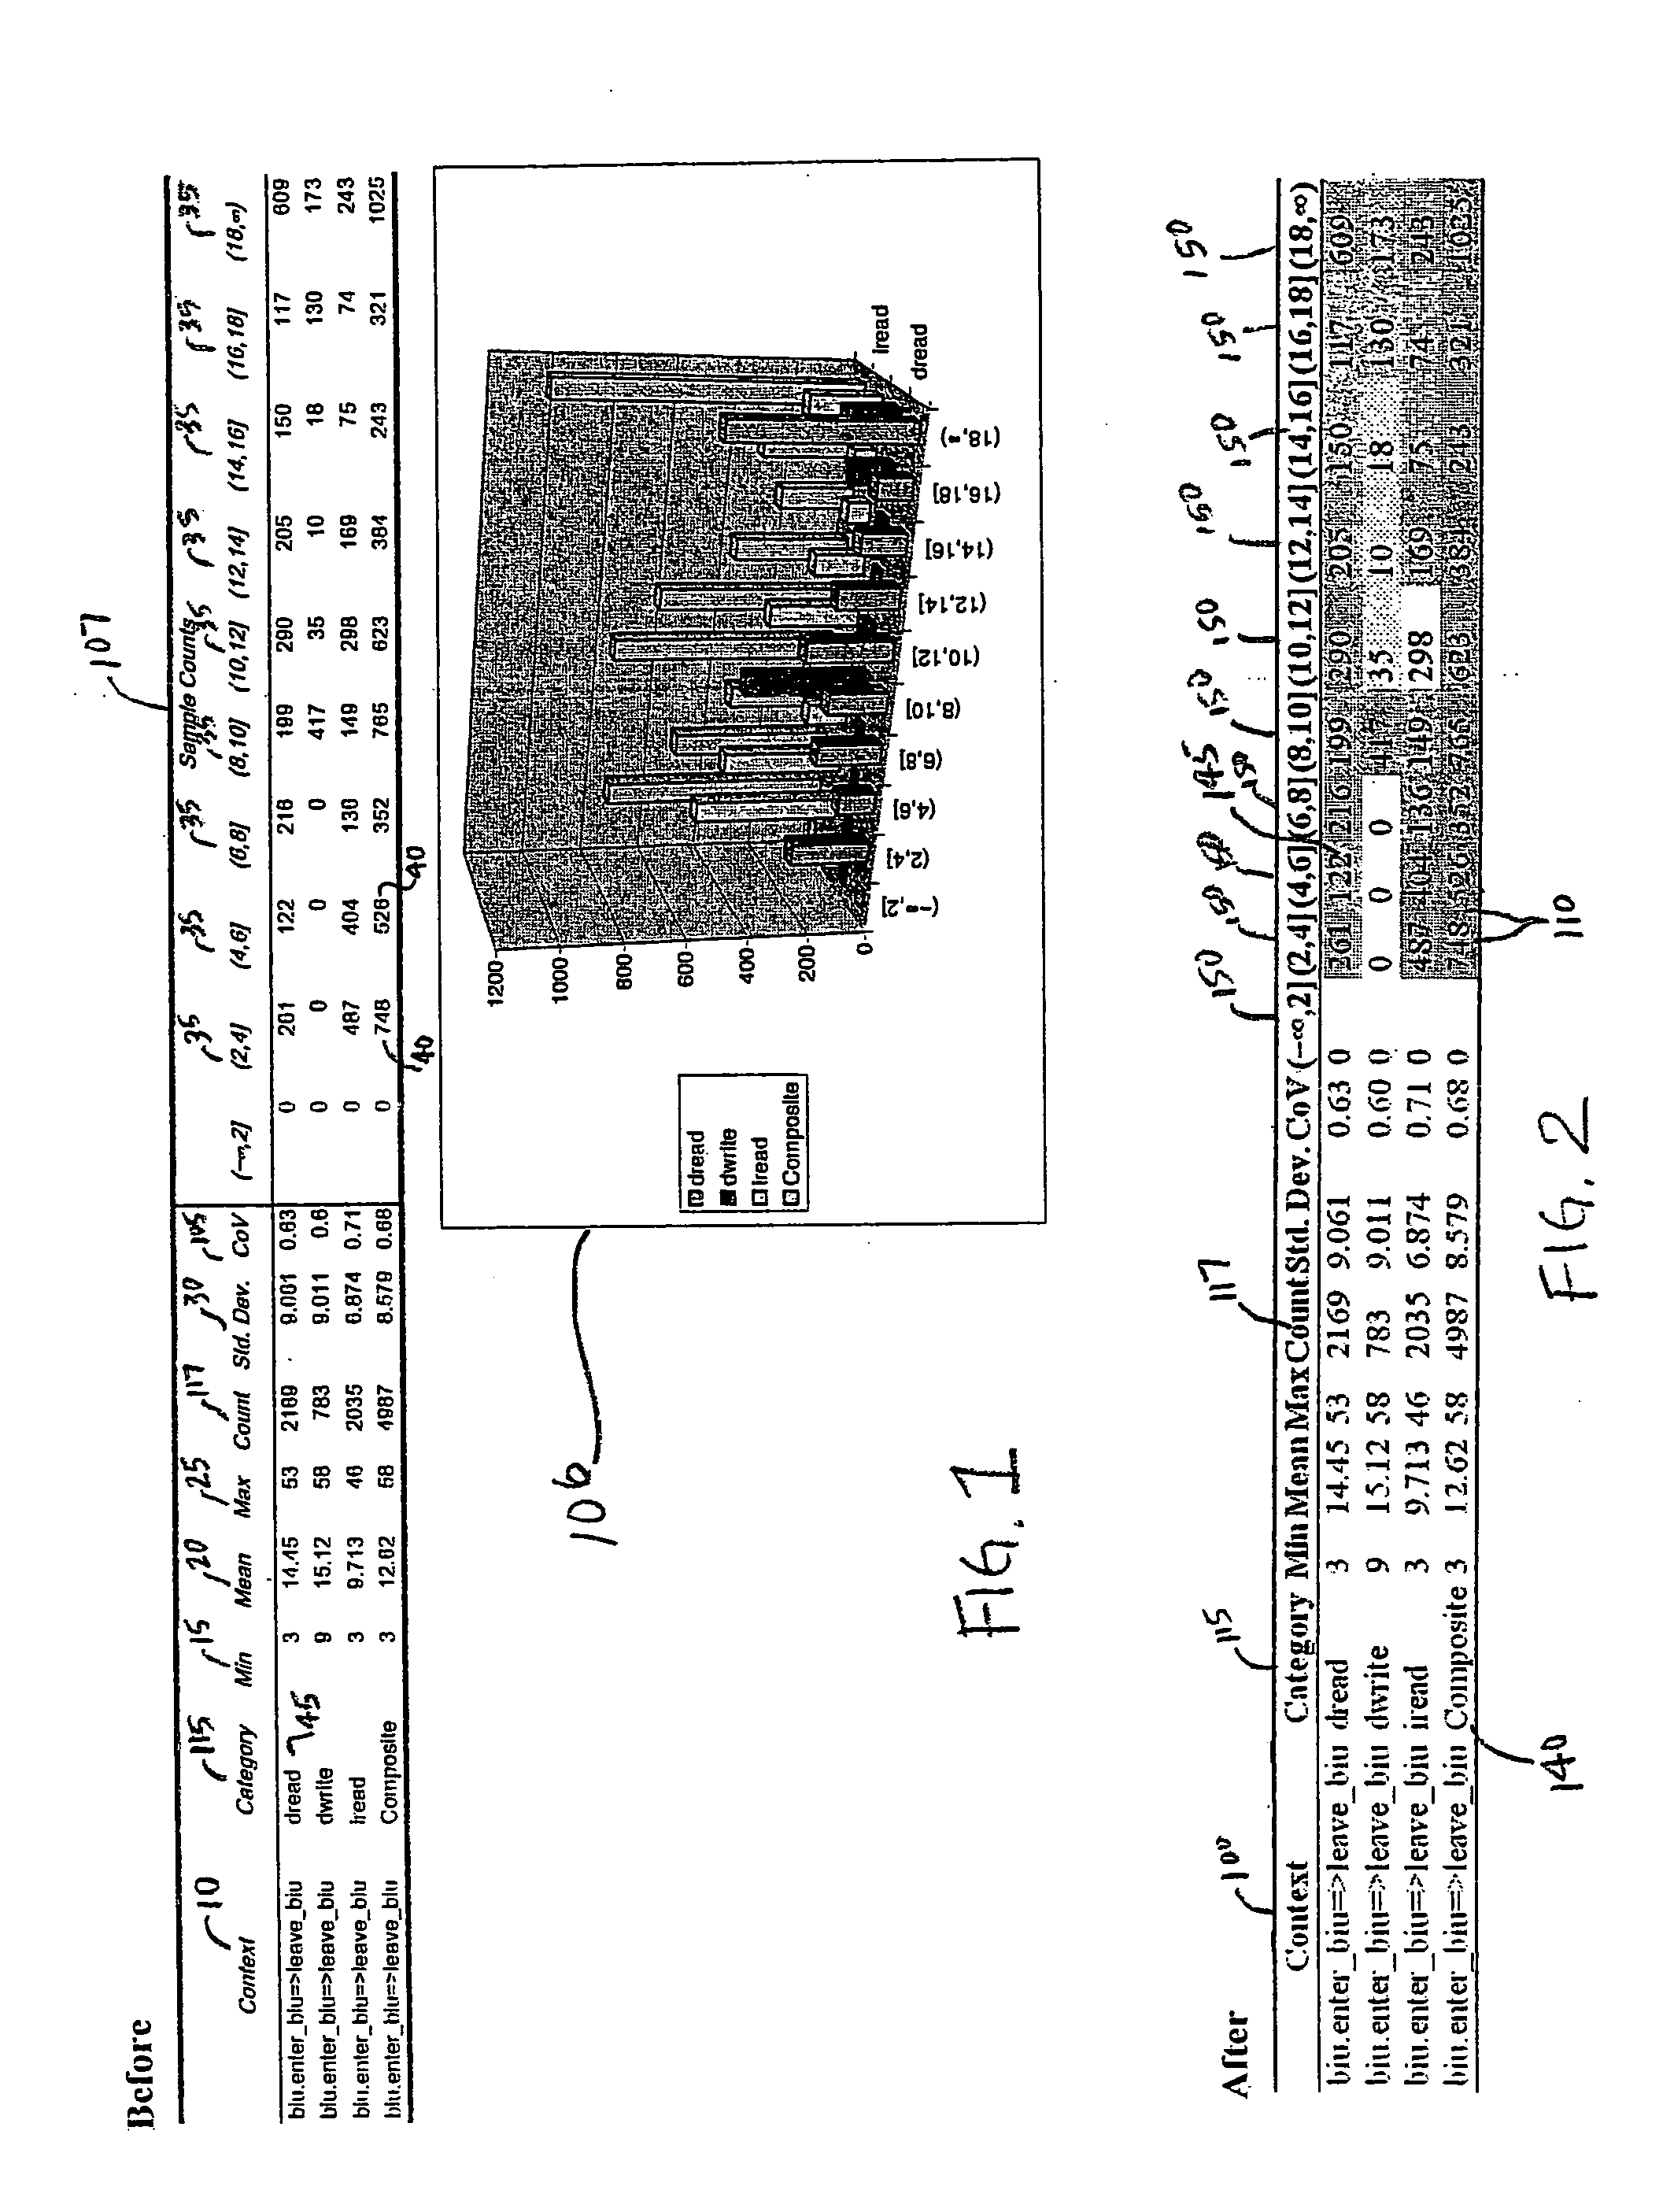
[0048] After data has been collected, the data as presented in Table 3 above can be used by the method of the present invention to compactly and simultaneously display all information using only one ta...


PUM


Abstract

A method is disclosed for displaying a plurality of statistical data usually presented in a histogram, such as sample counts and percentages of a collection of categorized samples, in a compact single table. The method comprises presenting grouped statistical data that exists within a collection of “buckets” and presenting the sample count for the collected data as an integer in a corresponding cell in the table. Additionally, as disclosed by the present invention, the percentage value of the samples located in each bucket data cell is represented in the data cell as a superimposed gray-scale representation. Presenting the percentages in gray-scale provides overall clarity to the table, assists in ensuring that data can be quickly and easily interpreted and not be subject to misinterpretation, and further allows for the compact display of such information in a single table and subsequent manipulation by automated analysis tools.

Description

CROSS-REFERENCE TO RELATED APPLICATIONS [0001] This application is a continuation-in-part of U.S. patent application Ser. No. 10 / 832,304 filed Apr. 26, 2004 entitled “Method for Superimposing Statistical Information Tabular Data” which claims the benefit of U.S. Provisional Application No. 60 / 465,045, filed Apr. 24, 2003.FIELD OF THE INVENTION [0002] The present invention disclosed herein relates to the displaying of any statistical data and particularly to a method for superimposing a graph onto tabular data that is normally displayed utilizing a bar chart. Even more particularly, the invention relates to statistical data containing sample counts and percentages, wherein such data is displayed within a single table. BACKGROUND OF THE INVENTION [0003] Statistics have been used for centuries to quantify data. Today specific statistical measures and characteristics of database and schema objects and other forms of data presentation, such as the data distribution and storage characteri...

Claims


Application Information

Patent Timeline
Patent Type & Authority Applications(United States)
IPC IPC(8): G06F17/00G06F17/21G06F17/24G06K9/36
CPCG06F17/246G06F17/211G06F40/103G06F40/18
Inventor PALMER, JAMES R.
Owner HYPERFORMIX
Why Eureka
Try Eureka