
Process, system and financial engine for determining a level of risk in the market, and for adjusting user's market exposure based on the level of risk

Inactive Publication Date: 2005-11-24
MANNING & NAPIER ADVISORS
View PDF8 Cites 19 Cited by
  • Summary
  • Abstract
  • Description
  • Claims
  • Application Information

AI Technical Summary

Benefits of technology

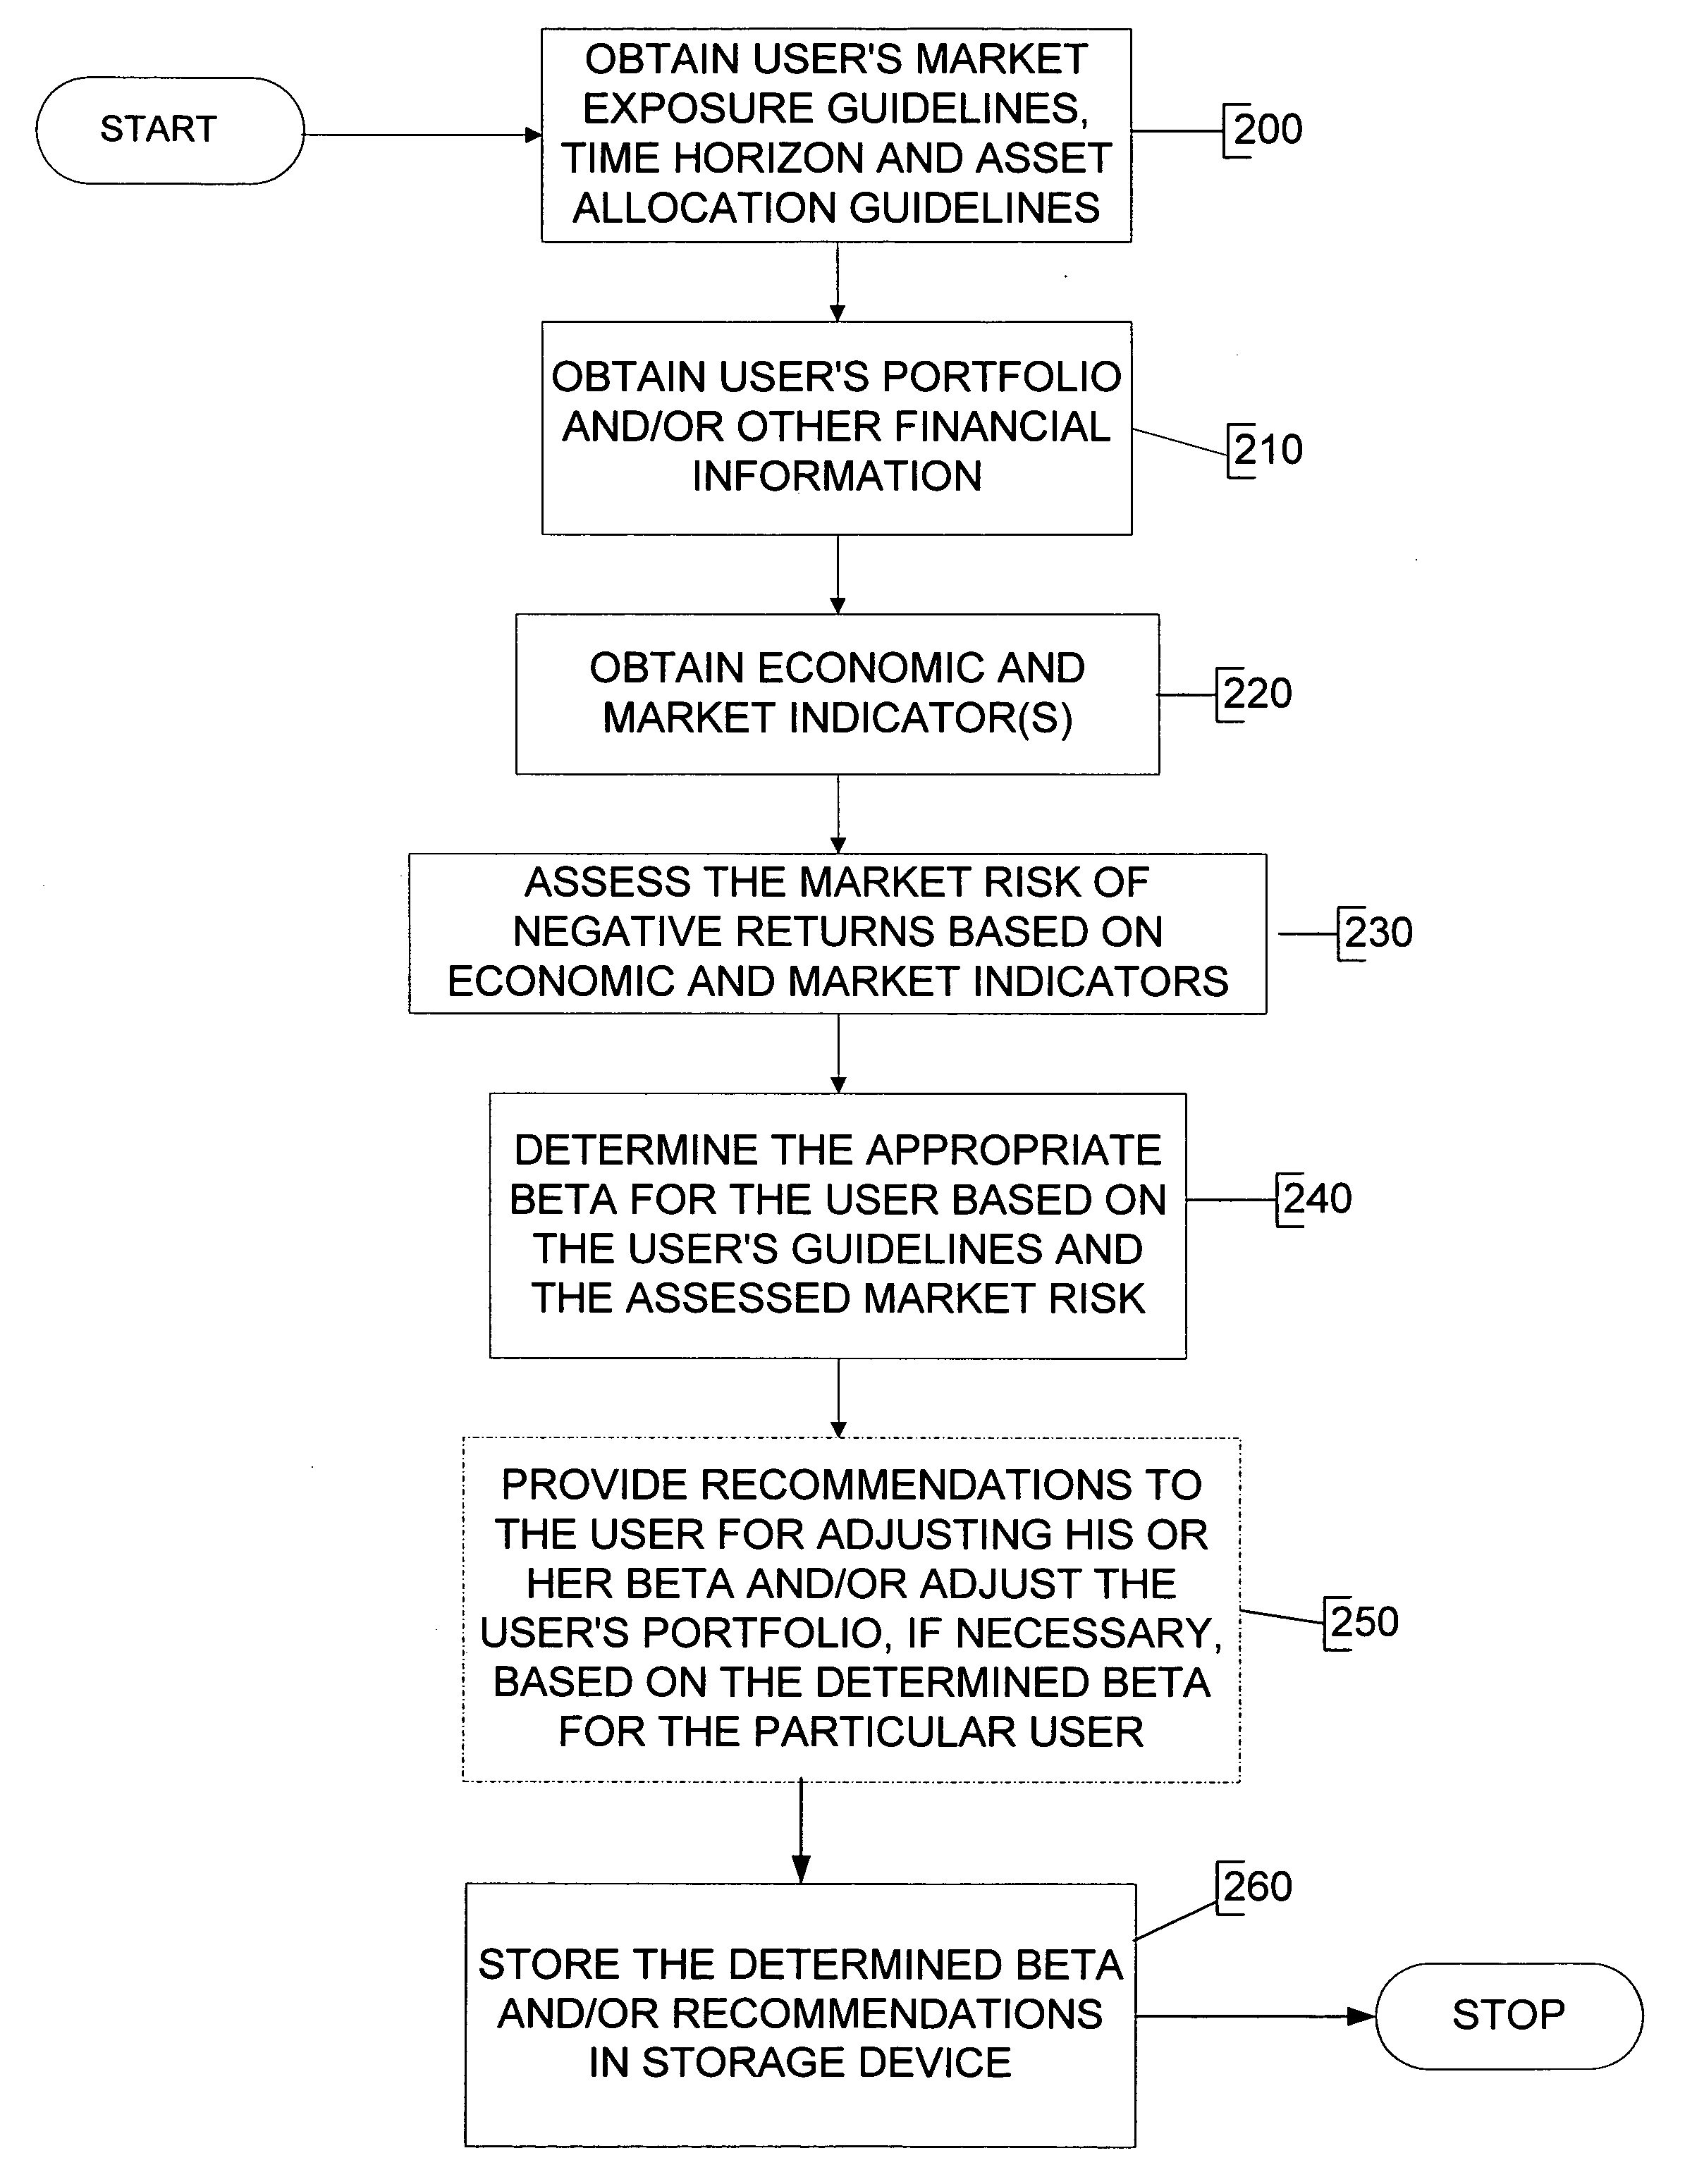
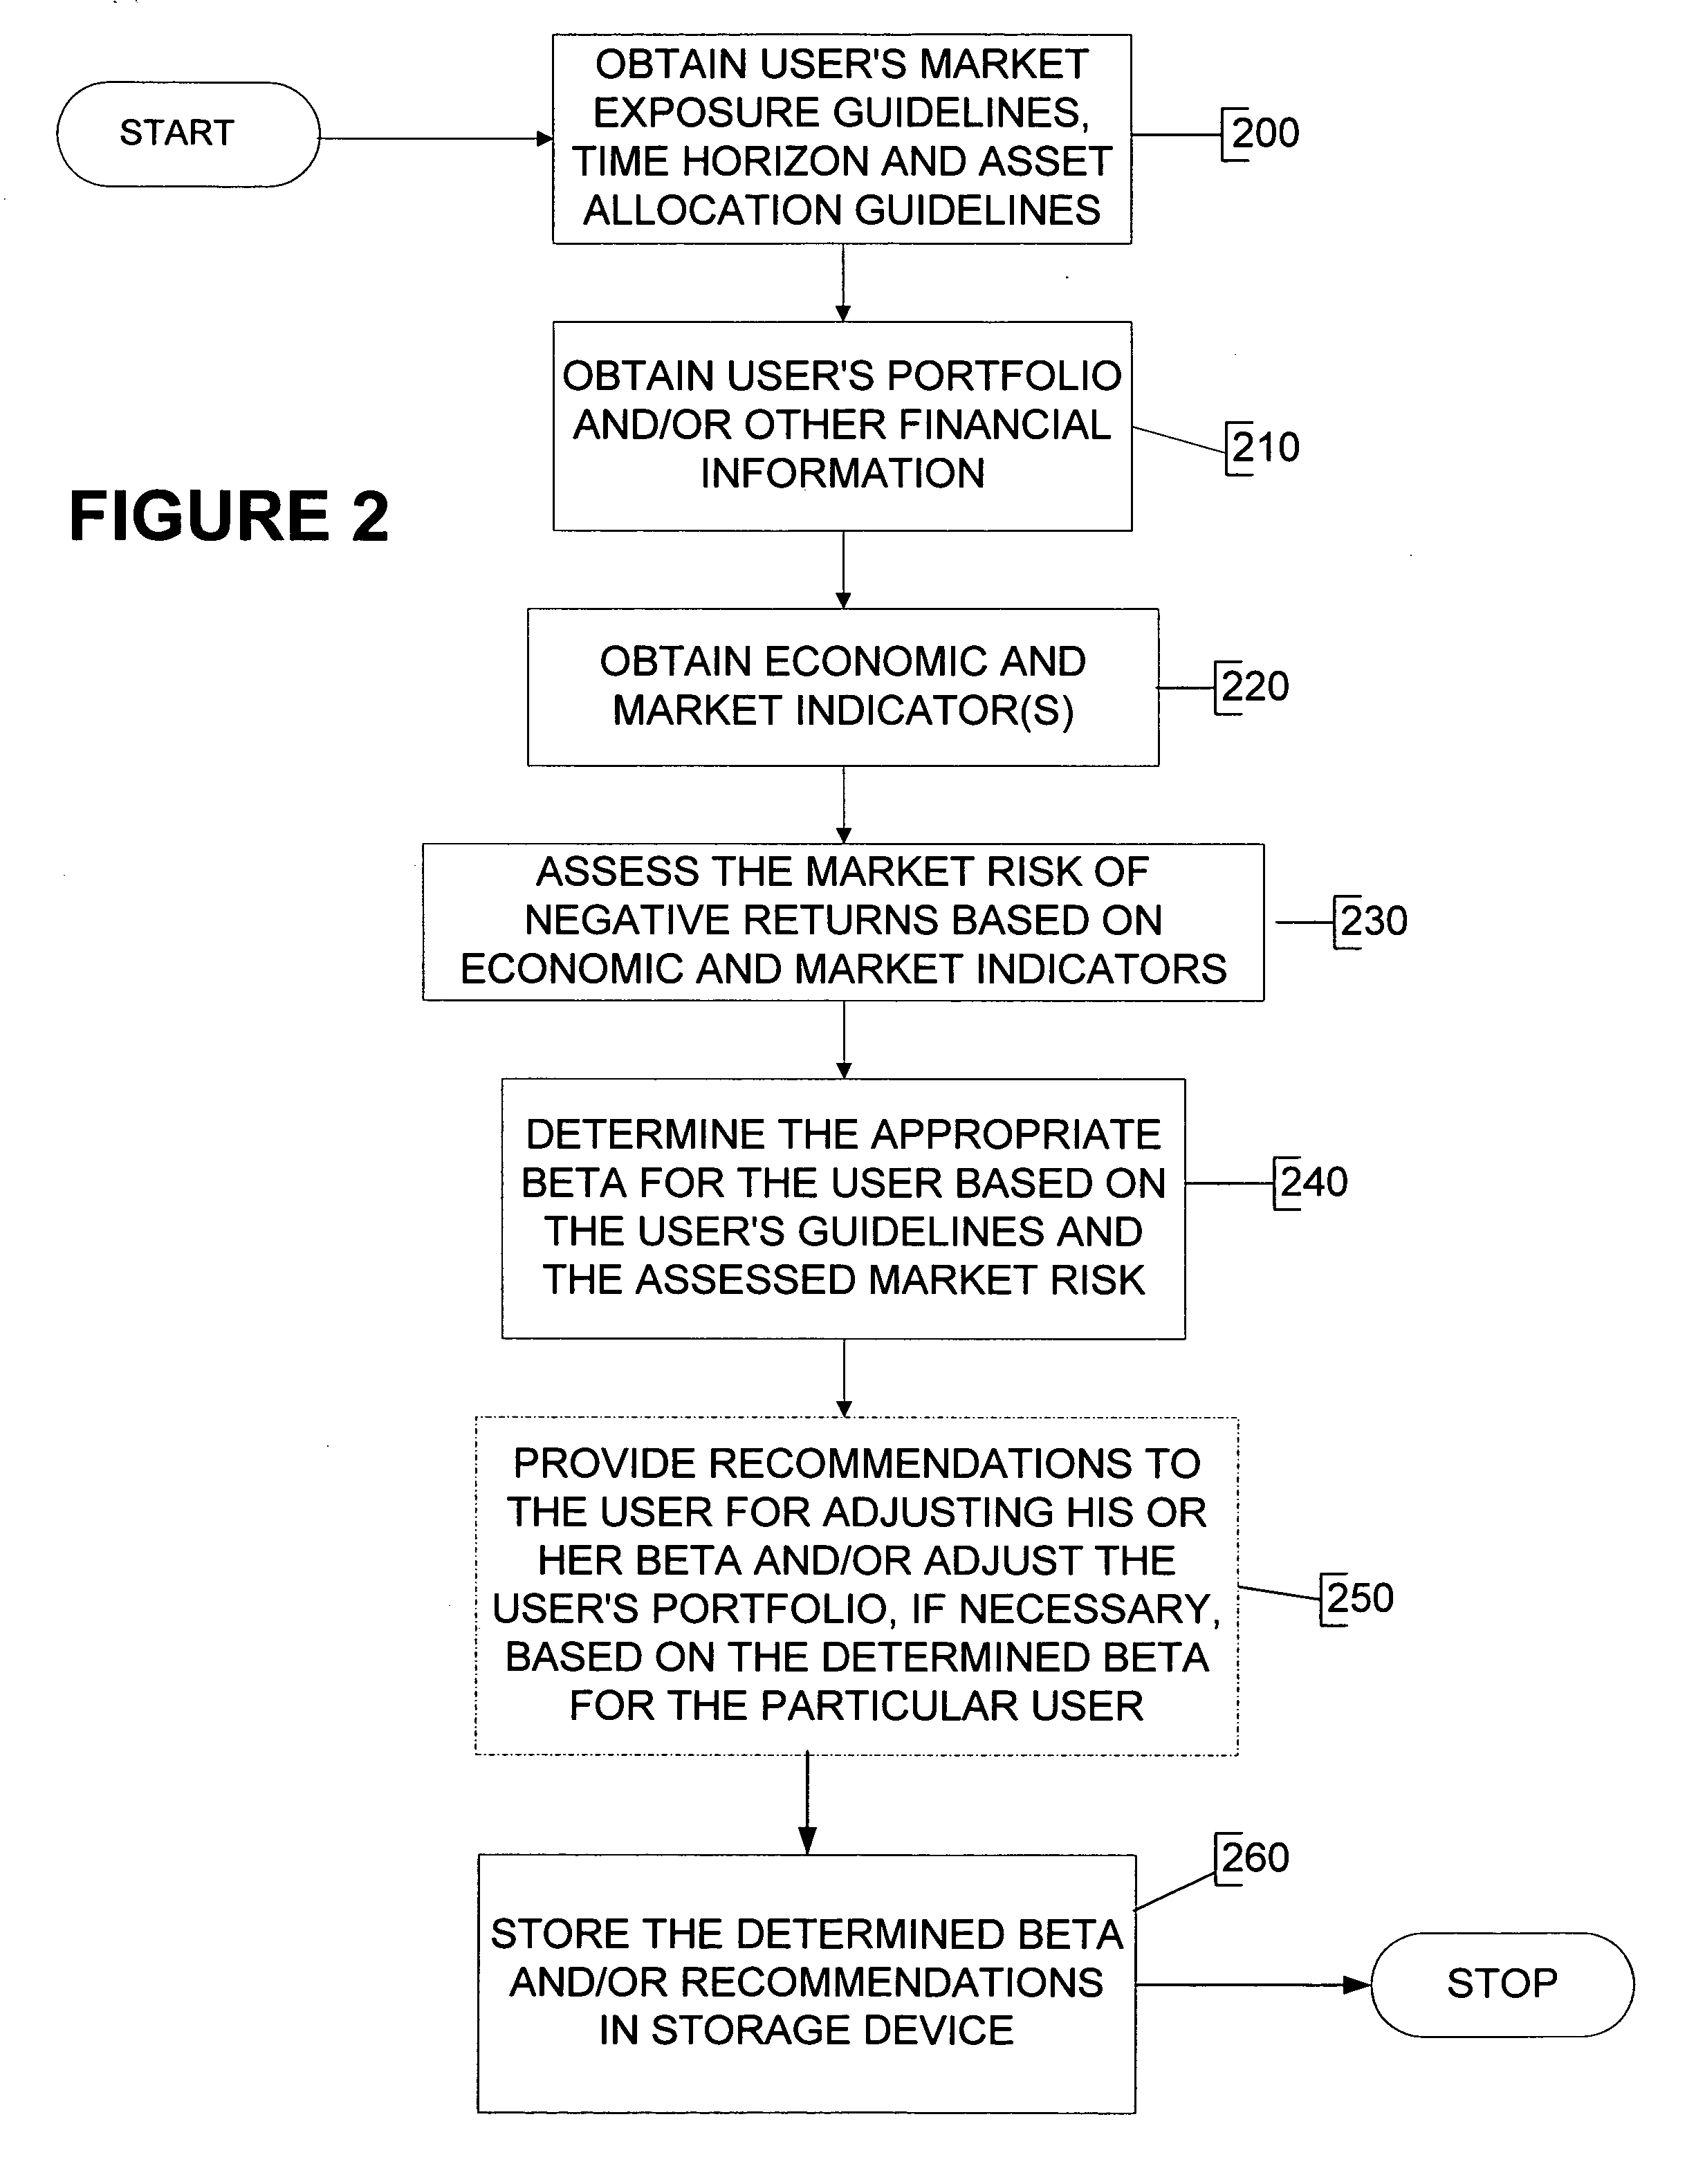
[0006] According to the present invention, a process, system and financial engine are provided which determine a portfolio's sensitivity to market conditions. In particular, with these process, system and financial engine, first data representative of time horizon information and second data representative of risk tolerance information are first received, and guidelines data based on the first and second data are established. Data underlying the quantitative indicators and factors determining the qualitative indicators are received. At least one indicator which is an economic indicator and / or a market indicator can also be established. Then, at least one market risk measure based on at least one indicator is established, and the portfolio's sensitivity is determined based on the established guidelines data and the level of market risk. As a result, using these process, system and financial engine, it is possible to determine the current market risk level, and then recommend certain changes to the user's portfolio sensitivity (or actually adjust the portfolio's sensitivity) based on the determined market risk level, the user's time horizon (i.e., the user's need to access his or her assets within a particular time) and possibly risk tolerance (e.g., the willingness / ability to withstand sustained loss of capital). The portfolio sensitivity can be referred to as the portfolio's Beta. Beta can be adjusted by increasing or decreasing the portfolio's exposure to equity investments with respect to the total investments in the portfolio. An adjustment to Beta can be referred to as “BetaSlidingSM”, and may be further described as a systematic reduction and / or increase of market risk (i.e., Beta) for the client as the risk in that market increases or declines. One of the advantages of this exemplary embodiment is that it allows the environment-sensitive assessments to be made regarding an appropriate mix of the asset types for a given set of the user's time horizon and / or risk tolerance characteristics.
[0013] In one further exemplary embodiment, the system, process and financial engine according to the present invention also adjusts the exposure of the user's portfolio to various market risks based upon the portfolio's investment time horizon and the level of risk for a given market in the current environment. A reduction of the Beta value can be referred to as “BetaSlidingSM”, and may be further described as a systematic reduction and / or increase of market risk (i.e., the Beta value) for the client as the risk in that market increases or declines. One of the advantages of this exemplary embodiment is that it allows the environment-sensitive assessments to be made regarding, e.g., an appropriate mix of the asset types for a given set of the user's time horizon / risk tolerance characteristics.

Problems solved by technology

This conventional approach has been extensively used in the investment industry; however, it fails to take into consideration the fact that the markets tend to move in cycles.
Indeed, small errors in the expected return may highly influence the output of the mean-variance technique.
Thus, the client would be relying heavily on a variable that is highly unpredictable, whether or not the historical data or the analyst's best estimates of the future returns are used in the optimization.
However, this model generally is based on pursuing returns, and typically does not differentiate between users who have different time horizons.

Method used


Image

  • Process, system and financial engine for determining a level of risk in the market, and for adjusting user's market exposure based on the level of risk
  • Process, system and financial engine for determining a level of risk in the market, and for adjusting user's market exposure based on the level of risk
  • Process, system and financial engine for determining a level of risk in the market, and for adjusting user's market exposure based on the level of risk

Examples


Embodiment Construction

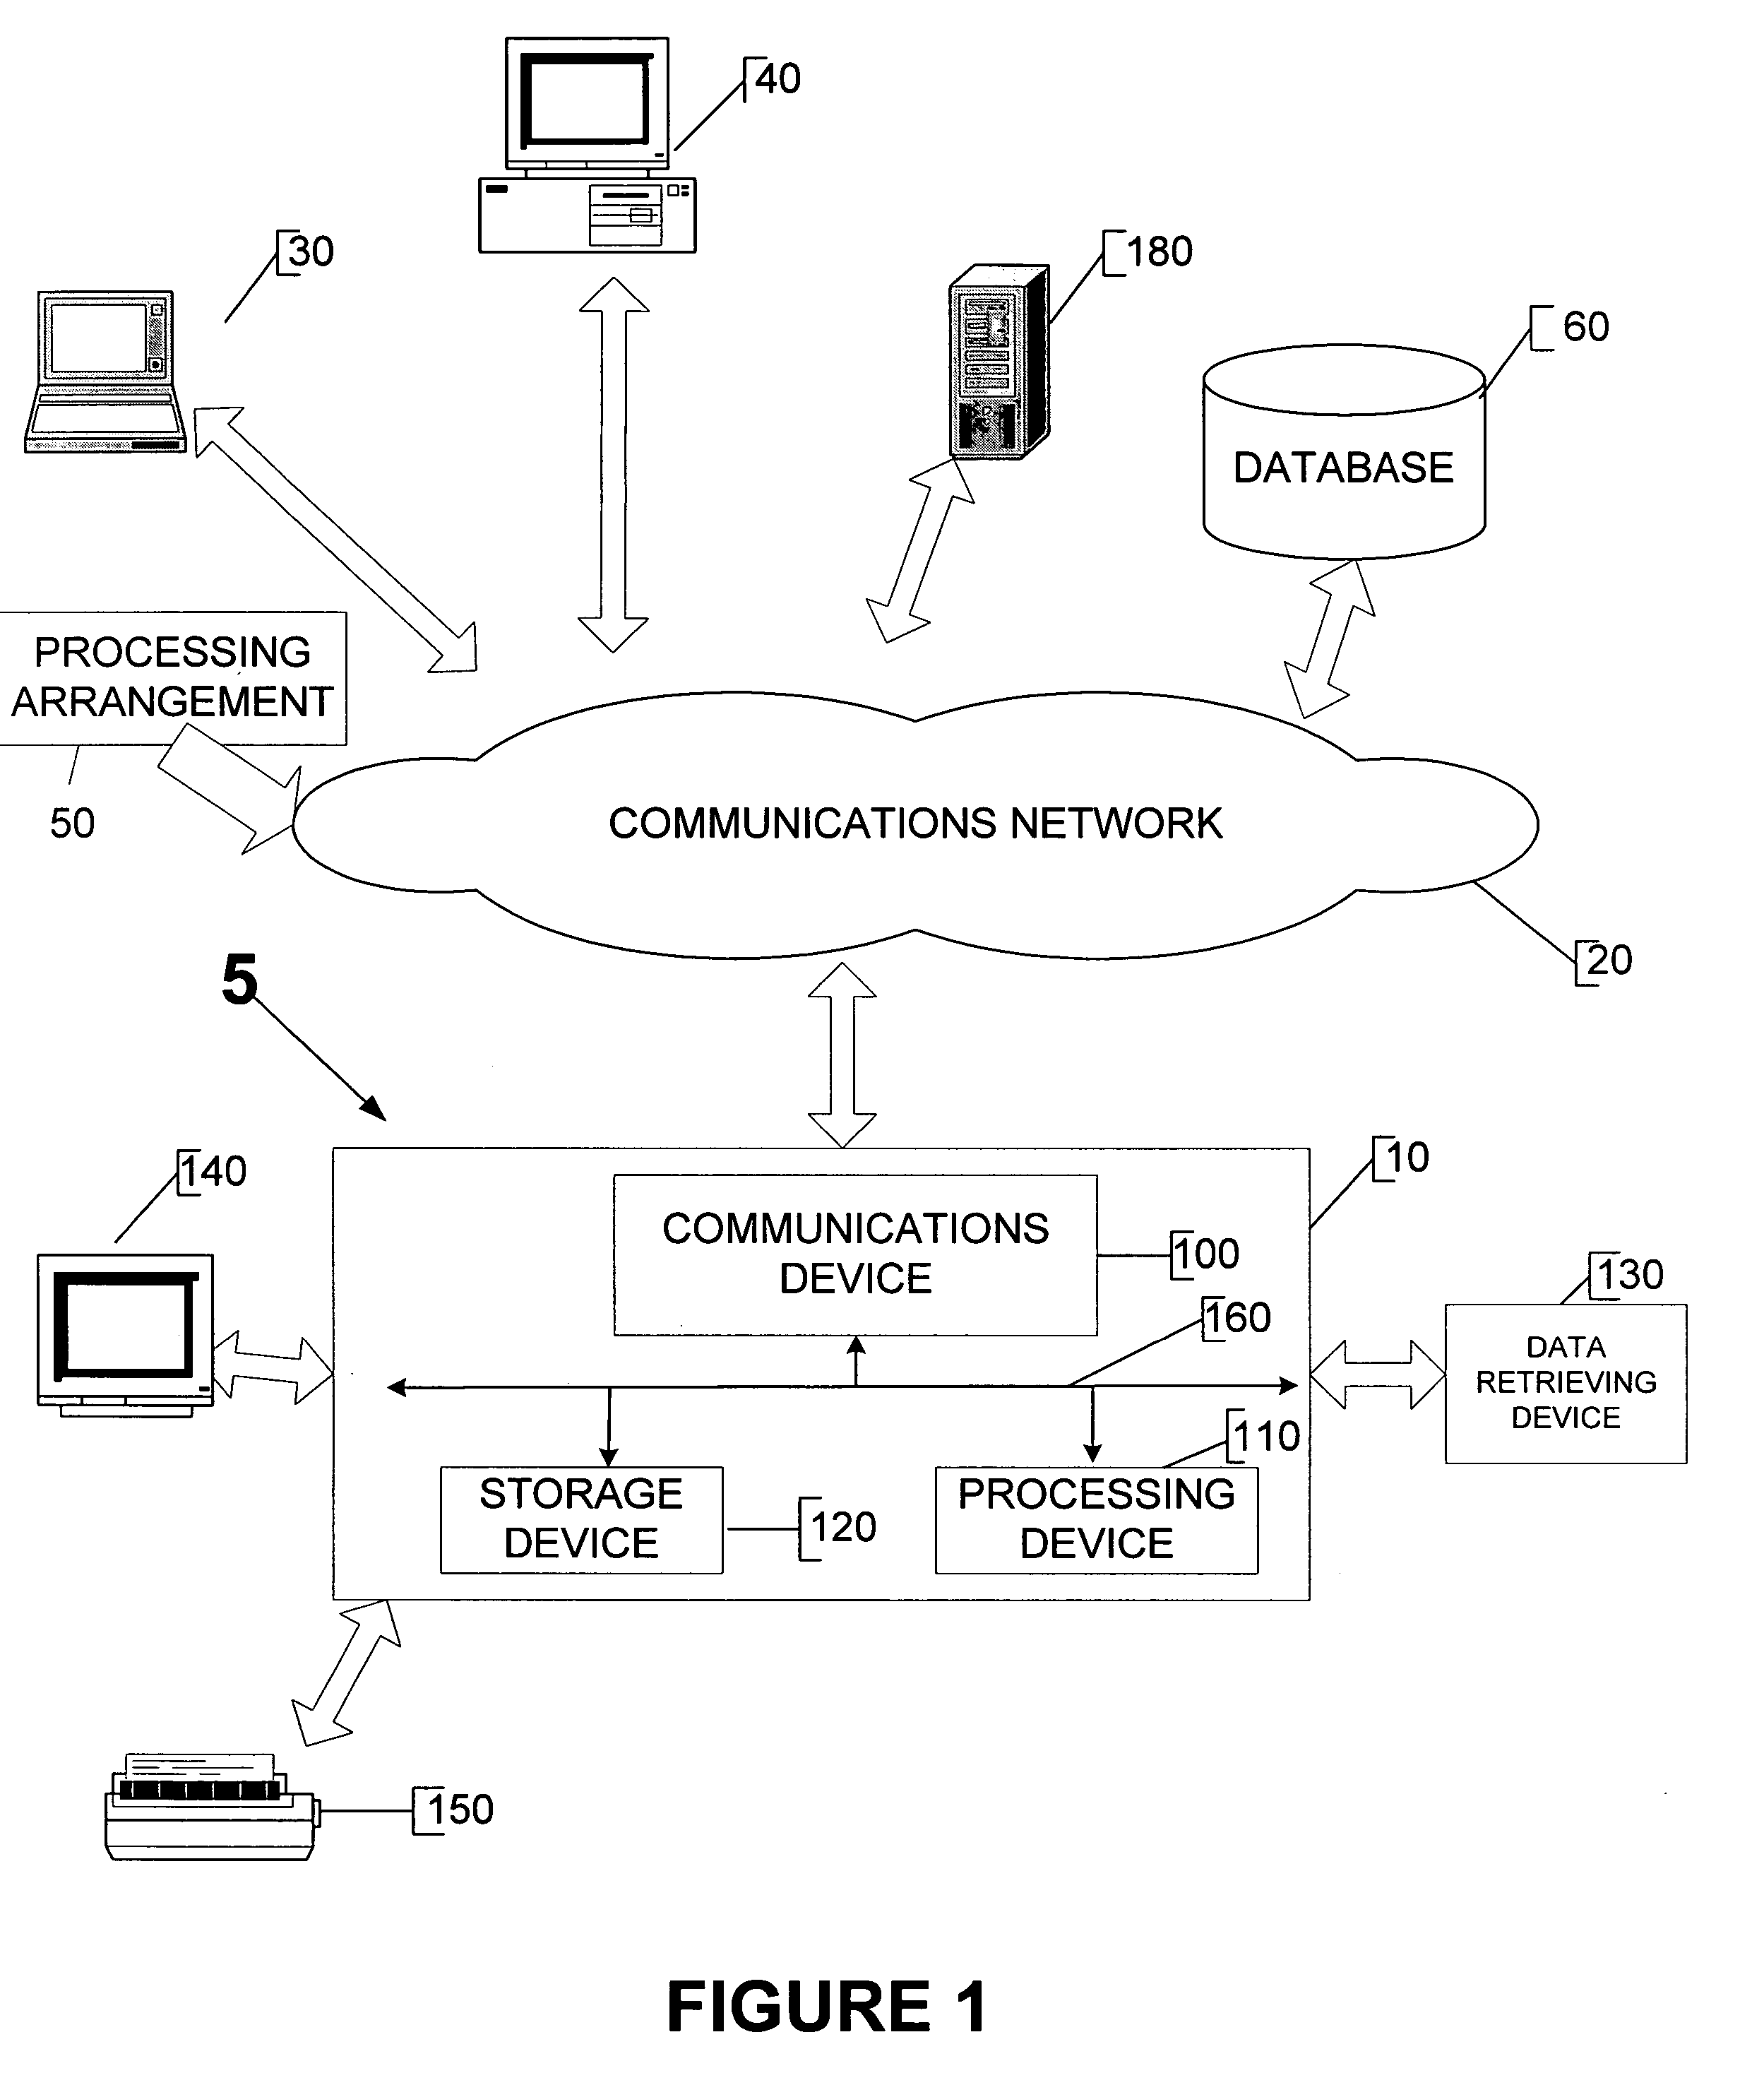
[0023]FIG. 1 shows an exemplary embodiment of a system 5 according to the present invention which determines a level of risk in the market, and possibly adjusts user's market exposure based on the level of the market risk (e.g., “Beta”), the user's time horizon and risk tolerance. Beta can be defined as a measure of systematic risk based on the covariance of a portfolio in relation to a given market. In other words, Beta is a measurement of a portfolio's sensitivity to the volatility of a given market (e.g., the stock market). For example, a Beta of zero to the United States stock market may indicate that the user owns no equity-type financial assets (e.g., stocks), but rather holds only cash. Whereas, a Beta of 1.0 may indicate that the user owns 100% in equity-type financial assets with similar financial characteristics to the overall market. Further, a Beta of 0.8 may indicate that 80% of the user's assets are such equity-type assets, while Beta of 0.3 may signify that only 30% o...


PUM


Abstract

A process, system and financial engine which determine a portfolio's sensitivity to market risk based on market conditions are described. In particular, with these process, system and financial engine, first data representative of time horizon information and second data representative of risk tolerance information are first received, and guidelines data based on the first and second data are established. Economic and market data underlying the quantitative indicators and factors determining the qualitative indicators are received. Market risk signals based on the indicator(s) is then established. The portfolio's sensitivity is determined based on the established guidelines data and the market risk signal. Using these process, system and financial engine, it is possible to determine the current market risk level, and then recommend changes to (or adjust) the user's portfolio market risk sensitivities based on the user's time horizon (i.e., the need to access their assets within a particular time) and the determined market risk level.

Description

FIELD OF THE INVENTION [0001] The present invention relates to a system, process and financial engine for determining a level of risk in the market, and for adjusting user's market exposure based on the level of risk. In particular, the system, process and financial engine first determine the current market risk level, and then recommend changes or adjust the user's portfolio sensitivity based on the user's time horizon (e.g., the need to access their assets within a particular time) and the determined market risk level. BACKGROUND INFORMATION [0002] Conventional methods, systems and financial engines to establish an appropriate level of a market risk for a given portfolio have been primarily centered around an establishment of a mean-variance efficient asset allocation model of assets intended to achieve a particular level of market risk as well as a target rate of return for a user (e.g., a client). This technique is known as a mean-variance optimization technique which is based o...

Claims


Application Information

Patent Timeline
IPC IPC(8): G06Q40/00
CPCG06Q40/06
Inventor MANNING, WILLIAMCOONS, JEFFREY S.MCGINN, MICHELE R.
Owner MANNING & NAPIER ADVISORS
Learn More