Statistical method and apparatus for monitoring parameters in an electric power distribution system

a technology of power distribution system and monitoring method, applied in the direction of instruments, electric devices, measurement using digital techniques, etc., can solve the problems of not necessarily following that all is well, unable to predefine acceptable power quality levels, and state of the art systems and methods lack the means of informing the user whether the existing power quality is good or no

Active Publication Date: 2005-12-08
EATON INTELLIGENT POWER LTD
View PDF13 Cites 73 Cited by
  • Summary
  • Abstract
  • Description
  • Claims
  • Application Information

AI Technical Summary

Benefits of technology

[0010] Another aspect of the invention is directed to a monitoring system for monitoring an electric power distribution system, which comprises: a sensor sensing conditions in the power distribution system; processing means generating from sensed conditions measured values of a selected parameter and periodically generating a standard deviation of the measured values and at least one dynamic threshold for the measured values using the standard deviation; and output means generating an output relating the measured values to the at least one dynamic threshold. The processing means can comprise means generating a long-term average of the measured values and generating a low dynamic threshold by subtracting a function of the standard deviation from the long-term average and generating a high dynamic threshold by adding the function of the standard deviation to the long-term average. The processing means can generate samples of the selected parameter over a selected interval and generate the measured values as an average of the samples over the selected interval. Also, the processing means can generate a long-term average of the measured values and the at least one dynamic threshold by adding a multiplier times the standard deviation to the long-term average. The multiplier can be positive to generate a high dynamic threshold and negative to generate a low dynamic threshold. In addition, the multiplier can have a first value to generate a first dynamic threshold at which a caution is generated, and a second, larger multiplier to generate a second dynamic threshold at which an alarm and / or an action is taken.

Problems solved by technology

However, the state of the art systems and methods lack the means for informing the user whether the existing power quality is normal.
For example, power quality meters display and record values and minimum and maximum extremes, but even if a parameter is within the prescribed range, it does not necessarily follow that all is well.
Furthermore, attempts to predefine acceptable power quality levels fails to acknowledge unique attributes of a particular site in an electrical system.
In practice, the method results in bursts of events that are not very extraordinary as the threshold is set just above nominal and is therefore, very sensitive.
Furthermore, the user is still not aware of whether the conditions are normal even though the parameters may be within the dynamically adjusted ranges.

Method used


Image

  • Statistical method and apparatus for monitoring parameters in an electric power distribution system
  • Statistical method and apparatus for monitoring parameters in an electric power distribution system
  • Statistical method and apparatus for monitoring parameters in an electric power distribution system

Examples


Embodiment Construction

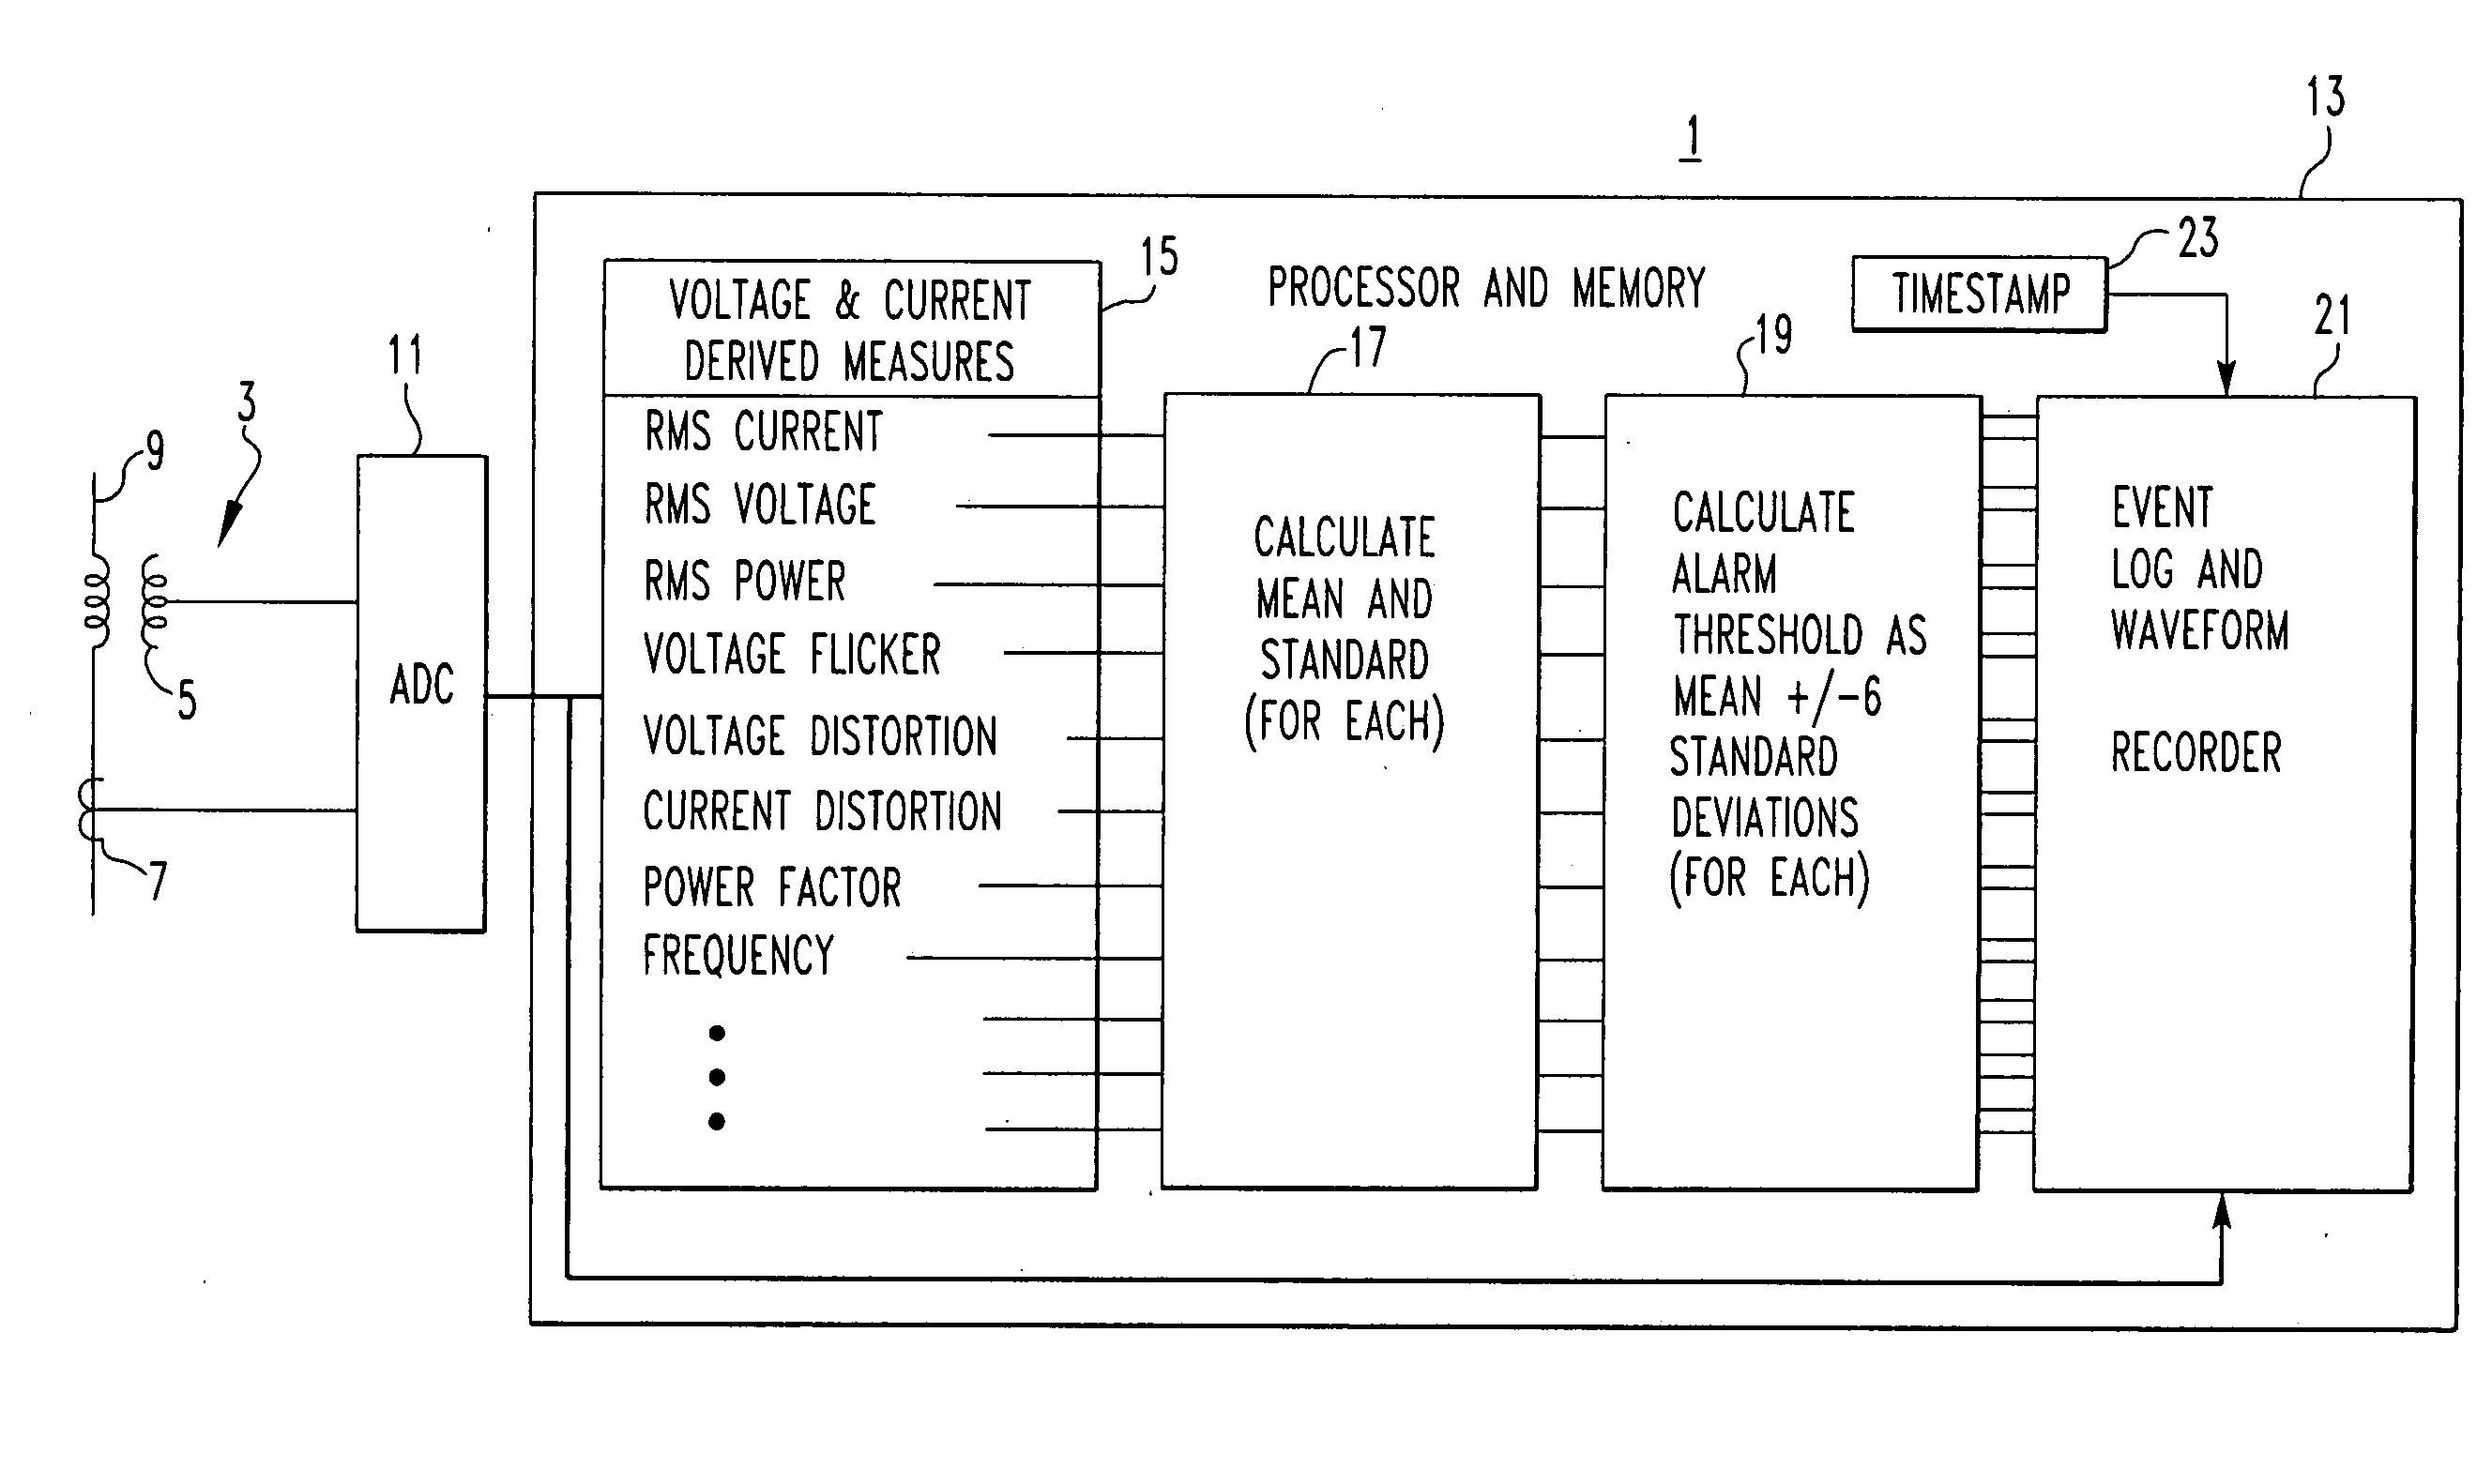
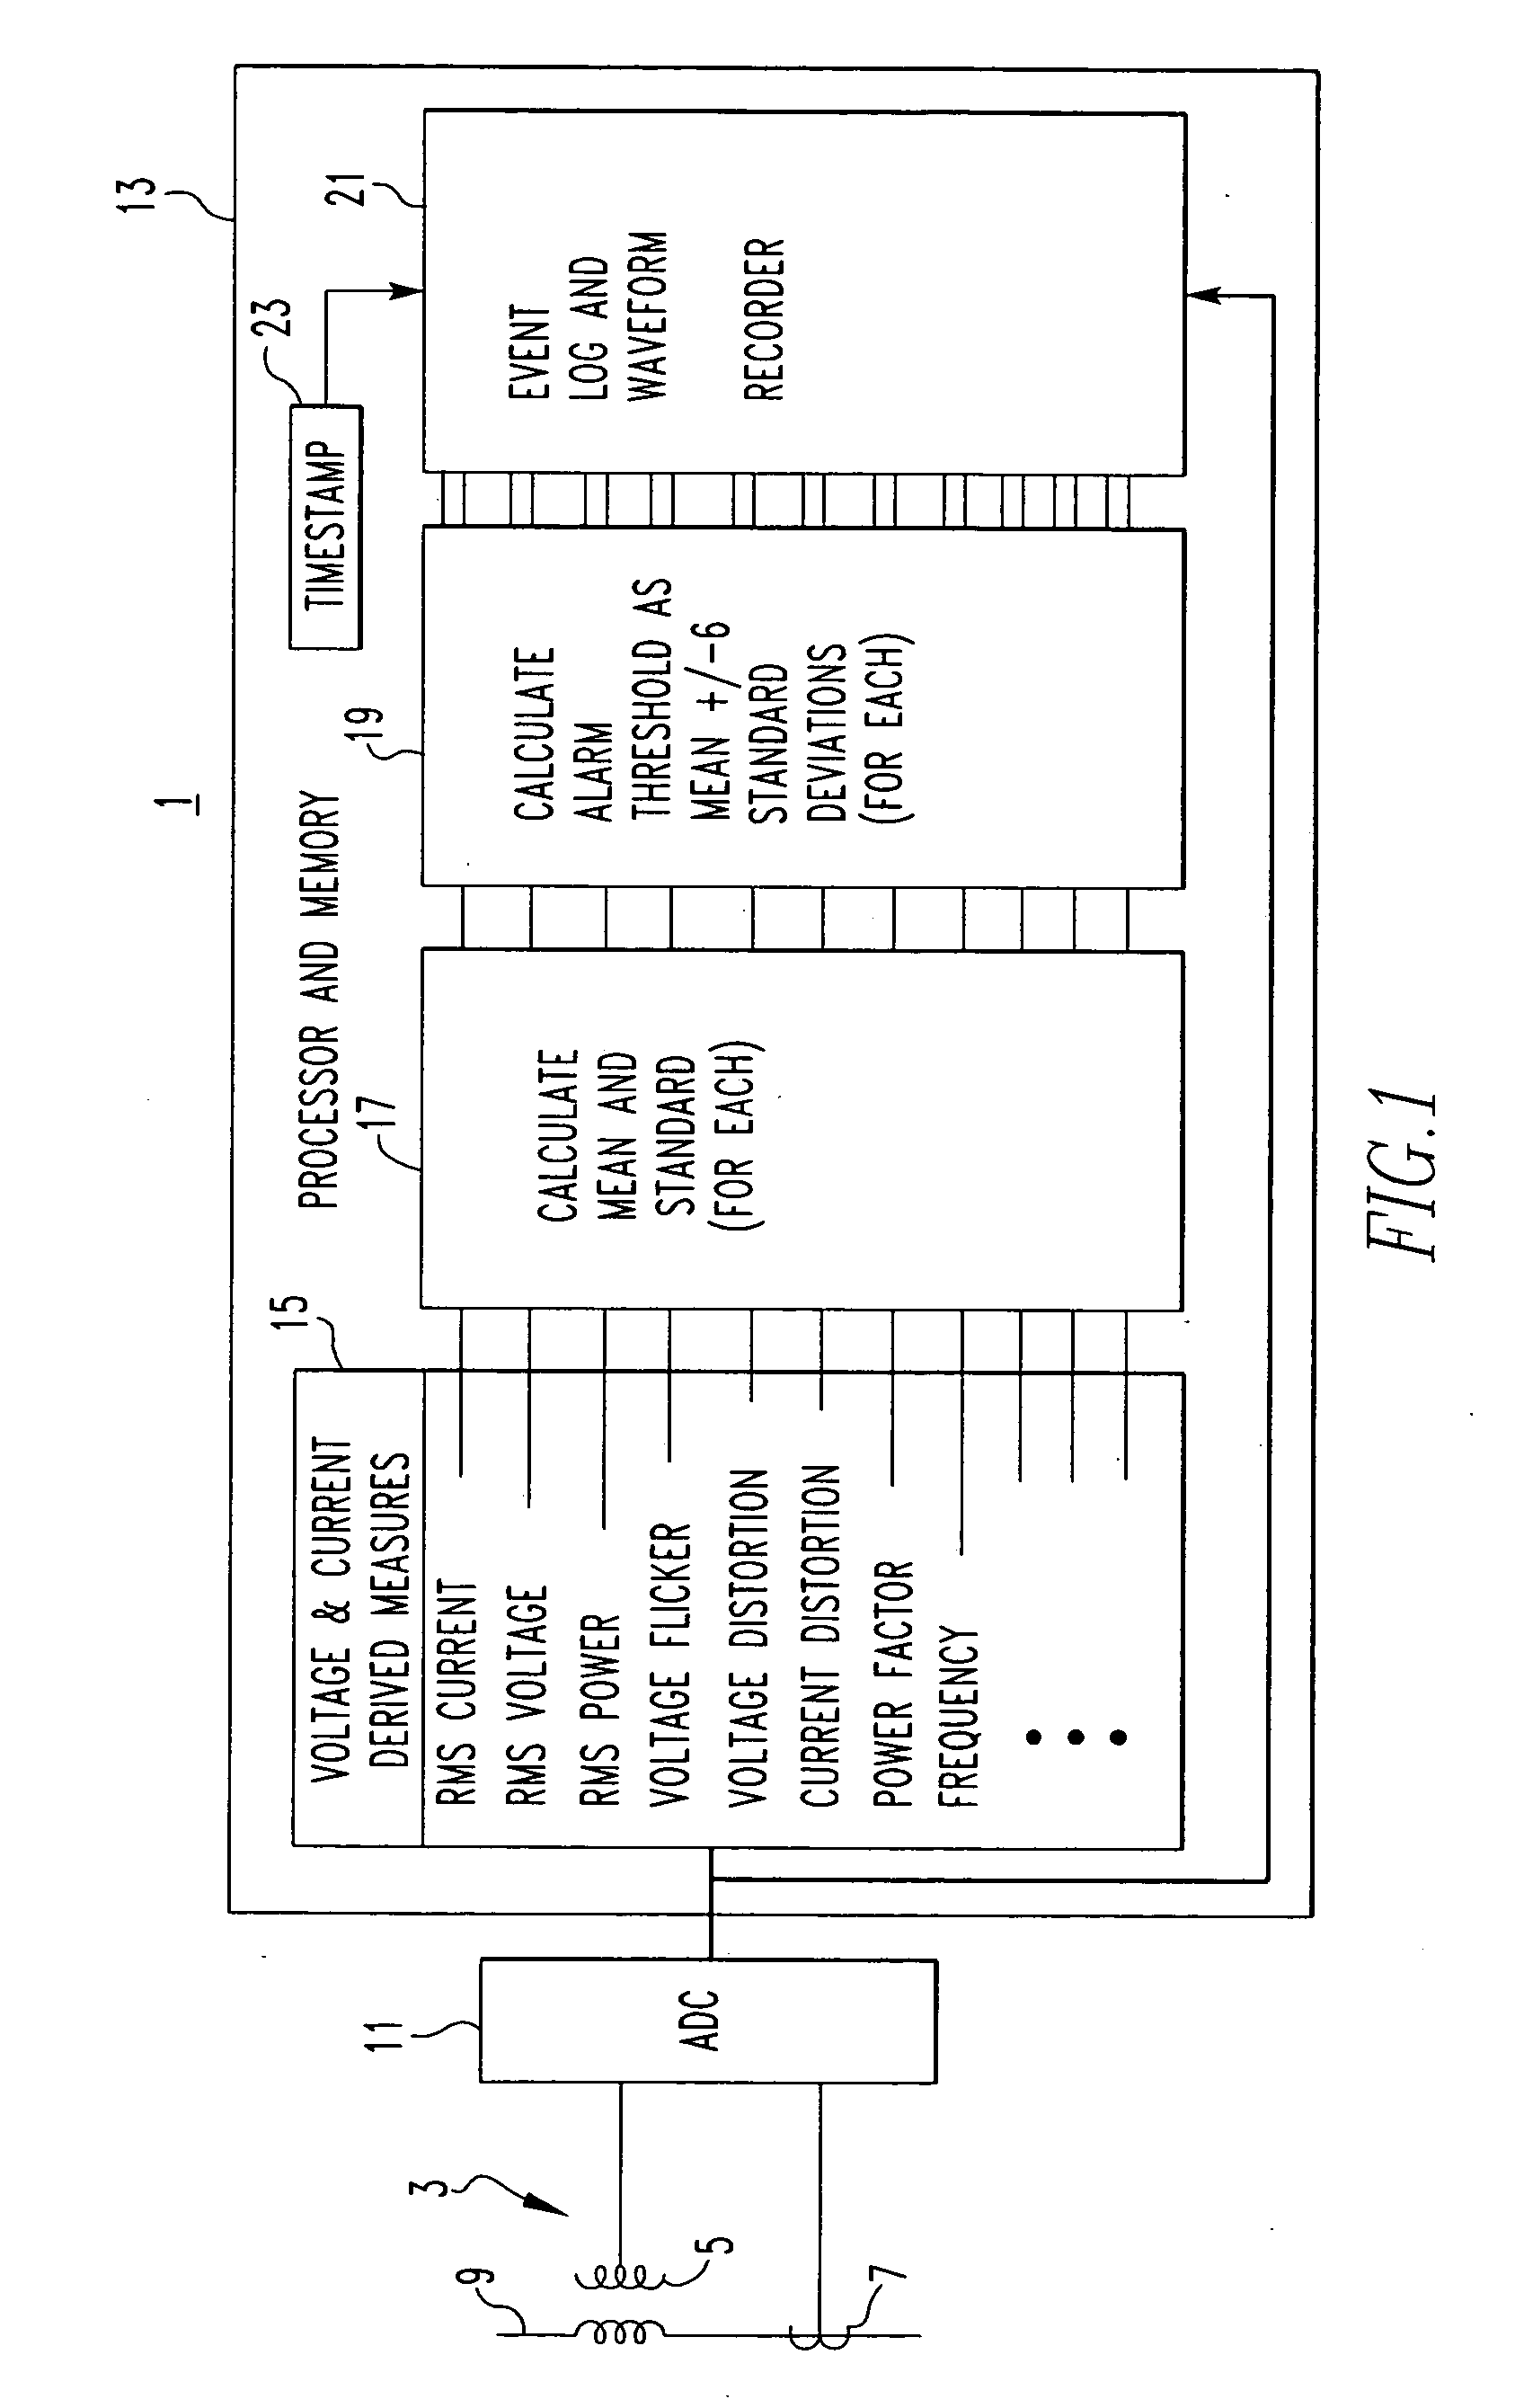
[0016] The invention is directed to a method and monitor that provide an indication of power quality in an electric power distribution system as represented by selected parameters based upon what is normal for the monitored location. As the absolute definition of normal varies from site to site, a statistical mean is used to define normal. In particular, normal is defined using a number of standard deviations. When an event occurs that is beyond the normal condition, that event is automatically captured. Thus, referring to FIG. 1, the monitor 1 includes sensors 3 such as potential transformers 5 and current transformers 7 that measure voltage and current, respectively, in the monitored electric power distribution system 9. While a single line representation is used for clarity, typically the electric power distribution system 9 would be a three-phase system, and hence, there would be a potential transformer 5 and current transformer 7 for each phase. The sensed currents and voltages...


PUM


Abstract

Dynamic thresholds statistically derived are used to define normal conditions at a specific site in an electric power distribution system. High and low and/or caution and alarm thresholds for various parameters are generated as multiples of the standard deviation of the long-term average of measured values calculated from samples gathered over repetitive intervals, such as ten minutes. Weekly averages are used until sufficient data has been gathered to maintain a running one year average.

Description

BACKGROUND OF THE INVENTION [0001] 1. Field of the Invention [0002] The invention relates to a method and apparatus for monitoring the performance of an electric power distribution system, and in accordance with aspects of the invention, defining normal ranges unique to a specific system for selected parameters through the generation of statistically derived parameter thresholds. [0003] 2. Background Information [0004] Numerous methods and systems have been developed to measure and capture power quality events in electric power distribution systems. However, the state of the art systems and methods lack the means for informing the user whether the existing power quality is normal. For example, power quality meters display and record values and minimum and maximum extremes, but even if a parameter is within the prescribed range, it does not necessarily follow that all is well. Furthermore, attempts to predefine acceptable power quality levels fails to acknowledge unique attributes of...

Claims


Application Information

Patent Timeline
Patent Type & Authority Applications(United States)
IPC IPC(8): G01R19/25G01R21/133
CPCG01R19/2513G01R21/133
Inventor COX, ROGER W.
Owner EATON INTELLIGENT POWER LTD
Why Eureka
Try Eureka