Industrial control and monitoring system status visualization method and system

Inactive Publication Date: 2006-03-30
ROCKWELL AUTOMATION TECH
View PDF11 Cites 45 Cited by
  • Summary
  • Abstract
  • Description
  • Claims
  • Application Information

AI Technical Summary

Problems solved by technology

The resulting overall structure can be extremely complex, making oversight and troubleshooting the equipment, in the event of faults or needed maintenance, very problematical.
Where changes are made to a system after its installation, the reliability of drawings, system layouts, and the like, may become suspect, and considerable time may be lost in evaluating the actual physical configuration of the system to identify both the desired function of the components and their physical location.
Another problem typically associated with sys

Method used


Image

  • Industrial control and monitoring system status visualization method and system
  • Industrial control and monitoring system status visualization method and system
  • Industrial control and monitoring system status visualization method and system

Examples


Embodiment Construction

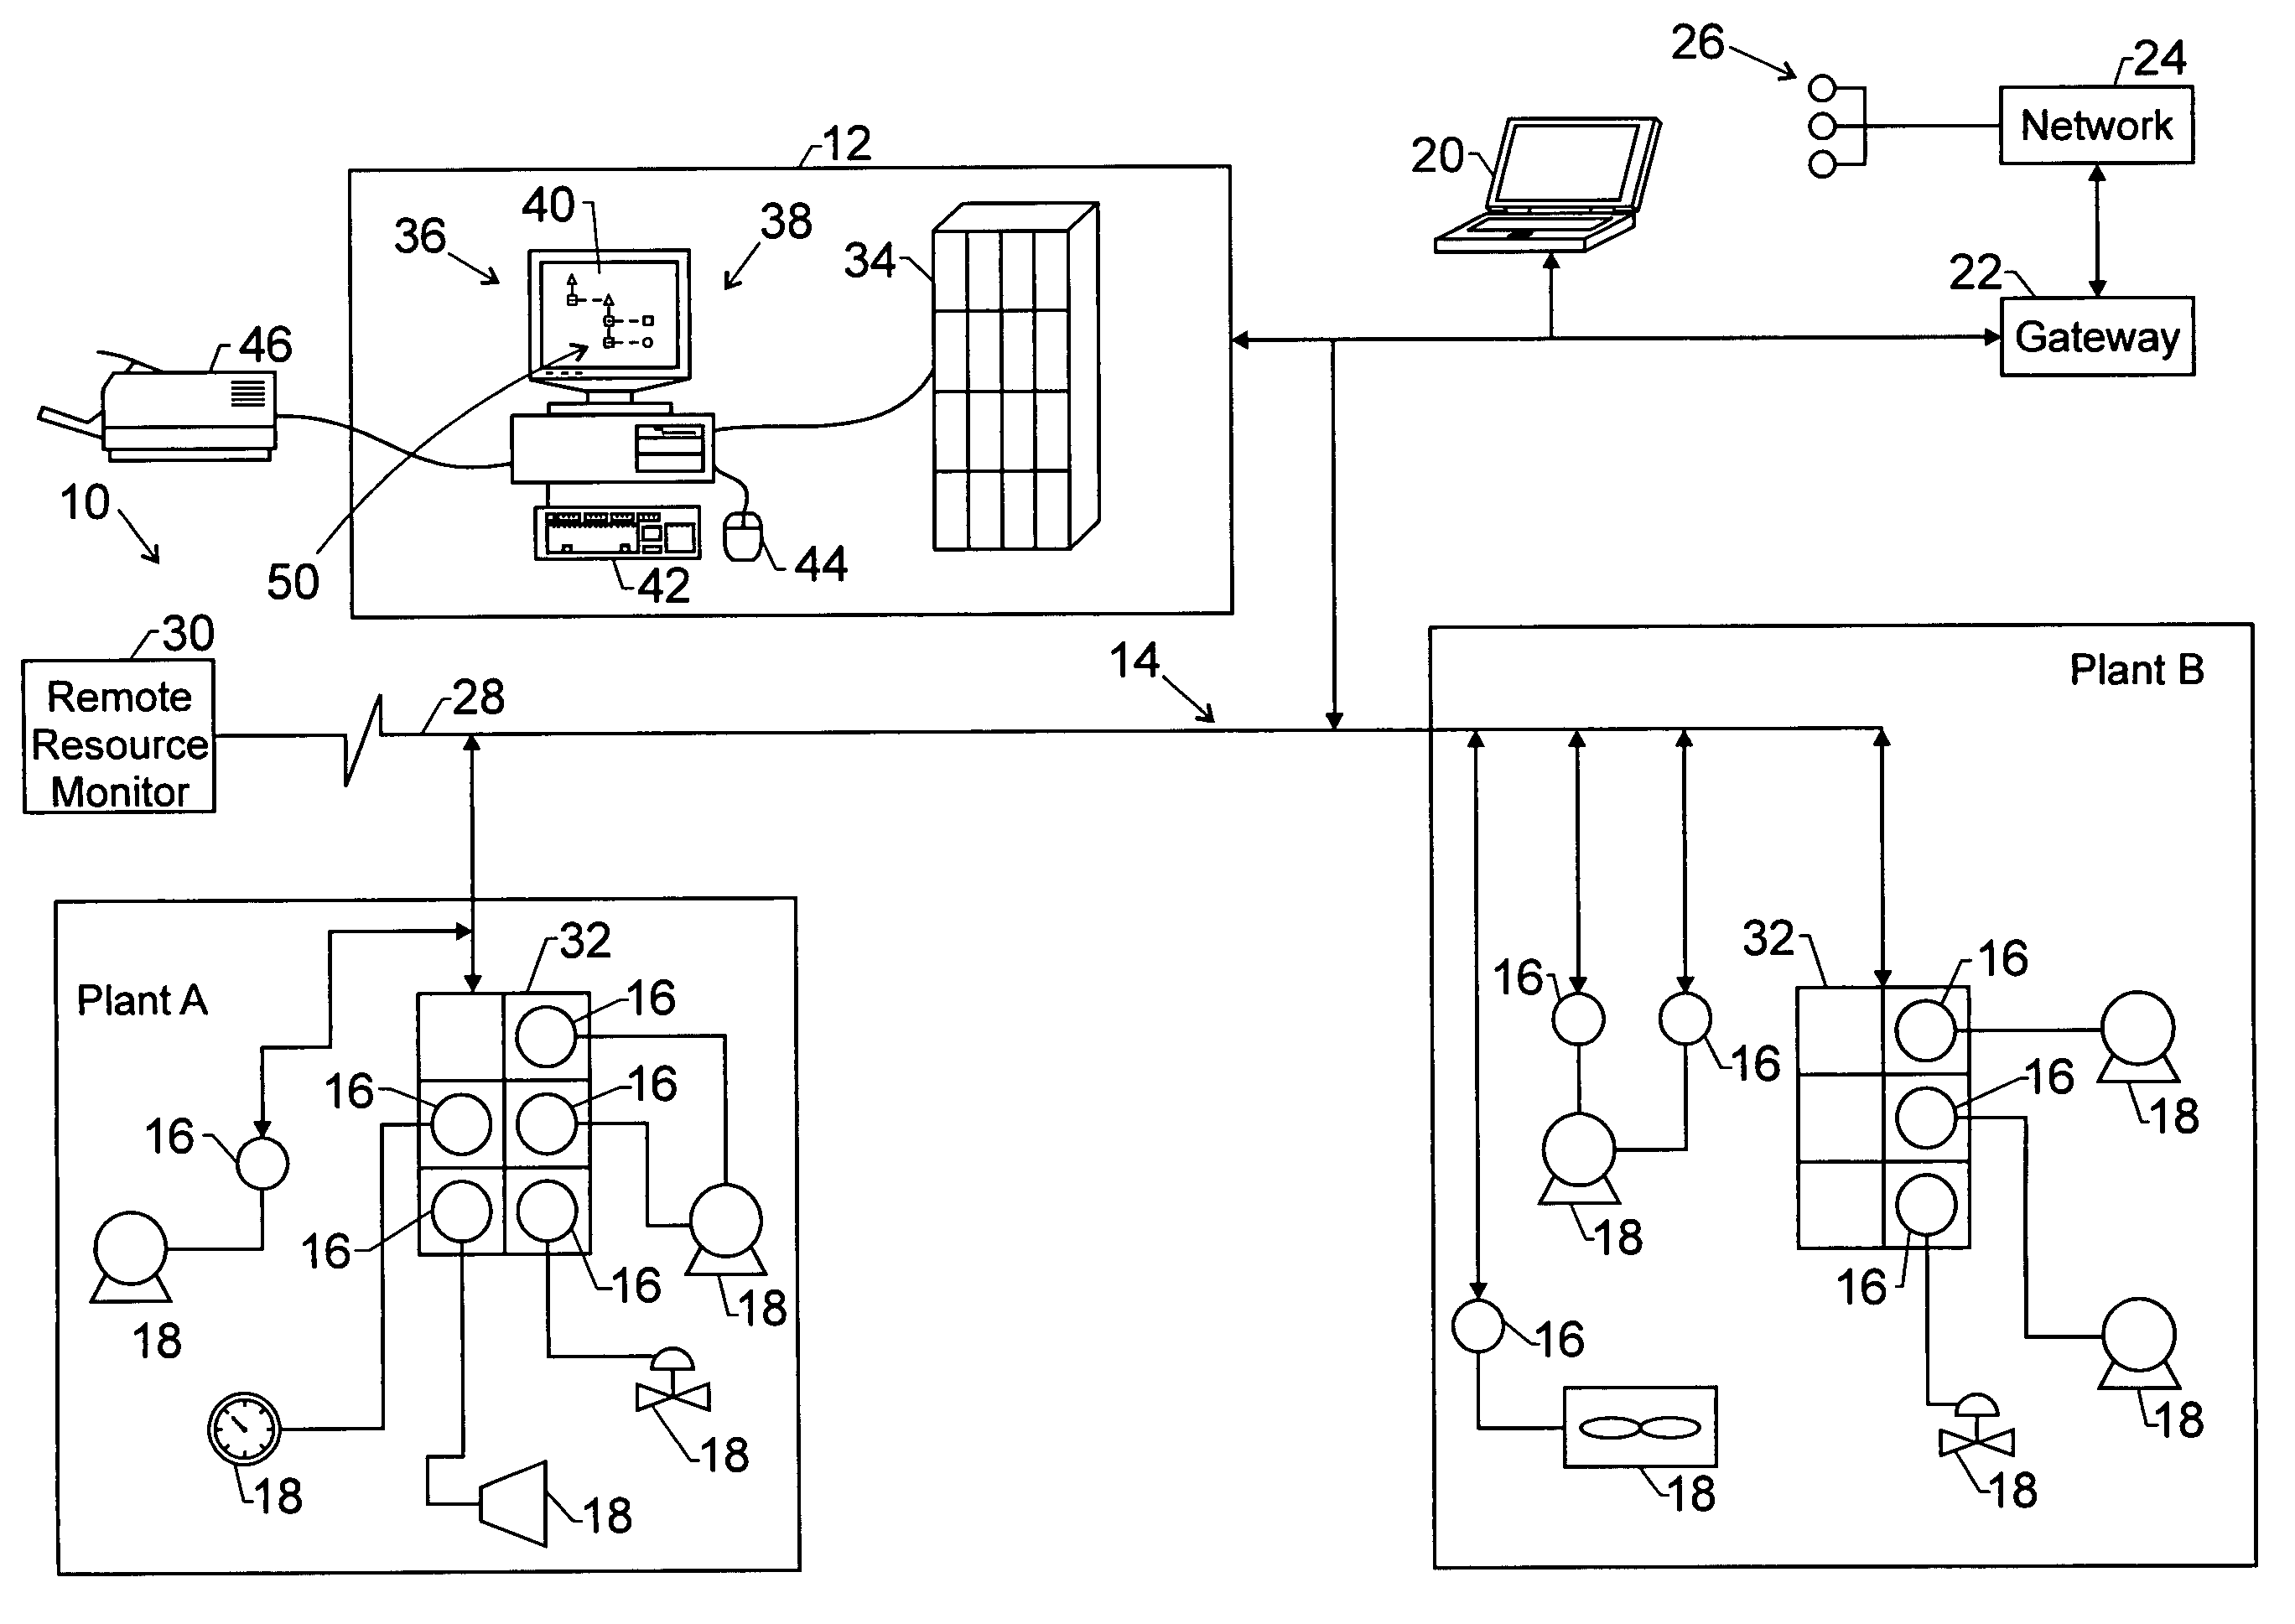
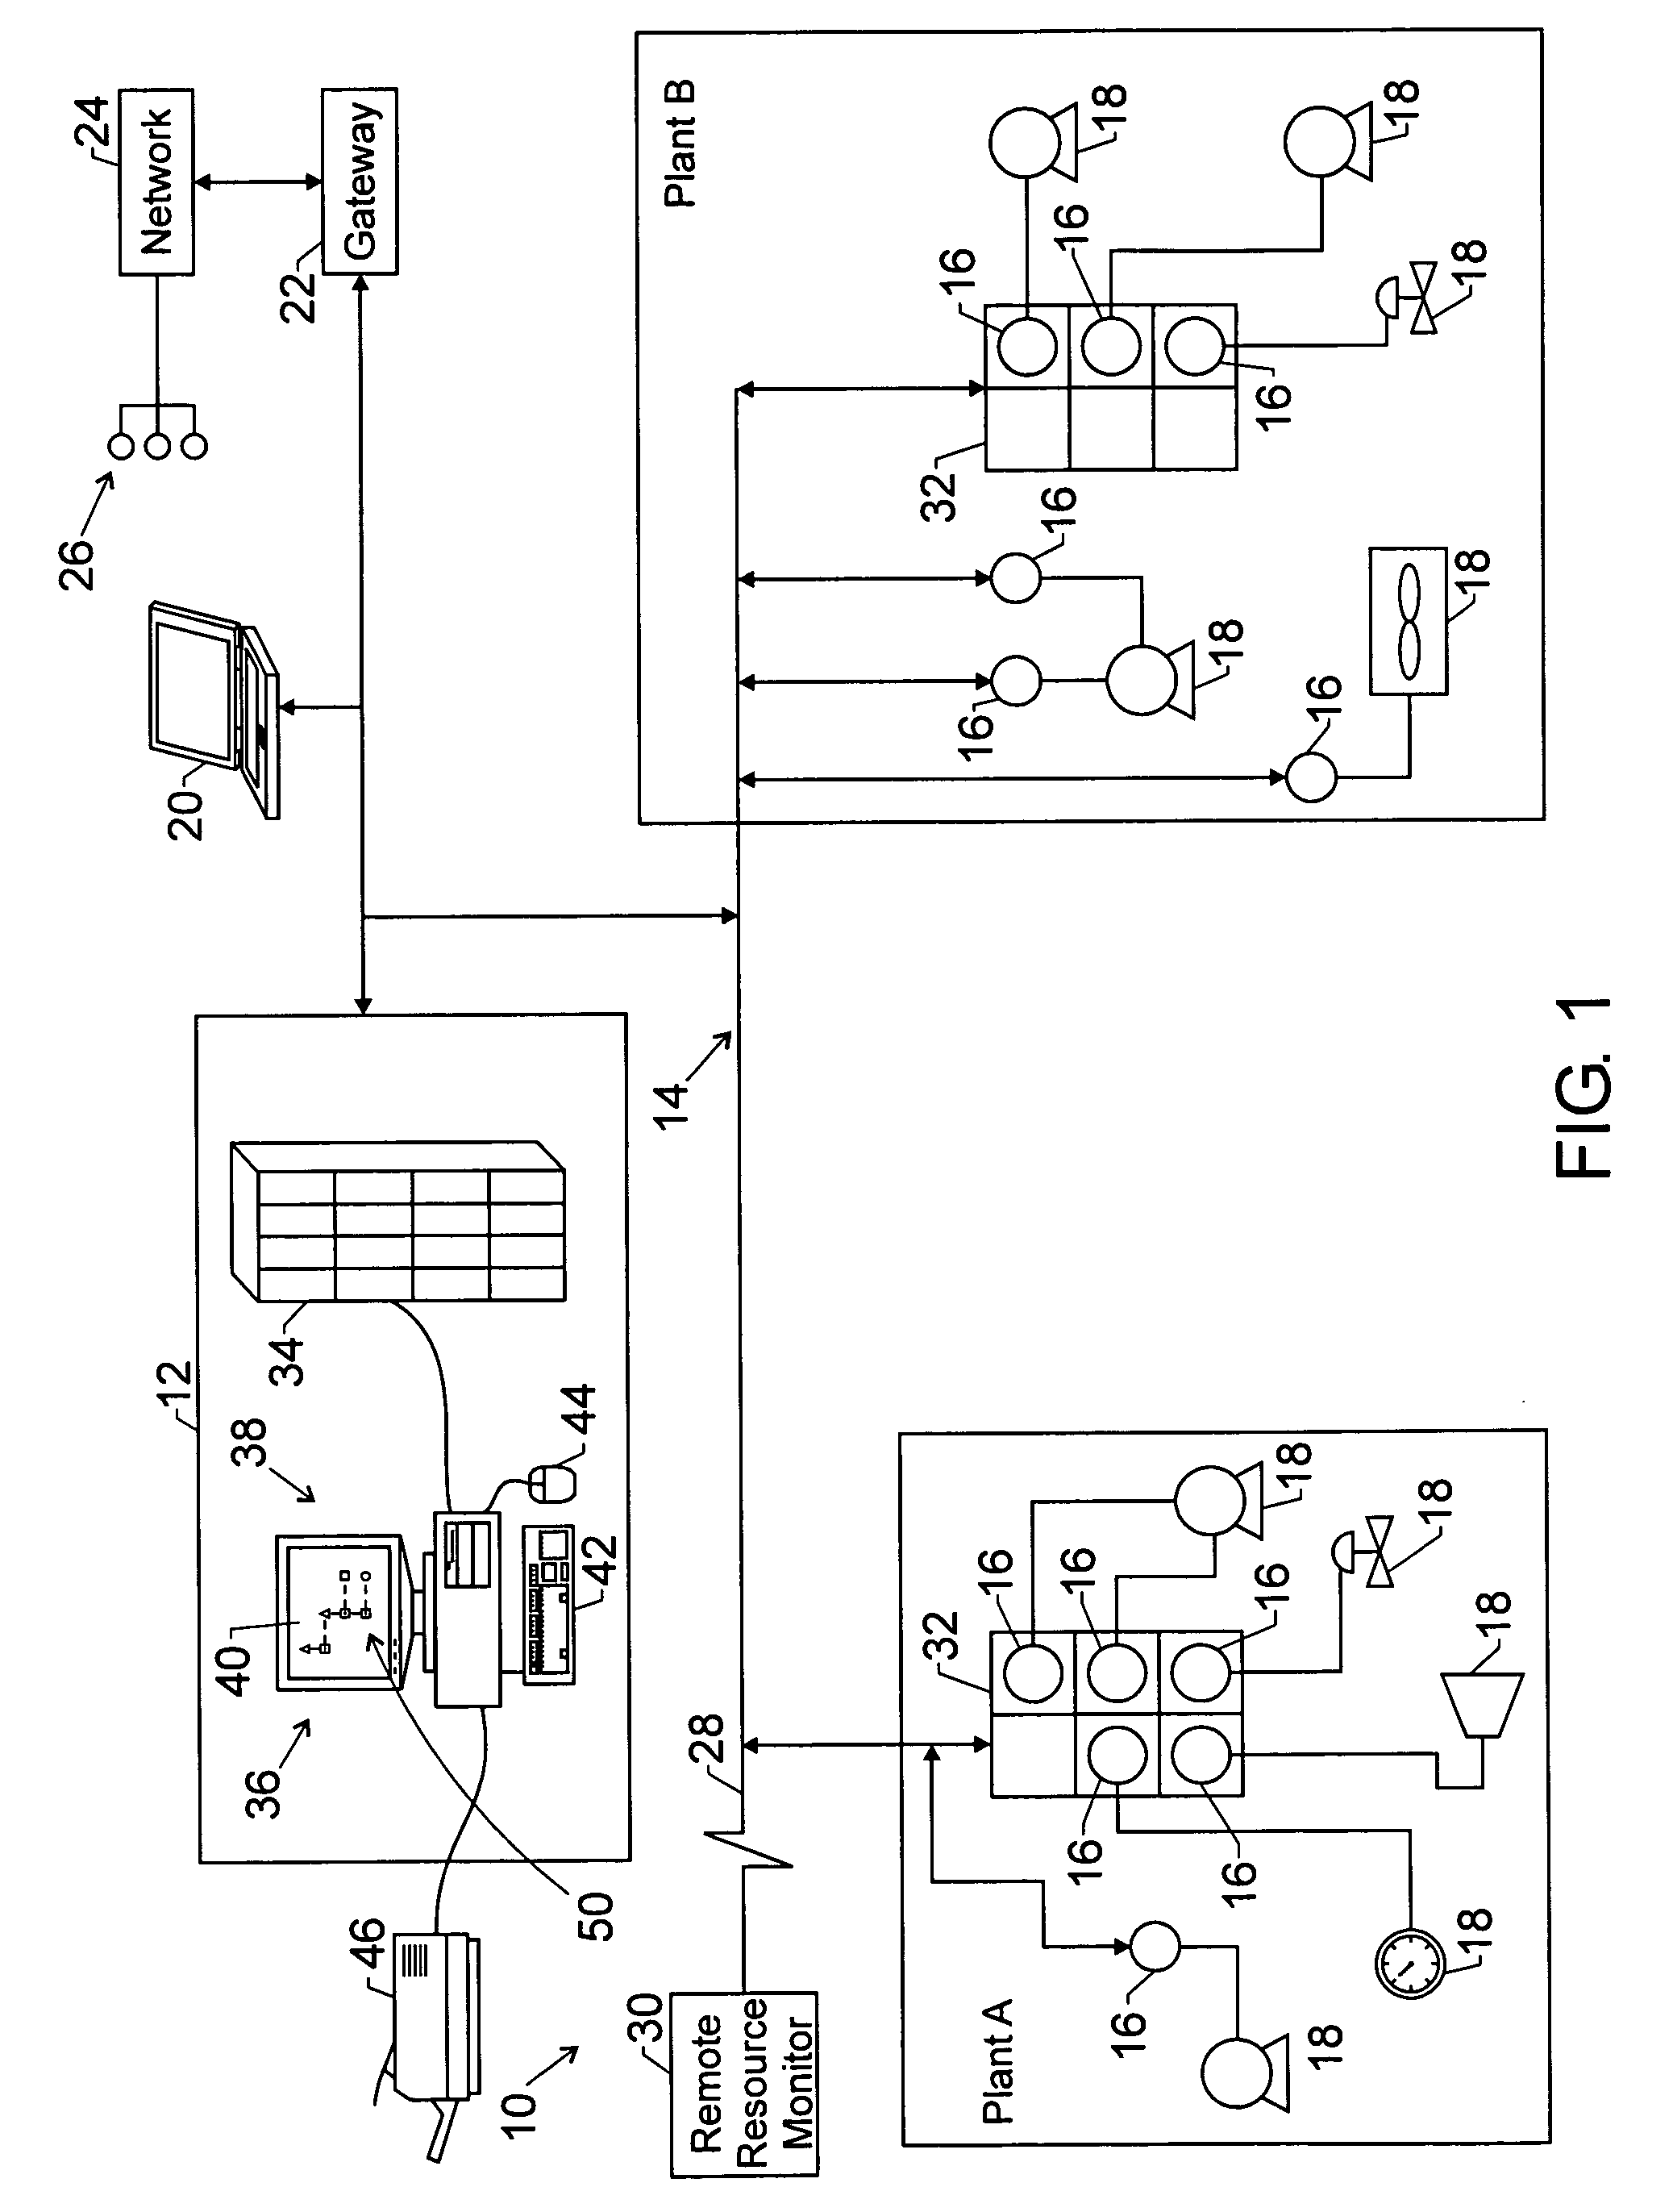
[0015] Embodiments of the present invention relate generally to the field of networked control and monitoring systems, such as those used in industrial automation. It should be noted, however, that the invention is not intended to be limited to this or any particular setting. More particularly, embodiments of the present invention relate to a system and method for providing system views of such control and monitoring systems. A system view may be described as a graphical interface that provides a user with information relating to a networked system through a graphical display. For example, a system view may comprise graphics displayed on a computer monitor that provide an interactive, real time, display of input data from external devices. System views, in accordance with the present invention, may include various different dynamic data and graphic presentations relating to networked component characteristics. For example, a system view may illustrate aspects relating to a system su...


PUM


Abstract

Embodiments of the present invention relate to a system and method of industrial control and monitoring status visualization. In accordance with embodiments of the present techniques, a system view for a networked system may be provided comprising an expandable component tree. The expandable component tree may comprise at least one parent icon and at least one child icon, wherein the parent icon is expandable to reveal the child icon and the child icon is associated with a networked component of the networked system. A first dynamic graphic may be associated with the child icon, wherein the first dynamic graphic is adapted to change based on changes relating to a status of the networked component. Further, embodiments of the present techniques comprise a sorting system adapted to pass the first dynamic graphic up the expandable component tree based on a configuration of the sorting system, to a second dynamic graphic associated with the parent icon.

Description

BACKGROUND [0001] The present invention relates generally to the field of networked control and monitoring systems, such as those used in industrial and commercial settings. More particularly, the invention relates to techniques for visualizing the status of associated equipment and systems in an efficient and intuitive manner. [0002] Control and monitoring systems may include large numbers of components at disparate locations, interconnected in many different ways, depending upon the type of process being carried out and the type of oversight desired. Such systems may include, for example, motors, valves, material handling equipment (e.g., conveyors, stackers, pumps, etc.) to mention only a few. Moreover, the equipment will typically be networked in groups of components by function and / or location. The resulting overall structure can be extremely complex, making oversight and troubleshooting the equipment, in the event of faults or needed maintenance, very problematical. [0003] Net...

Claims


Application Information

Patent Timeline
IPC IPC(8): G06F19/00G05B13/02G05B15/02
CPCG05B23/027G05B23/0216
Inventor RETLICH, KEVIN A.
Owner ROCKWELL AUTOMATION TECH
Why Eureka
Try Eureka