
Method and system for determining parameter distribution, variance, outliers and trends in computer systems

a computer system and parameter distribution technology, applied in the field of empirical analysis of computer systems, can solve the problems of increasing difficulty in managing the ability to evaluate the parameters of computer systems, and affecting the performance of computer systems

Active Publication Date: 2008-01-17
CIRBA IP INC
View PDF5 Cites 11 Cited by
  • Summary
  • Abstract
  • Description
  • Claims
  • Application Information

AI Technical Summary

Problems solved by technology

As organizations grow and the necessary IT infrastructures also grow, the ability to evaluate parameters of computer systems becomes more and more difficult to manage.
Often, the parameters in a computer system become very different from other computer systems, resulting in problems ranging from downtime to poor performance.

Method used


Image

  • Method and system for determining parameter distribution, variance, outliers and trends in computer systems
  • Method and system for determining parameter distribution, variance, outliers and trends in computer systems
  • Method and system for determining parameter distribution, variance, outliers and trends in computer systems

Examples


Embodiment Construction

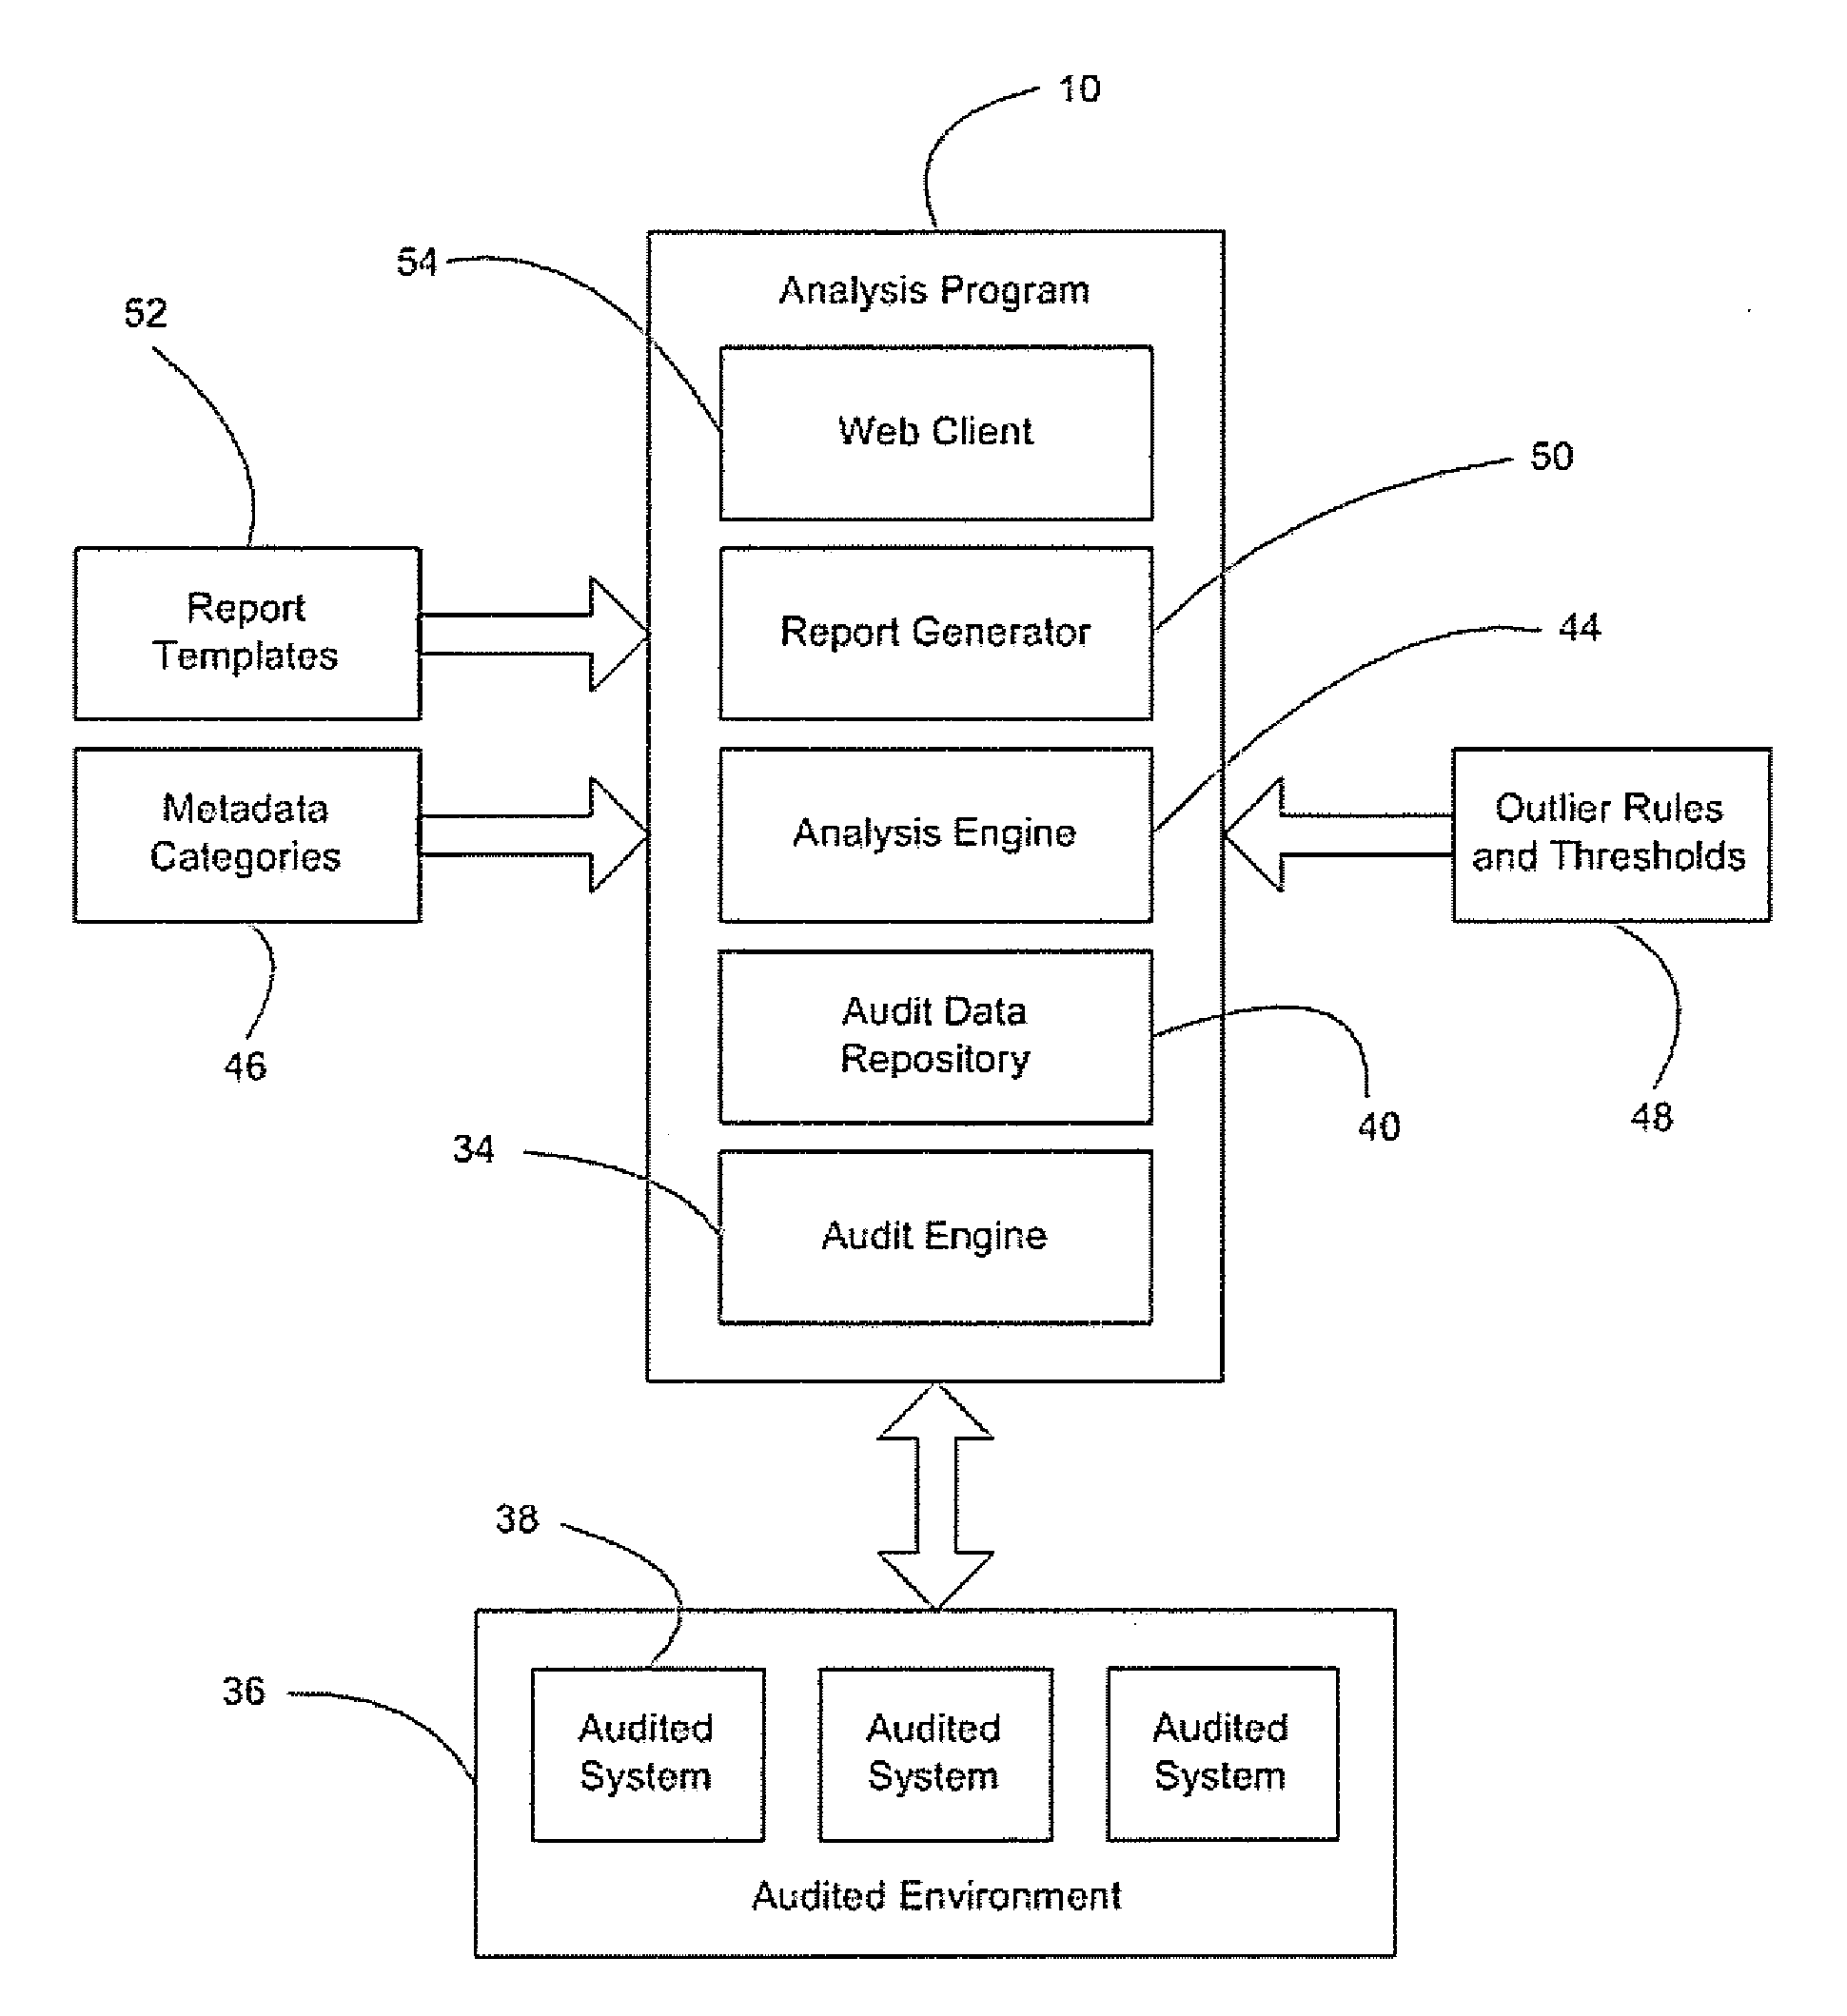
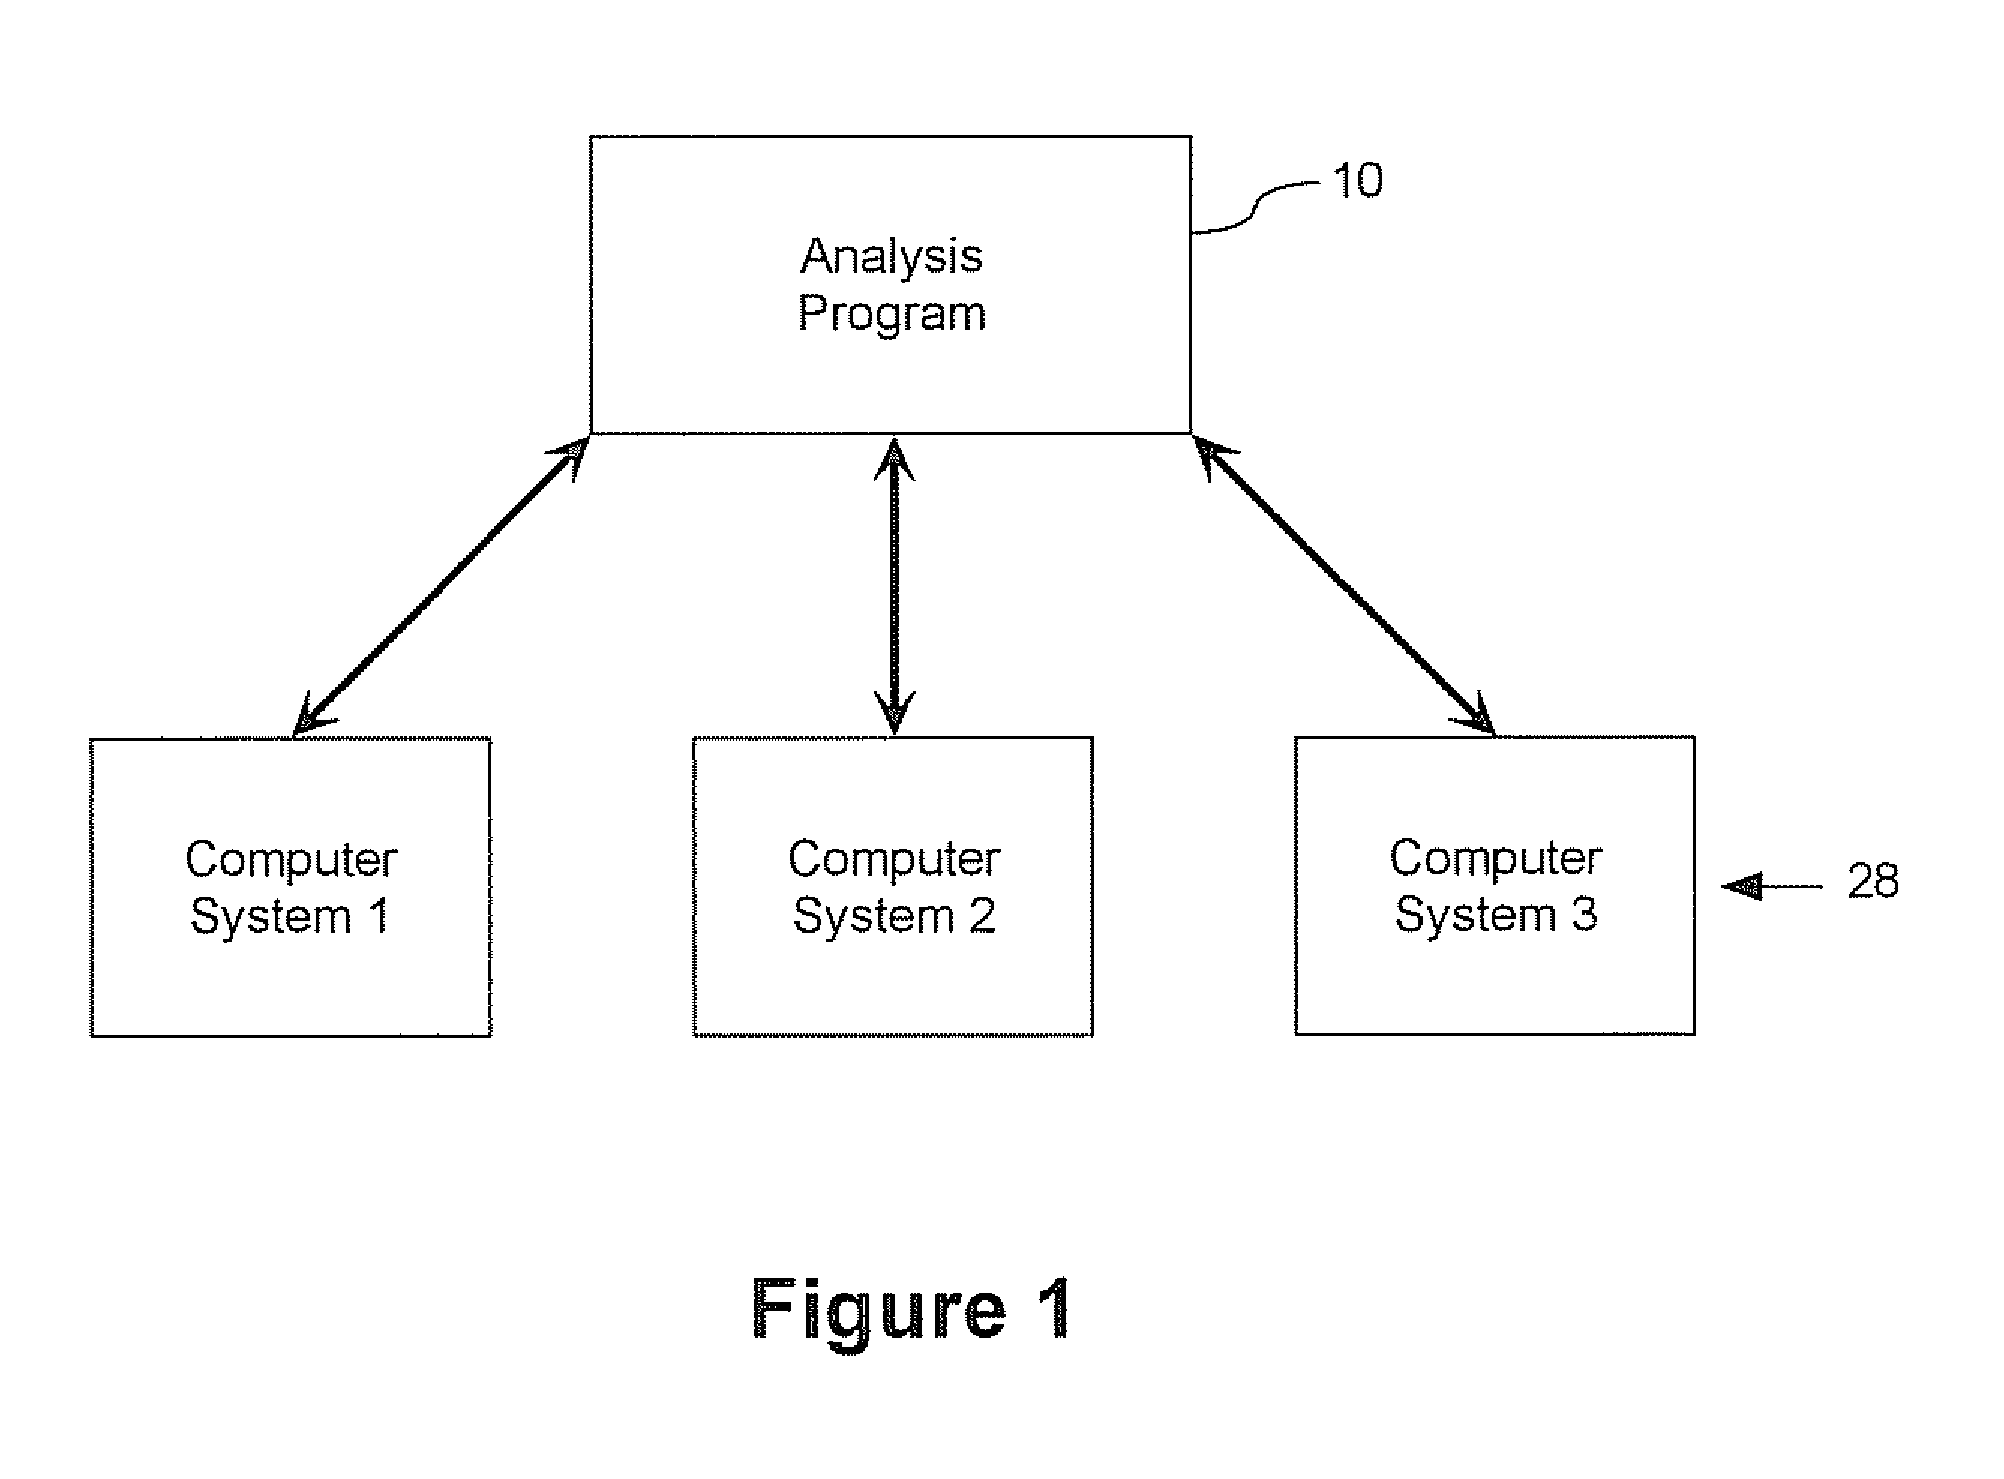
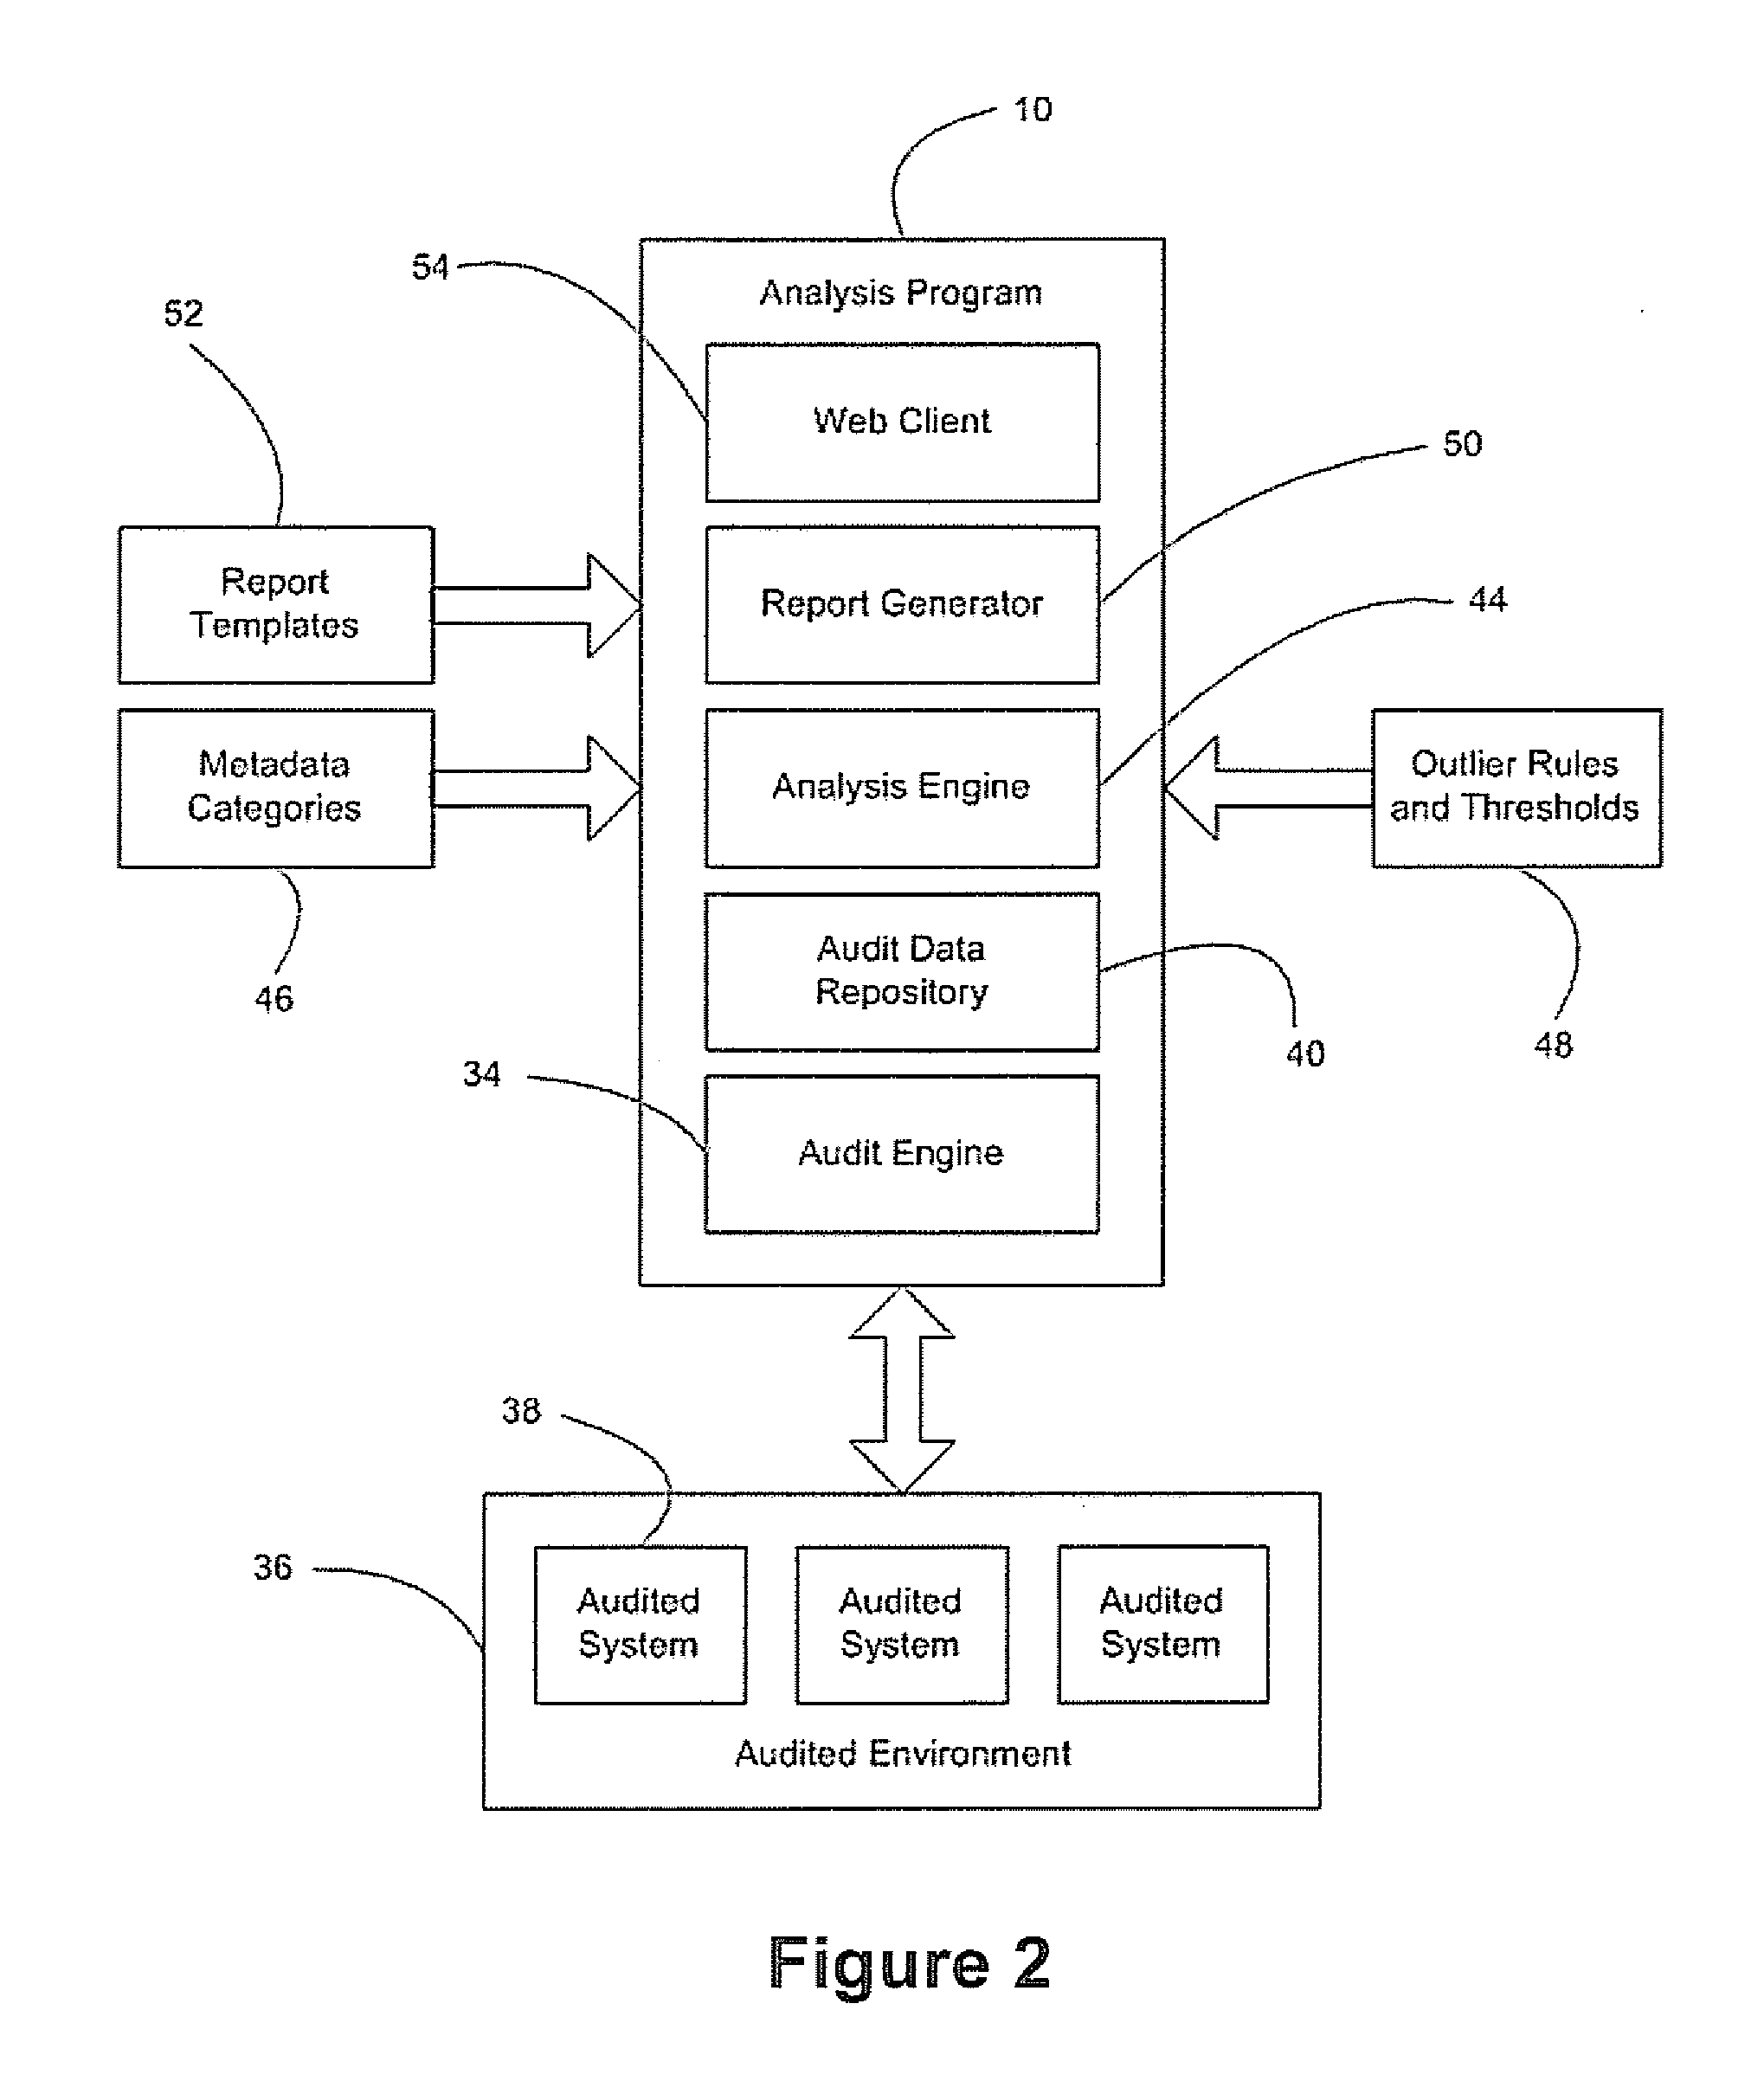
[0041]Referring to FIG. 1, an analysis program 10 collects data from a set of computer systems 28 (3 are shown in FIG. 1 as an example). The computer systems 28 may be physical systems or virtual systems. The analysis program 10 builds a statistical model from the collected data and generates reports showing the distribution, variance, outliers, and trends of the parameters across the analyzed systems 28. A distinct data set is preferably obtained for each system 28.

[0042]Each data set comprises one or more parameters that relates to characteristics or features of the respective system 28. The parameters can be evaluated by scrutinizing program definitions, properties, objects, instances and any other representation or manifestation of a component, feature or characteristic of the system 28. In general, a parameter is anything related to the system 28 that can be evaluated, quantified, measured, compared etc.

[0043]For the following description, a general evaluation of differences be...


PUM


Abstract

A system and method for generating statistical reports showing distribution, variance, outliers and trends for parameters across a set of computer systems is provided. The reports are generated based on audited data for each system that pertains to the parameters. A distribution report assesses the uniformity of the parameters of a population of systems and provides frequency distributions and statistics describing the data values from the analyzed systems. A variance report assesses the conformity of one or more target systems against a reference data set comprised of a set of baseline systems. The report compares each target system individually against the reference data set to measure the consistency of the target's parameters. A trend report shows trends in the uniformity and conformity measures of the parameters by comparing the statistical analysis results of sets of systems at two or more points in time or the different systems at the same time.

Description

[0001]This application claims priority from U.S. provisional patent application No. 60 / 805,701 filed Jun. 23, 2006.FIELD OF THE INVENTION[0002]The present invention relates to the empirical analysis of computer systems and has particular utility in determining and visualizing the distribution, variance, outliers and trends of parameters and characteristics across a set of computer systems.DESCRIPTION OF THE PRIOR ART[0003]The operation and behaviour of devices that utilize computing power such as servers, personal computers, laptops, personal digital assistants (PDA) etc., depend on thousands of parameters related to the operating system, hardware devices, software applications, patches, etc. Such devices often require configuration updates, hardware upgrades, patches and security features that can chance on a periodic basis.[0004]For computing devices to function effectively and communicate with each other and the supporting infrastructure, they should be compatible and up to date....

Claims


Application Information

Patent Timeline
Patent Type & Authority Applications(United States)
IPC IPC(8): H02G11/02
CPCG06Q10/10G06Q10/06
Inventor HILLIER, ANDREW D.YUYITUNG, TOM
Owner CIRBA IP INC
Learn More