Automated Capacity Provisioning Method Using Historical Performance Data

a technology of historical performance data and automatic provisioning, applied in the direction of multi-programming arrangements, program control, instruments, etc., can solve the problems of not receiving direct feedback, prior art capacity planning tools do not provide direct input to provisioning tools, and direct output from prior art capacity planning tools would not be usable by prior art provisioning tools

Active Publication Date: 2008-03-06
BMC SOFTWARE
View PDF3 Cites 135 Cited by
  • Summary
  • Abstract
  • Description
  • Claims
  • Application Information

AI Technical Summary

Benefits of technology

[0005] In accordance with one embodiment, an automated system manages and provisions a computer system, which can be a physical or virtual enterprise system. During operation, the automated system obtains performance data pertaining to the computer system's processing nodes (e.g., servers), which are partitioned into partitions. Performance data can include, inter alia, a performance rating and measured utilization values for each of the computer system's processing nodes. Performance data can also include measurements of actual service levels, such as response times, workloads, throughputs (units of work per unit of time), etc.
[0006] From the performance data related to performance rating and utilization values, for example, the automated system normalizes a utilization value for each of the processing nodes over a period of time and generates a weighted average for each utilization value. Also during operation, the automated system receives service level objectives (SLO) for the computer system and automatically determines provisioning policies based on these SLOs. For example, automated system can automatically determined provisioning policies using the received SLOs and the weighted average normalized utilization values determined from the performance data automatically determines provisioning policies. In such an example, the provisioning policies can thereby indicate desired outcome service level information, such as a number of processing nodes required to meet the SLOs, an arrival value (e.g., throughput) for transactions to each of the processing nodes, and a potential service level for each of the processing nodes.
[0007] Based on the provisioning policies, the automated system automatically provisions at least some of the processing nodes across the partitions to load balance the system's capacity. As used herein, provisioning the processing nodes by the automated system can include such actions as sending, routing, directing, or distributing system transactions to the processing nodes (e.g., servers) and such actions as installing (removing) or activating (deactivating) processing nodes (e.g., servers) to process transactions. With the automatically generated policies and provisioning, the automated system is both proactive and reactive. Its proactive aspect generates policies based on analysis of current and historical information, and its reactive aspect analyzes current and historical information and reacts accordingly using the generated policies.

Problems solved by technology

Unfortunately, prior art capacity planning tools do not provide direct input to provisioning tools, nor do they receive any direct feedback from the provisioned computer system that could be used to validate or adjust the system's configuration.
Instead, users have to translate performance information, such as reports and graphs, into system recommendations and then input those recommendations into the provisioning tool for execution because direct output from the prior art capacity planning tool would not be usable by the prior art provisioning tool.
Due to these problems, prior art provisioning tools provision a computer system based merely on user-inputted rules or on rule of thumb.
Moreover, prior art provisioning tools rely on policies that are static and that may or may not reflect historical demands of the computer system for resources.

Method used


Image

  • Automated Capacity Provisioning Method Using Historical Performance Data
  • Automated Capacity Provisioning Method Using Historical Performance Data
  • Automated Capacity Provisioning Method Using Historical Performance Data

Examples


Embodiment Construction

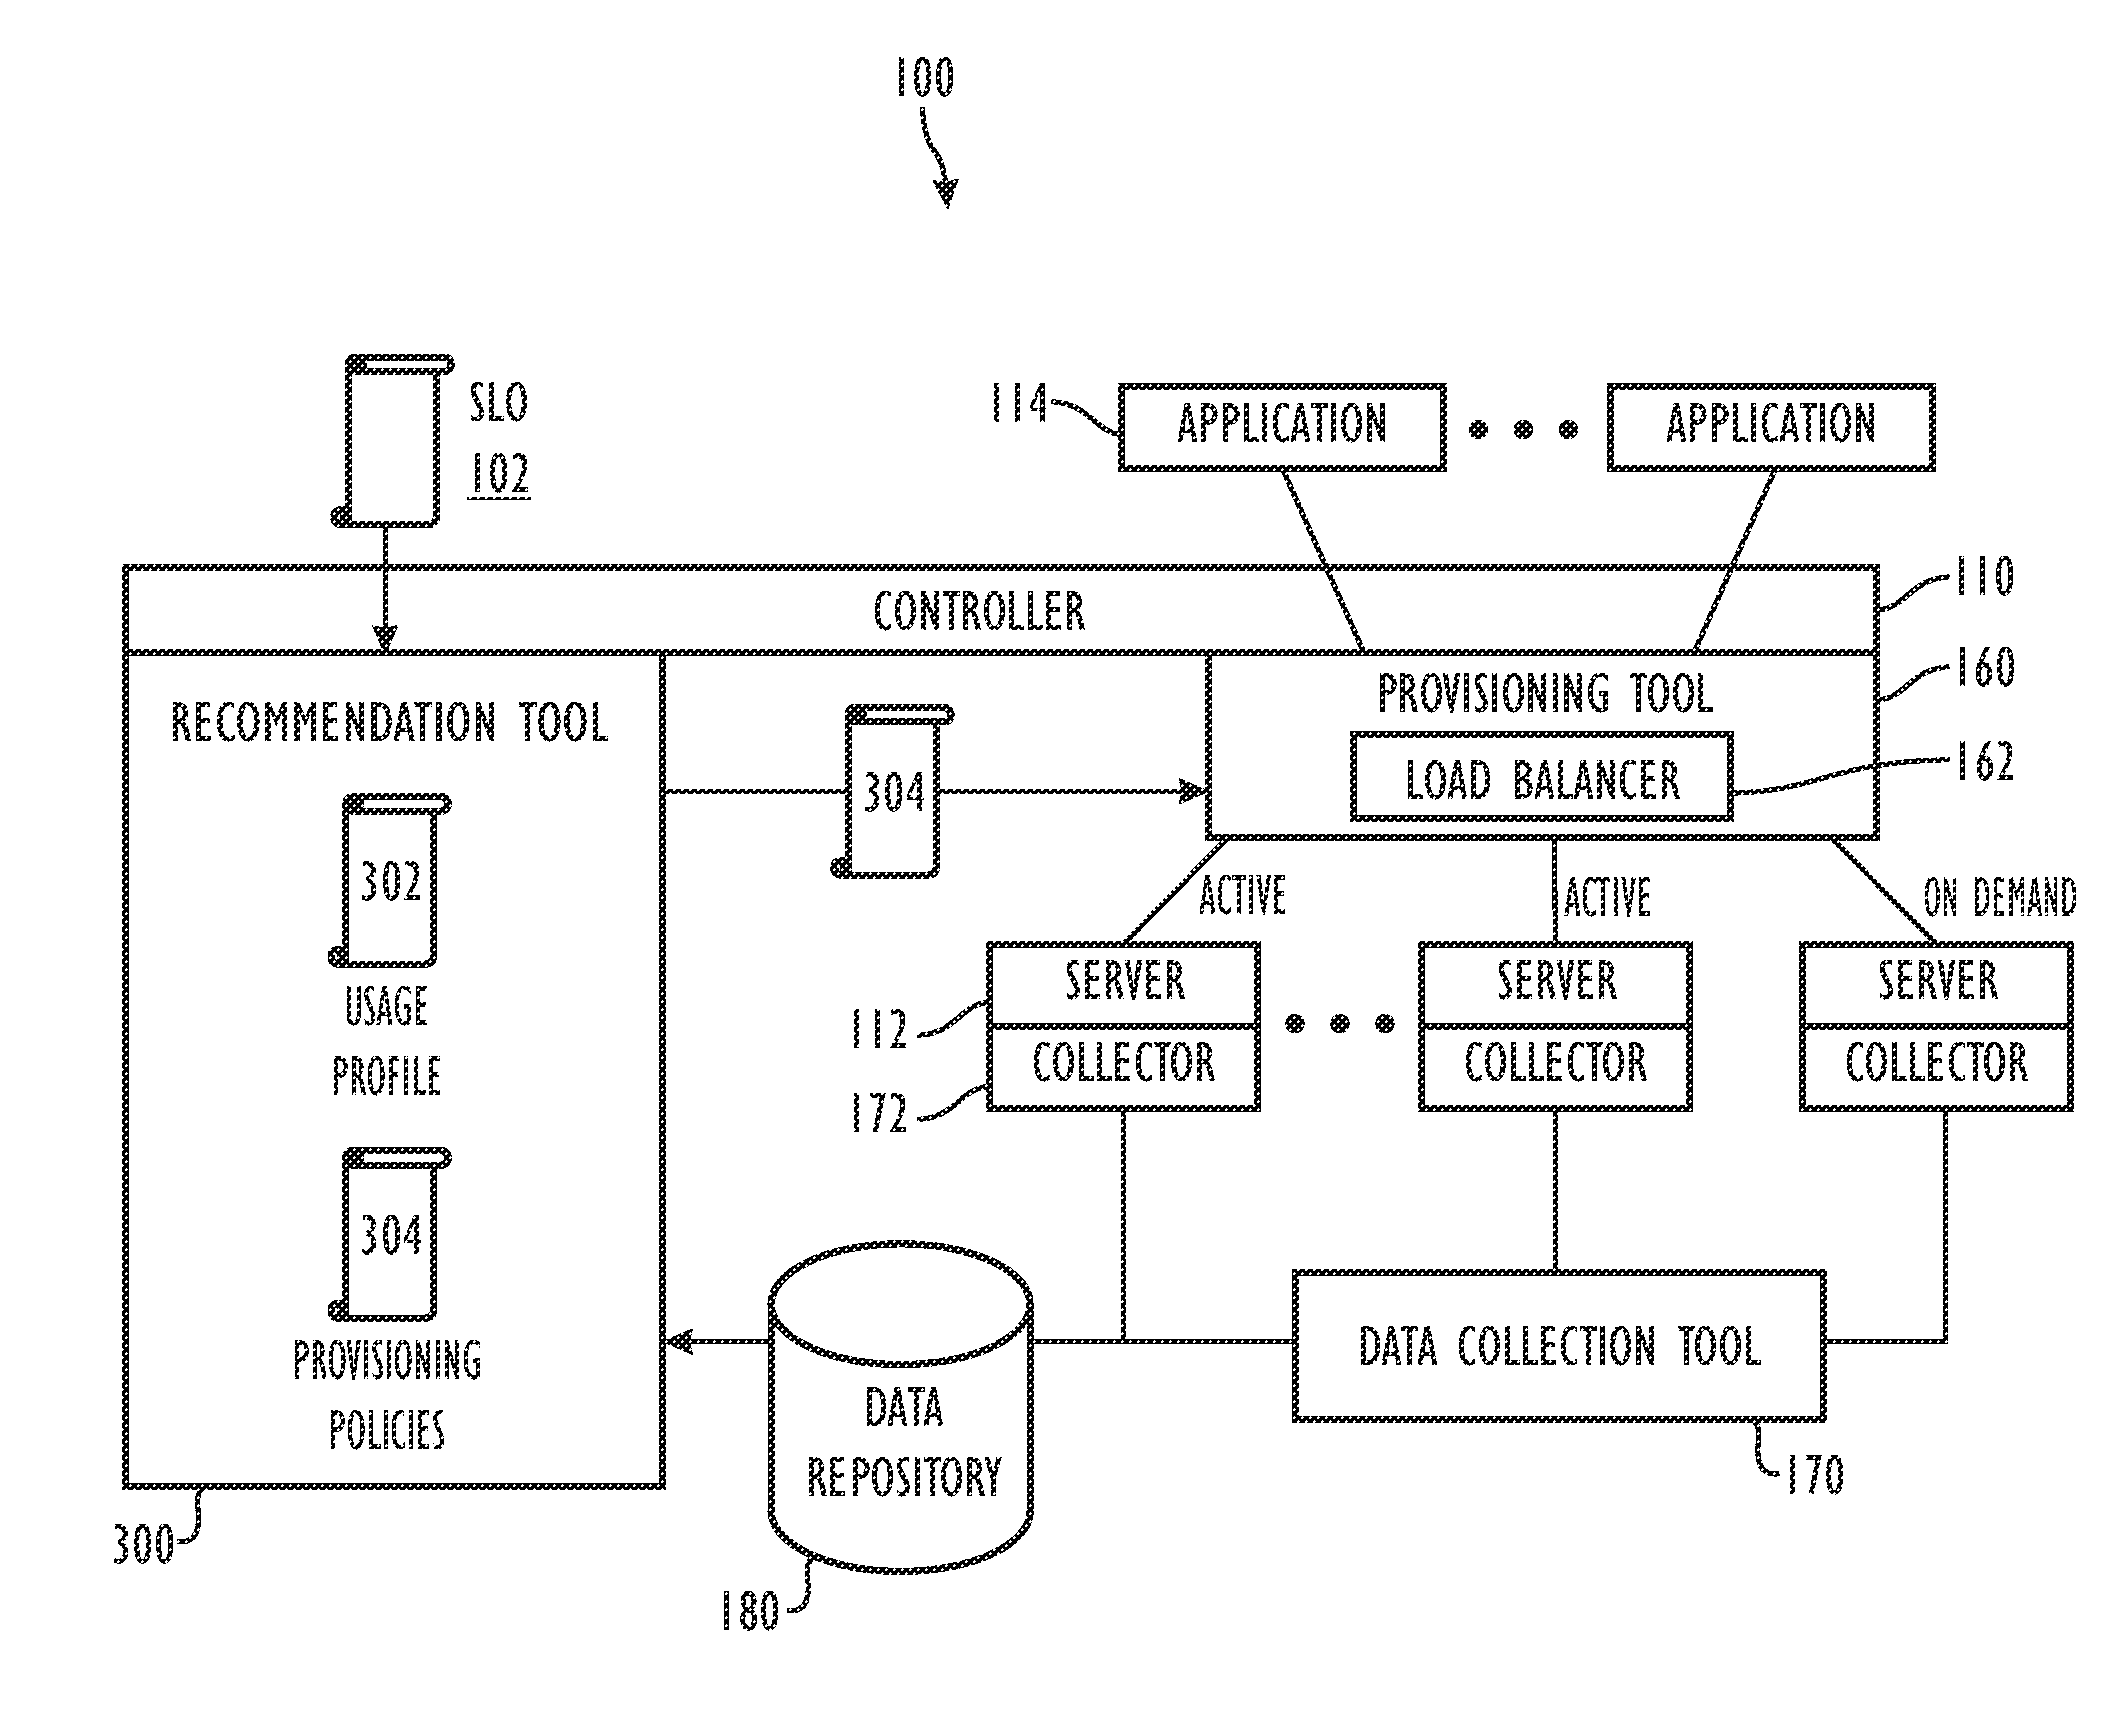
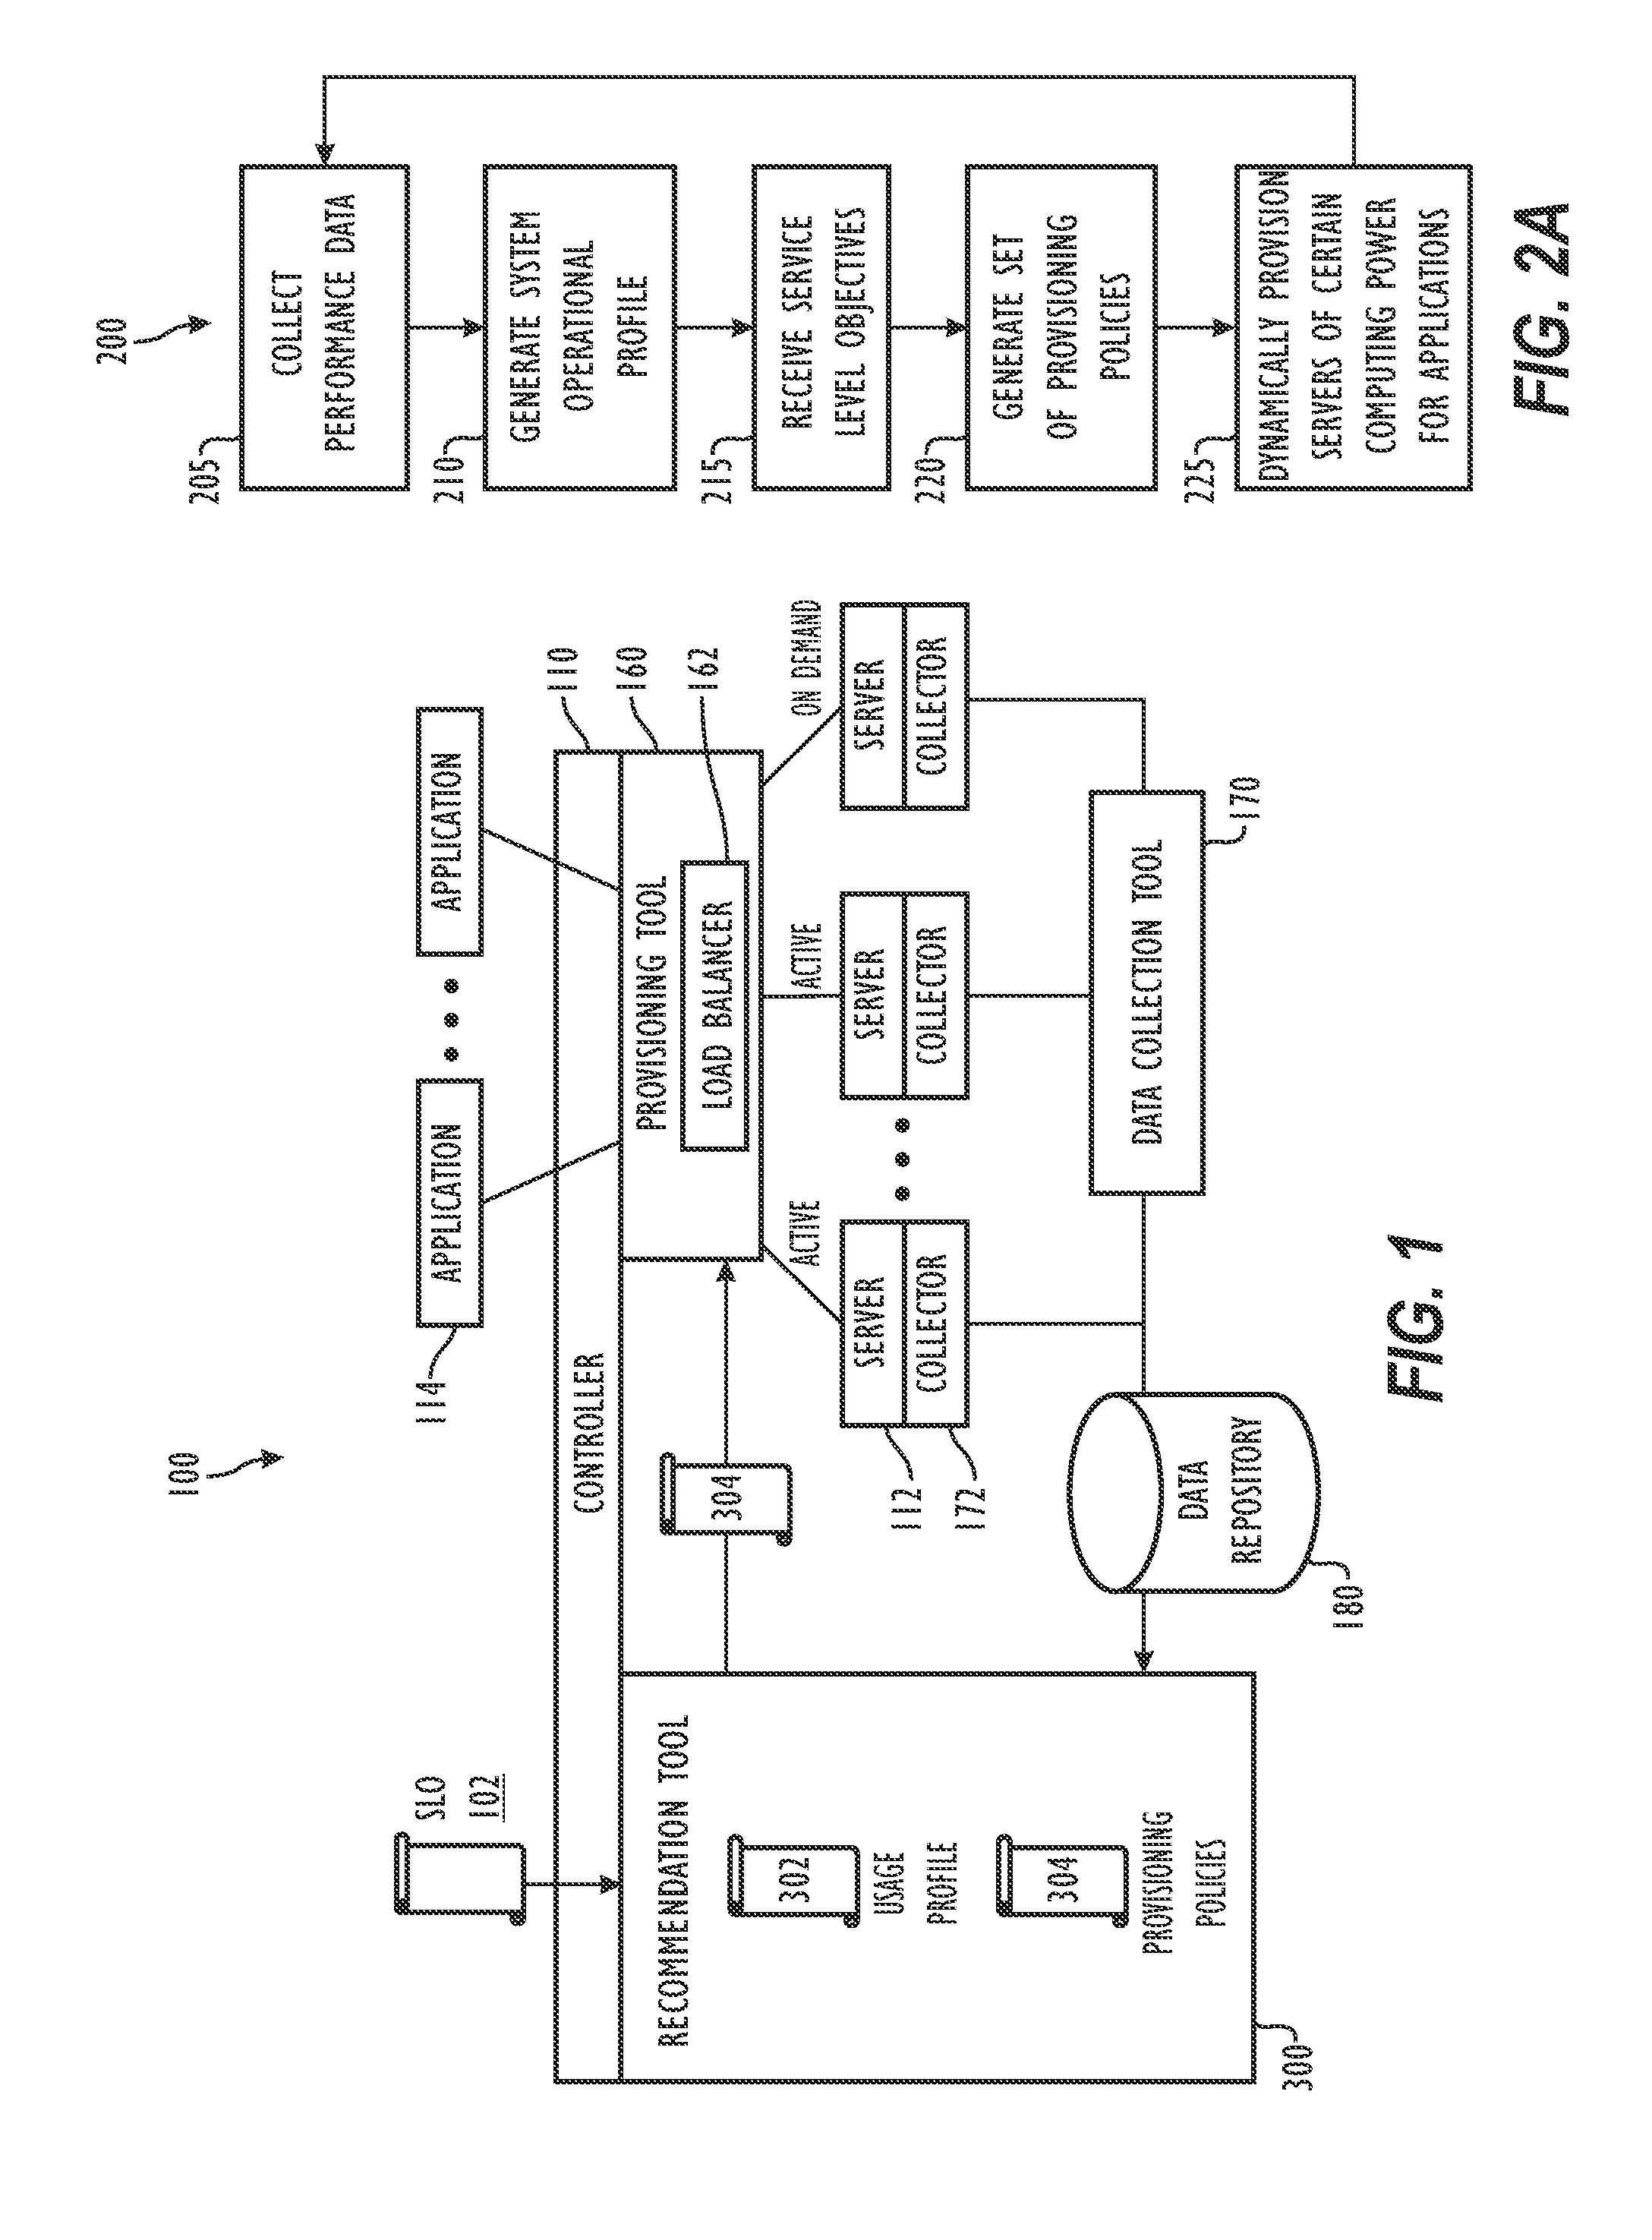
[0016]FIG. 1 illustrates one embodiment of an automated capacity provisioning system for a computer system 100. The provisioning system includes a recommendation tool 300, a provisioning tool 160, a data collection tool 170, and a data repository 180. In general, computer system 100 can be a network system, an enterprise system, or the like and can include various system components, such as workstations, computer servers, applications, storage devices, network connections, and other conventional components. For the sake of illustration, computer system 100 is schematically illustrated in FIG. 1 as having a controller 110 relative to a plurality of servers 112 and applications 114. Controller 110 can comprise one or more servers or other computing devices and can execute one or more of recommendation tool 300, provisioning tool 160, and data collection tool 170.

[0017] As discussed below, recommendation tool 300 automatically provides provisioning policies 304 to automatically manage...


PUM


Abstract

An automated system obtains performance data of a computer system having partitioned servers. The performance data includes a performance rating and a current measured utilization of each server, actual workload (e.g. transaction arrival rate), and actual service levels (e.g. response time or transaction processing rate). From the data, automated system normalizes a utilization value for each server over time and generates a weighted average for each and expected service levels for various times and workloads. Automated system receives a service level objective (SLO) for each server and future time and automatically determines a policy based on the weighted average normalized utilization values, past performance information, and received SLOs. The policy can include rules for provisioning required servers to meet the SLOs, a throughput for each server, and a potential service level for each server. Based on the generated policy, the system automatically provisions operation of the servers across partitions.

Description

CROSS-REFERENCE TO RELATED APPLICATIONS [0001] This is a non-provisional of U.S. Patent Application Ser. No. 60 / 824,240 filed 31 Aug. 2006, which is incorporated herein by reference in its entirety and to which priority is claimed.FIELD OF THE DISCLOSURE [0002] The subject matter of the present disclosure relates to a system and method for automatically provisioning the capacity of a computer system. BACKGROUND OF THE DISCLOSURE [0003] Capacity planning tools can be used to plan the capacity of a computer system and manage its performance. To do this, capacity planning tools focus on (1) identifying performance bottlenecks in the computer system and (2) providing “what-if” functionalities that can be used to evaluate performance implications of different hardware configurations of that system. Other tools referred to as system provisioning tools can be used to provision the computer system with the goal of setting up a configuration that is cost effective from a business perspective...

Claims


Application Information

Patent Timeline
Patent Type & Authority Applications(United States)
IPC IPC(8): G06F9/46H04L47/80
CPCG06F9/505G06F2209/5019G06F2209/508H04L47/823H04L67/303H04L67/1001H04L47/83G06F3/0484G06F3/04847H04L43/0882H04L47/801
Inventor DING, YIPINGMARRON, ASSAFJOHANNESSEN, FRED
Owner BMC SOFTWARE
Why Eureka
Try Eureka