Method, interaction method and apparatus for visualizing hierarchy data with angular chart

a hierarchy data and angular chart technology, applied in the field of graph visualization techniques, can solve the problems of difficult to distinguish peripheral slices from each other, the user cannot have an efficient interaction method to customize the view, and the tree diagram cannot help users to easily have a direct sense of the department size of the company

Inactive Publication Date: 2008-12-11
IBM CORP
View PDF4 Cites 79 Cited by
  • Summary
  • Abstract
  • Description
  • Claims
  • Application Information

AI Technical Summary

Benefits of technology

[0007]The present invention is provided based on the above-mentioned technical problems and its purpose is to provide a method and apparatus for visualizing hierarchy data with an angular chart and an interaction method

Problems solved by technology

Comparing FIG. 2 with FIG. 3, it is apparent that the tree diagram can not help users to easily have a direct sense of department size of the company.
Thus, there are two problems when using the angular chart to visualize the hierarchy data: firstly, if the hierarchy data has more levels or more data units, the corresponding slices of the angular chart would b

Method used


Image

  • Method, interaction method and apparatus for visualizing hierarchy data with angular chart
  • Method, interaction method and apparatus for visualizing hierarchy data with angular chart
  • Method, interaction method and apparatus for visualizing hierarchy data with angular chart

Examples


Embodiment Construction

[0032]It is believed that the above-mentioned and other purposes, characteristics and advantages of the present invention would become more apparent through the detailed description of the embodiments of the present invention in conjunction with the drawings.

[0033]FIG. 4 shows a flow chart of a method for visualizing hierarchy data with an angular chart according to an embodiment of the present invention. The embodiment will be described in detail below in conjunction with the figure.

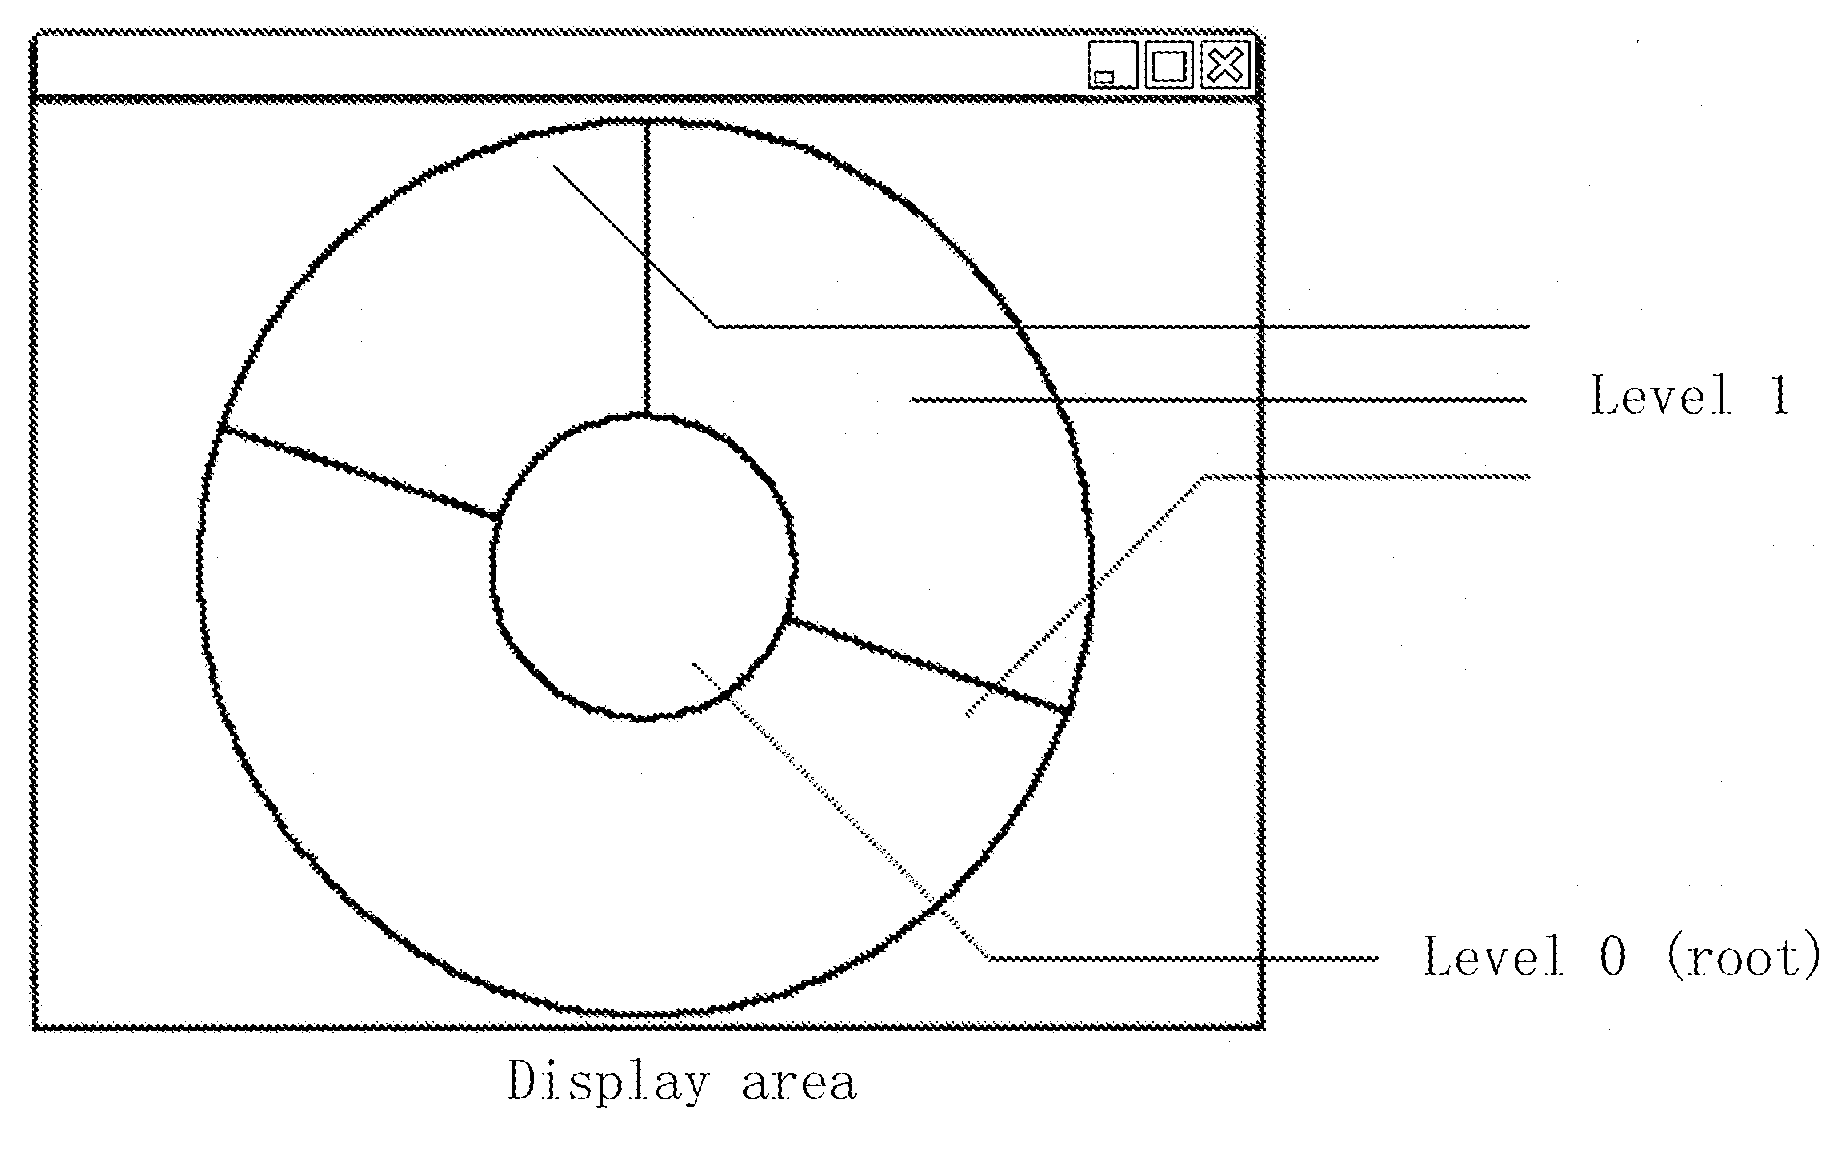
[0034]In this embodiment, in order to solve the problems in the prior art, the angular chart does not display the whole hierarchy data initially, but just displays some levels of the hierarchy data.

[0035]As shown in FIG. 4, at step 401, at least one of a plurality of levels of hierarchy data to be visualized is / are determined as base level(s). As mentioned above, the hierarchy data, such as company organization structure, file system and etc, comprise a plurality of levels and each level further compris...


PUM


Abstract

A method and apparatus for visualizing hierarchy data with angular chart are provided wherein the hierarchy data comprises a plurality of levels. The method comprises determining at least one of the plurality levels of the hierarchy data as base levels; visualizing data units in the base levels with the angular chart, wherein each slice of the angular chart corresponds to the data unit in the hierarchy data; and in response to user's operation on the slice of the angular chart, visualizing data units in at least next level of the data unit corresponding to the selected slice. The data units in each level of the hierarchy data can be visualized hierarchically and clearly, even if the hierarchy data has numerous levels and/or data units.

Description

TECHNICAL FIELD OF THE INVENTION[0001]The present invention relates to graphic visualization techniques in the computer field, and particularly relates to a method and apparatus for visualizing hierarchy data with an angular chart, and an interaction method and apparatus for angular chart visualization.BACKGROUND OF THE INVENTION[0002]Generally, data visualization processing can be implemented by using various views, such as tree diagrams, angular charts, histograms, etc.[0003]An angular chart is a circular or arc graph which is divided into sectors (slices) by radius, such as a pie chart, ring chart, sunburst chart, etc. Usually the angular chart is used to represent distribution of data quantity, such as a regional sales report, campaign approval rating or national population distribution. In the angular chart, each slice corresponds to a data unit, and the central angle thereof is proportional to the data quantity the slice represents. In addition, the angular chart can be extend...

Claims


Application Information

Patent Timeline
IPC IPC(8): G06F3/048
CPCG06T11/206
Inventor LIU, SHI XIALOU, XING HUASU, HUIYOUNG, HONESTY CHENG
Owner IBM CORP
Why Eureka
Try Eureka