

Automatic utility usage rate analysis methodology
a utility and usage rate technology, applied in the field of automatic utility usage rate analysis methodology, can solve the problems of not always accurate, subject to very subjective factors and human limitations, and labor intensiv
- Summary
- Abstract
- Description
- Claims
- Application Information
AI Technical Summary
Benefits of technology
Problems solved by technology
Method used
Image

Examples
Embodiment Construction
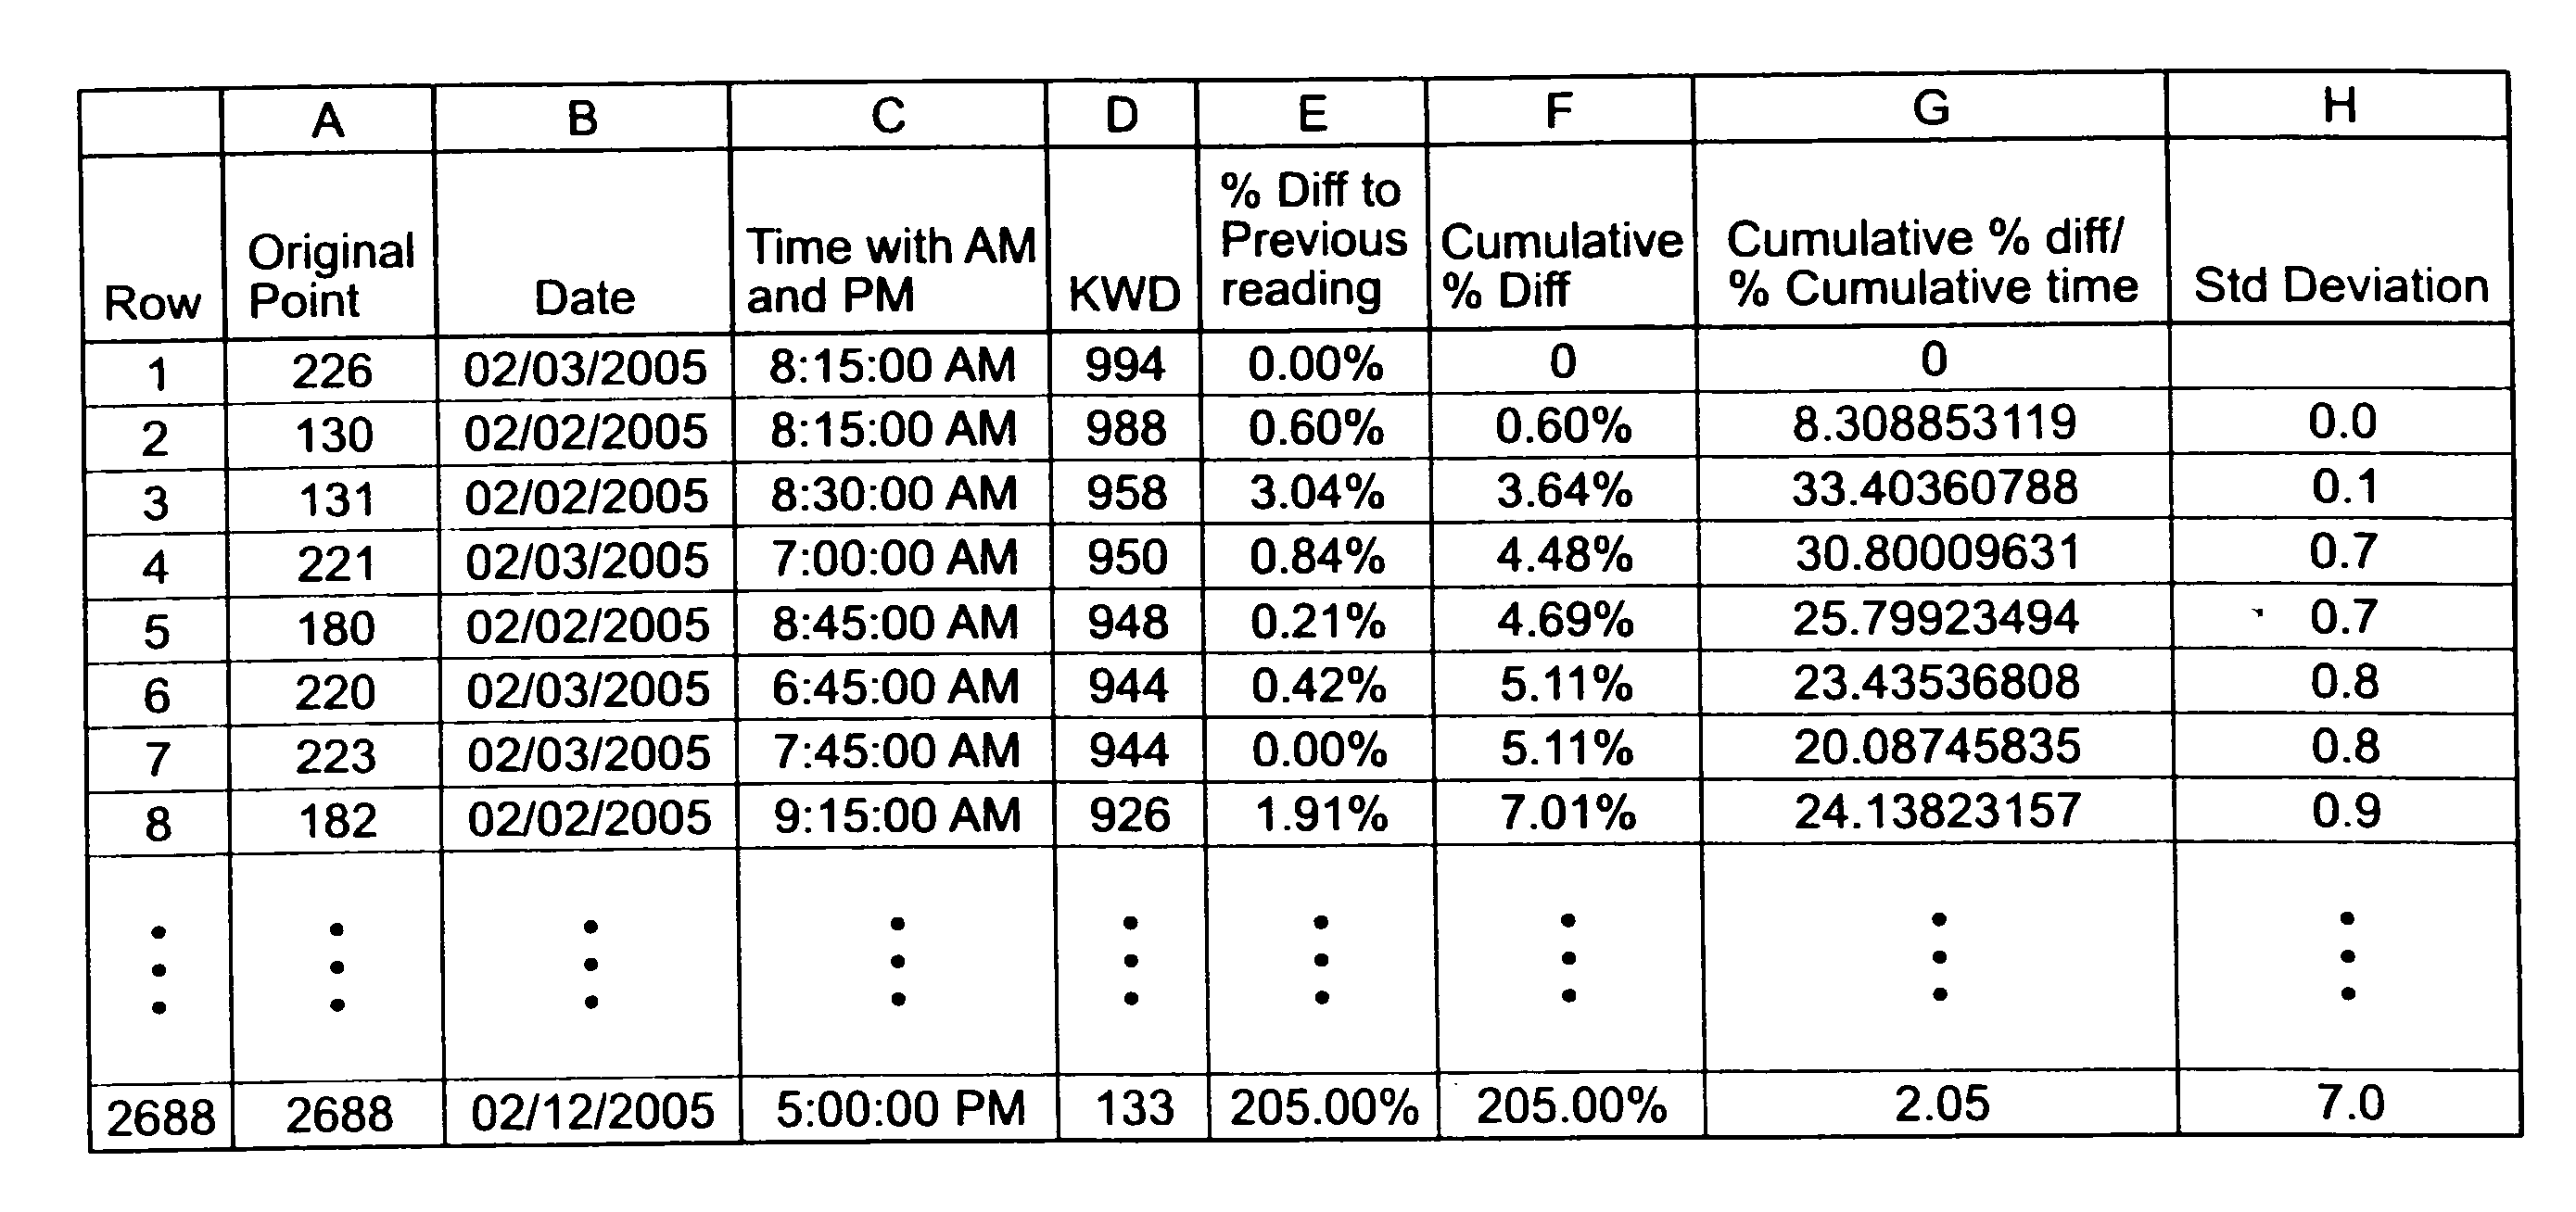
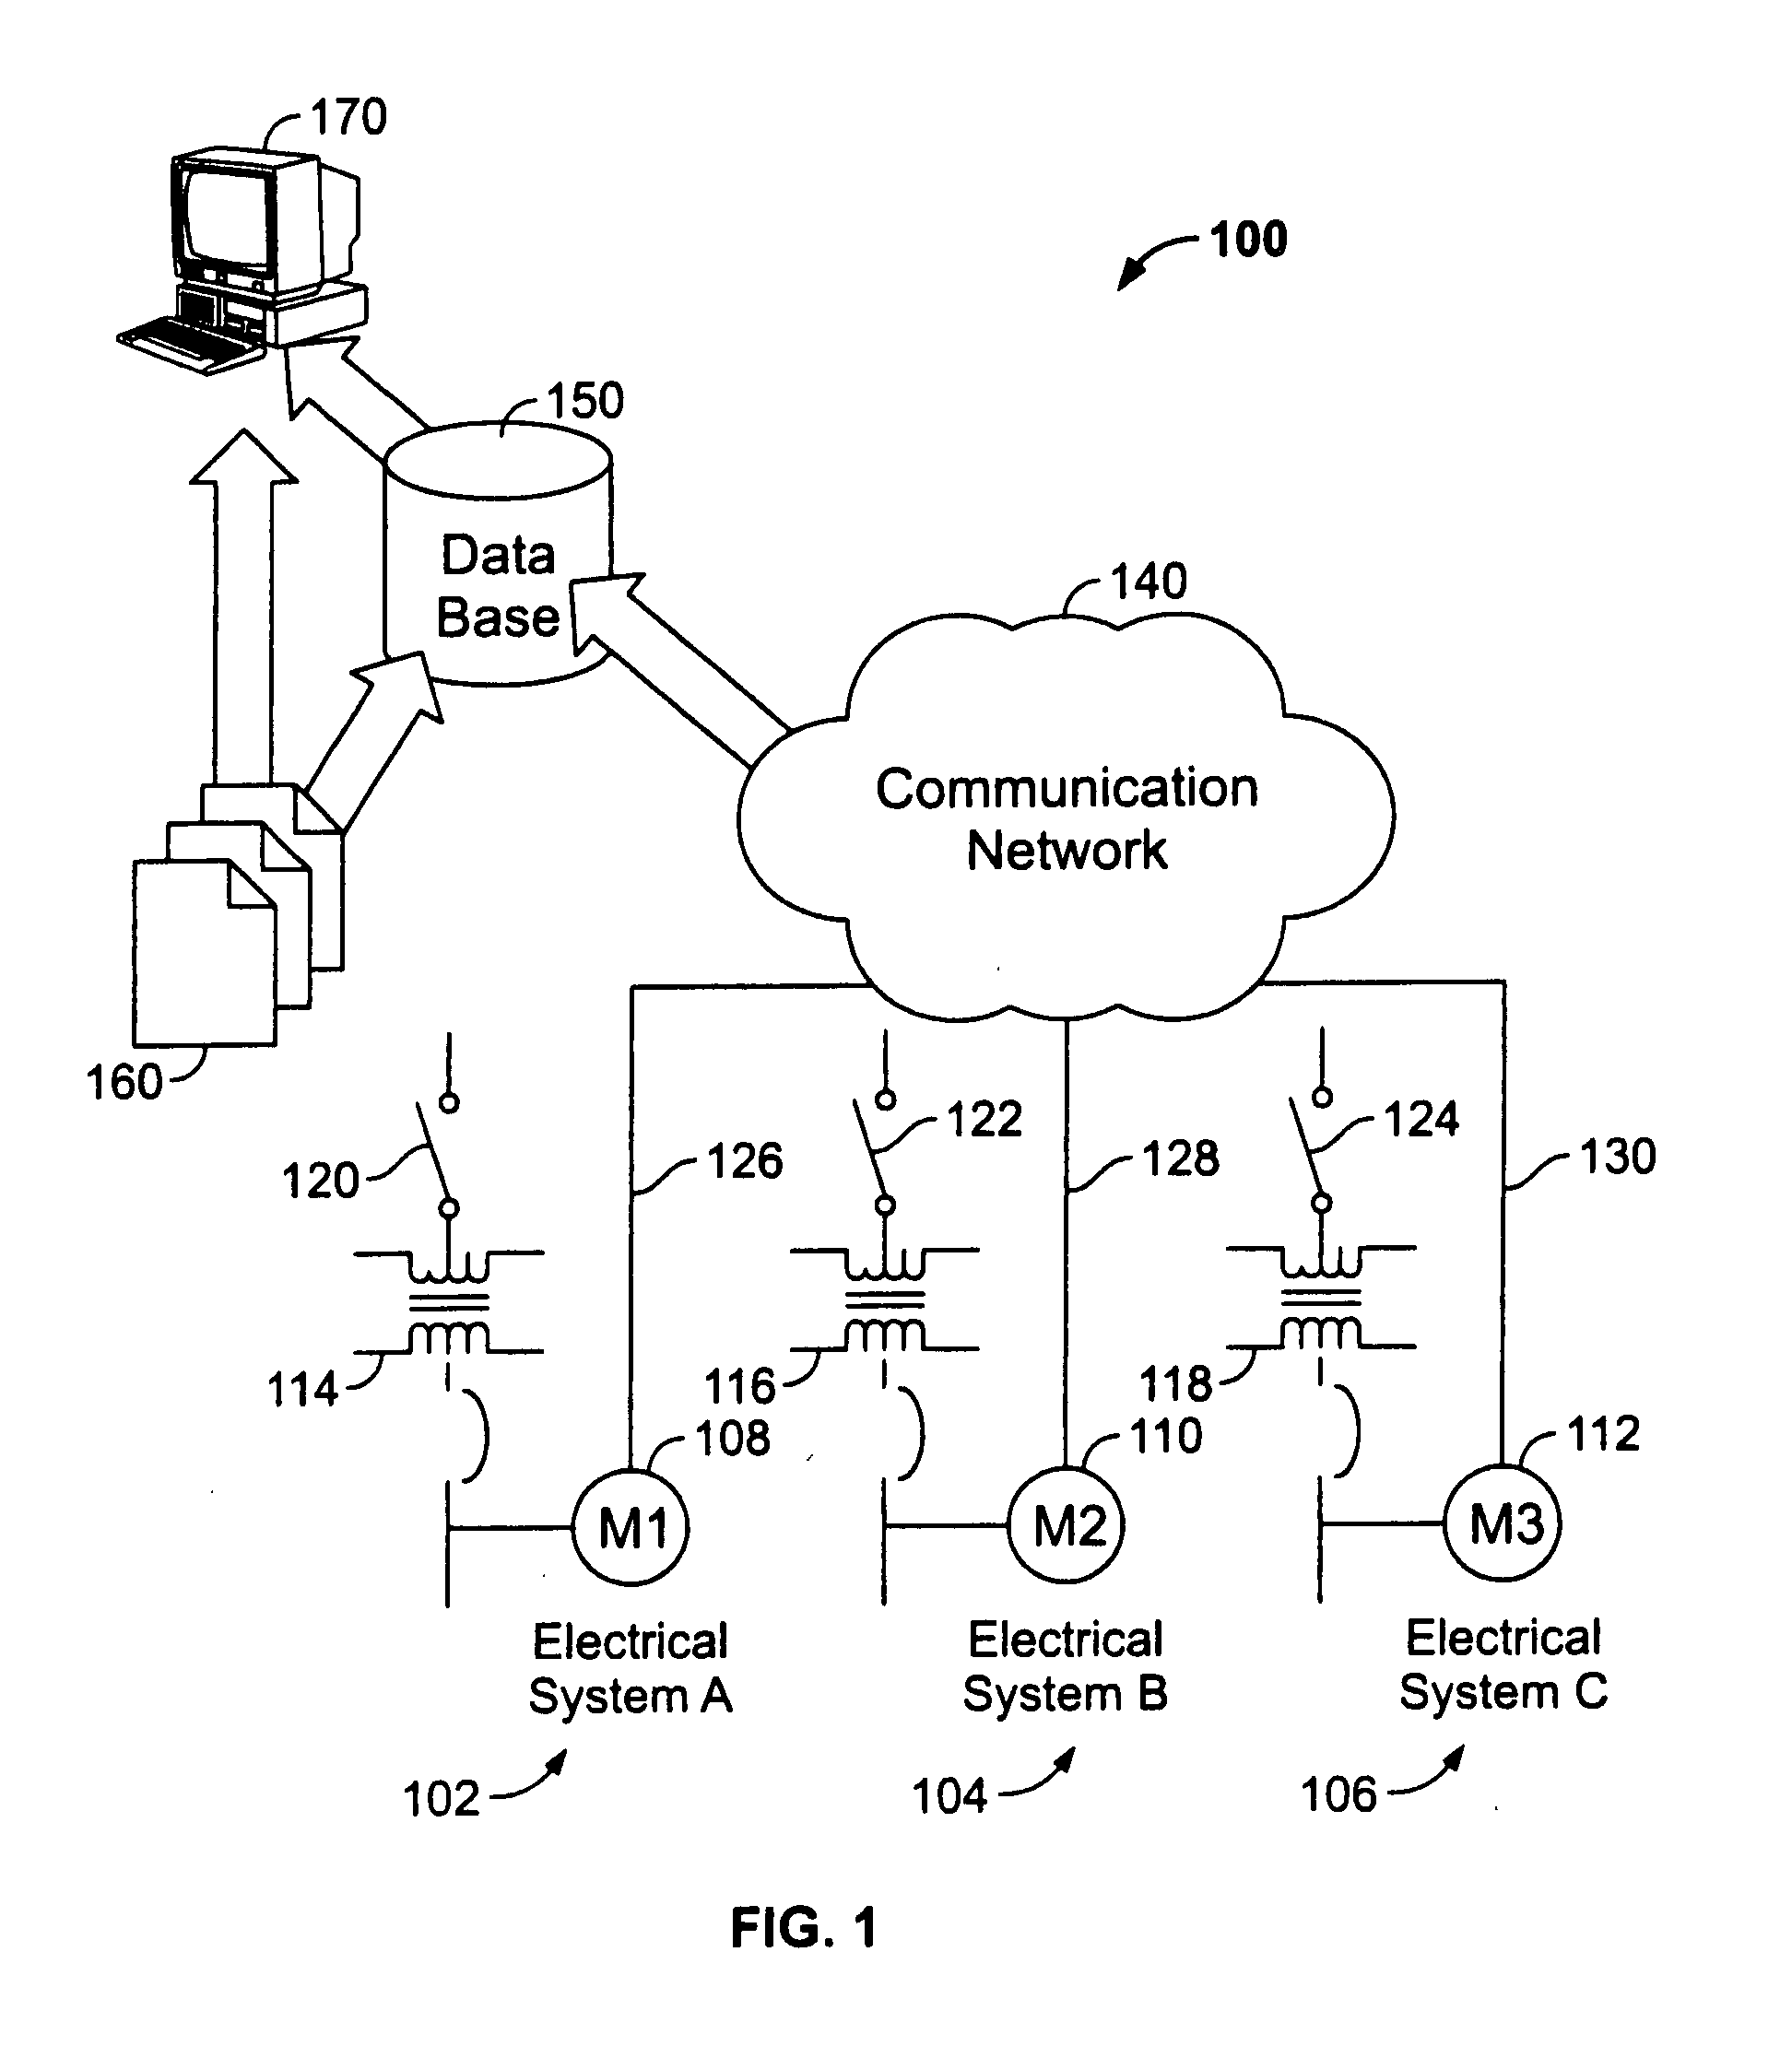
[0018]Turning now to FIG. 1, an exemplary utility monitoring system 100 is shown having a plurality of electrical systems 102, 104, 106, each having at least one power monitoring device 108, 110, 112 in communication with a communication network 140. Each electrical system 102, 104, 106 includes respective transformers 114, 116, 118 coupled to switches 120, 122, 124. A power monitoring device is an apparatus with the ability to sample, collect, or measure one or more electrical characteristics or parameters of the electrical systems 102, 104, 106. The power monitoring devices 108, 110, 112 may be a PowerLogic® CM4000T Circuit Monitor, a PowerLogic® Series 3000 / 4000 Circuit Monitor, or a PowerLogic® ION7550 / 7650 Power and Energy Meter available from Square D Company, for example.
[0019]Although the utility monitoring system 100 shown in FIG. 1 is a power monitoring system, aspects of the present invention are not limited to power monitoring systems, but rather are applicable to any sy...
PUM
 Abstract
Description
Claims
Application Information