Method and system for analyzing and presenting an Electroencephalogram (EEG)

an electroencephalogram and electroencephalogram technology, applied in the field of brain function monitoring, can solve the problems of excessive deep anesthesia, unreliable use, and excessive consumption of anesthetic agents, and achieve the effects of reducing the number of patients, and reducing the accuracy of eeg

Active Publication Date: 2009-10-15
SCHEIB CHRISTOPHER
View PDF1 Cites 33 Cited by
  • Summary
  • Abstract
  • Description
  • Claims
  • Application Information

AI Technical Summary

Benefits of technology

[0017]Embodiments of the present invention relate to a system and method for determining from EEG signals the lack of awareness and the depth of anesthesia of a patient to whom an anesthetic agent is being administered. In particular, a log-log representation of the EEG power spectrum is converted to two intersecting lines so that the intersection point and the relative slopes can be analyzed to determine a state of anesthesia of a patient. This system and method may also be used in an analysis of the brain function of a sleeping individual to distinguish between awareness, REM sleep, and the various levels of non-REM sleep. It may also be used to investigate the effect of various experimental pharmaceuticals on brain function.

Problems solved by technology

If the anesthesia is not sufficiently deep, the patient may maintain or gain consciousness during a surgery, or other medical procedure, resulting in an extremely traumatic experience for the patient which may have long term consequences such as post traumatic stress disorder.
On the other hand, excessively deep anesthesia reflects an unnecessary consumption of anesthetic agents, most of which are expensive.
However, this gross characterization is too imprecise and unreliable to use as an indication of such a critical medical aspect as the extent of anesthesia.
Further, EEG signal changes during anesthesia may not fully correlate with changes in the hypnotic state of the patient.
However, because the calculation must be performed using complex number arithmetic for several thousand f1, f2 and f1+f2 frequency combinations, the computations to obtain bispectral information are rather arduous.

Method used


Image

  • Method and system for analyzing and presenting an Electroencephalogram (EEG)
  • Method and system for analyzing and presenting an Electroencephalogram (EEG)
  • Method and system for analyzing and presenting an Electroencephalogram (EEG)

Examples


Embodiment Construction

[0029]The detailed description set forth below in connection with the appended drawings is intended as a description of various embodiments of the invention and is not intended to represent the only embodiments in which the invention may be practiced. The detailed description includes specific details for the purpose of providing a thorough understanding of the invention. However, it will be apparent to those skilled in the art that the invention may be practiced without these specific details. In some instances, well known structures and components are shown in block diagram form in order to avoid obscuring the concepts of the invention.

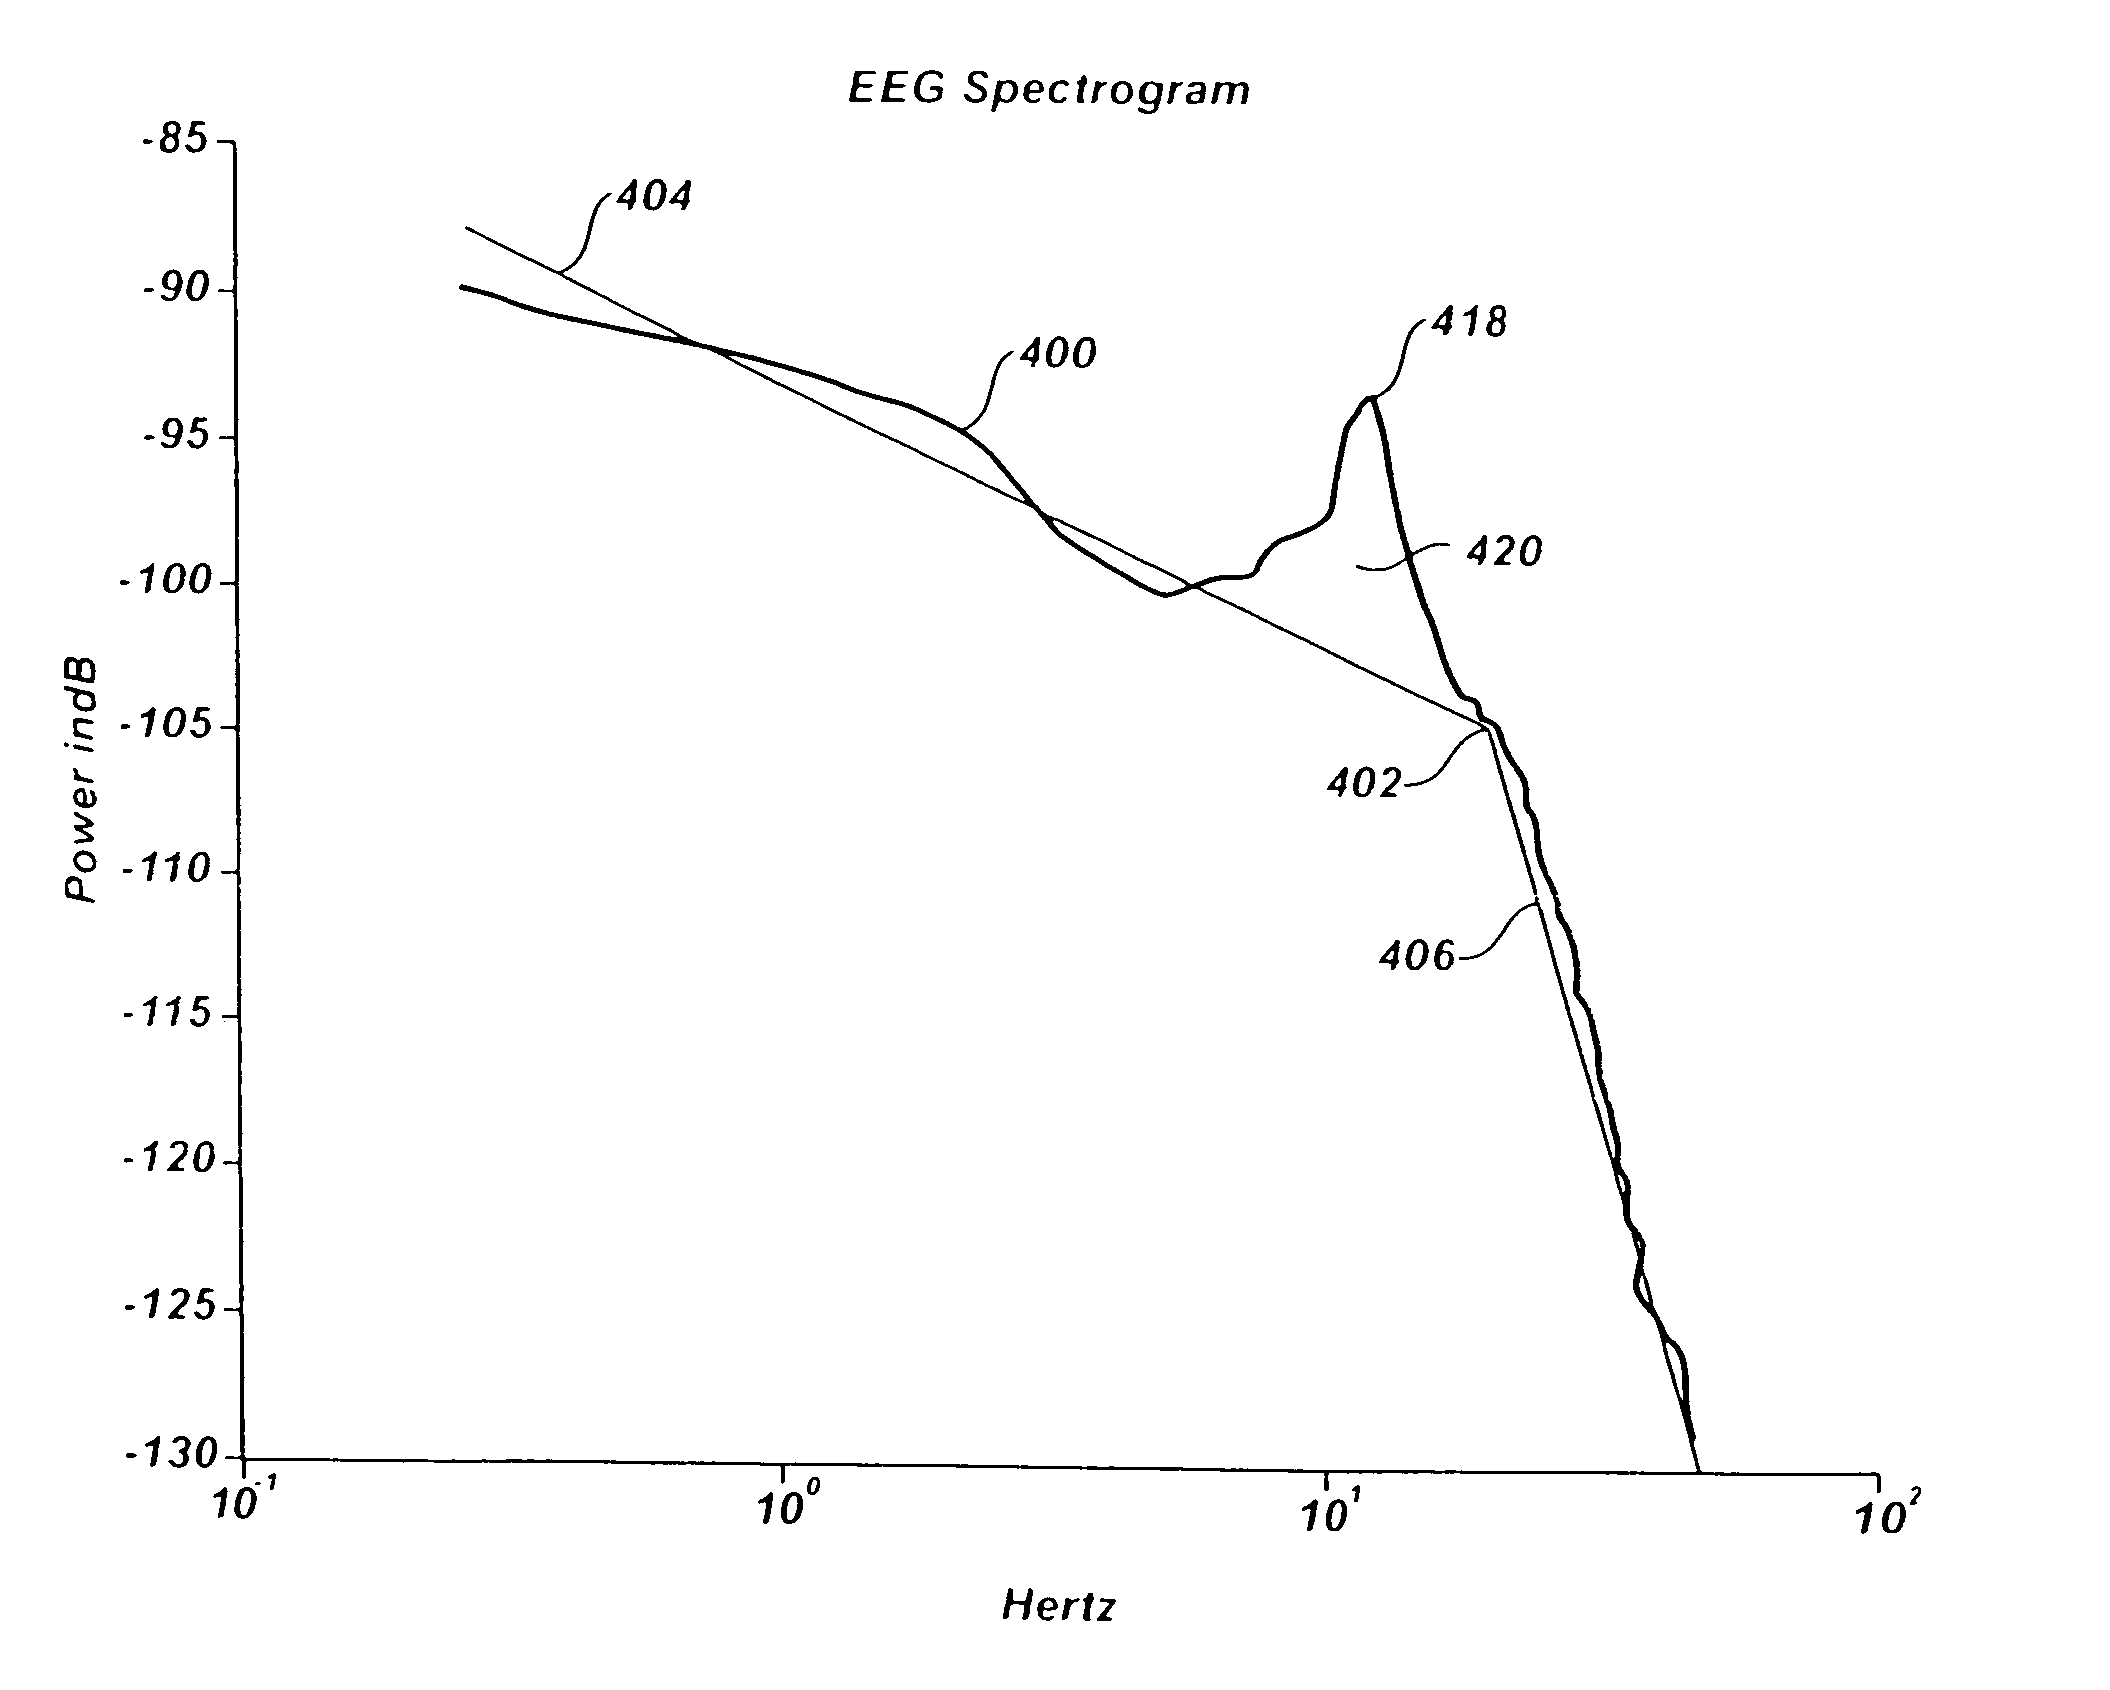
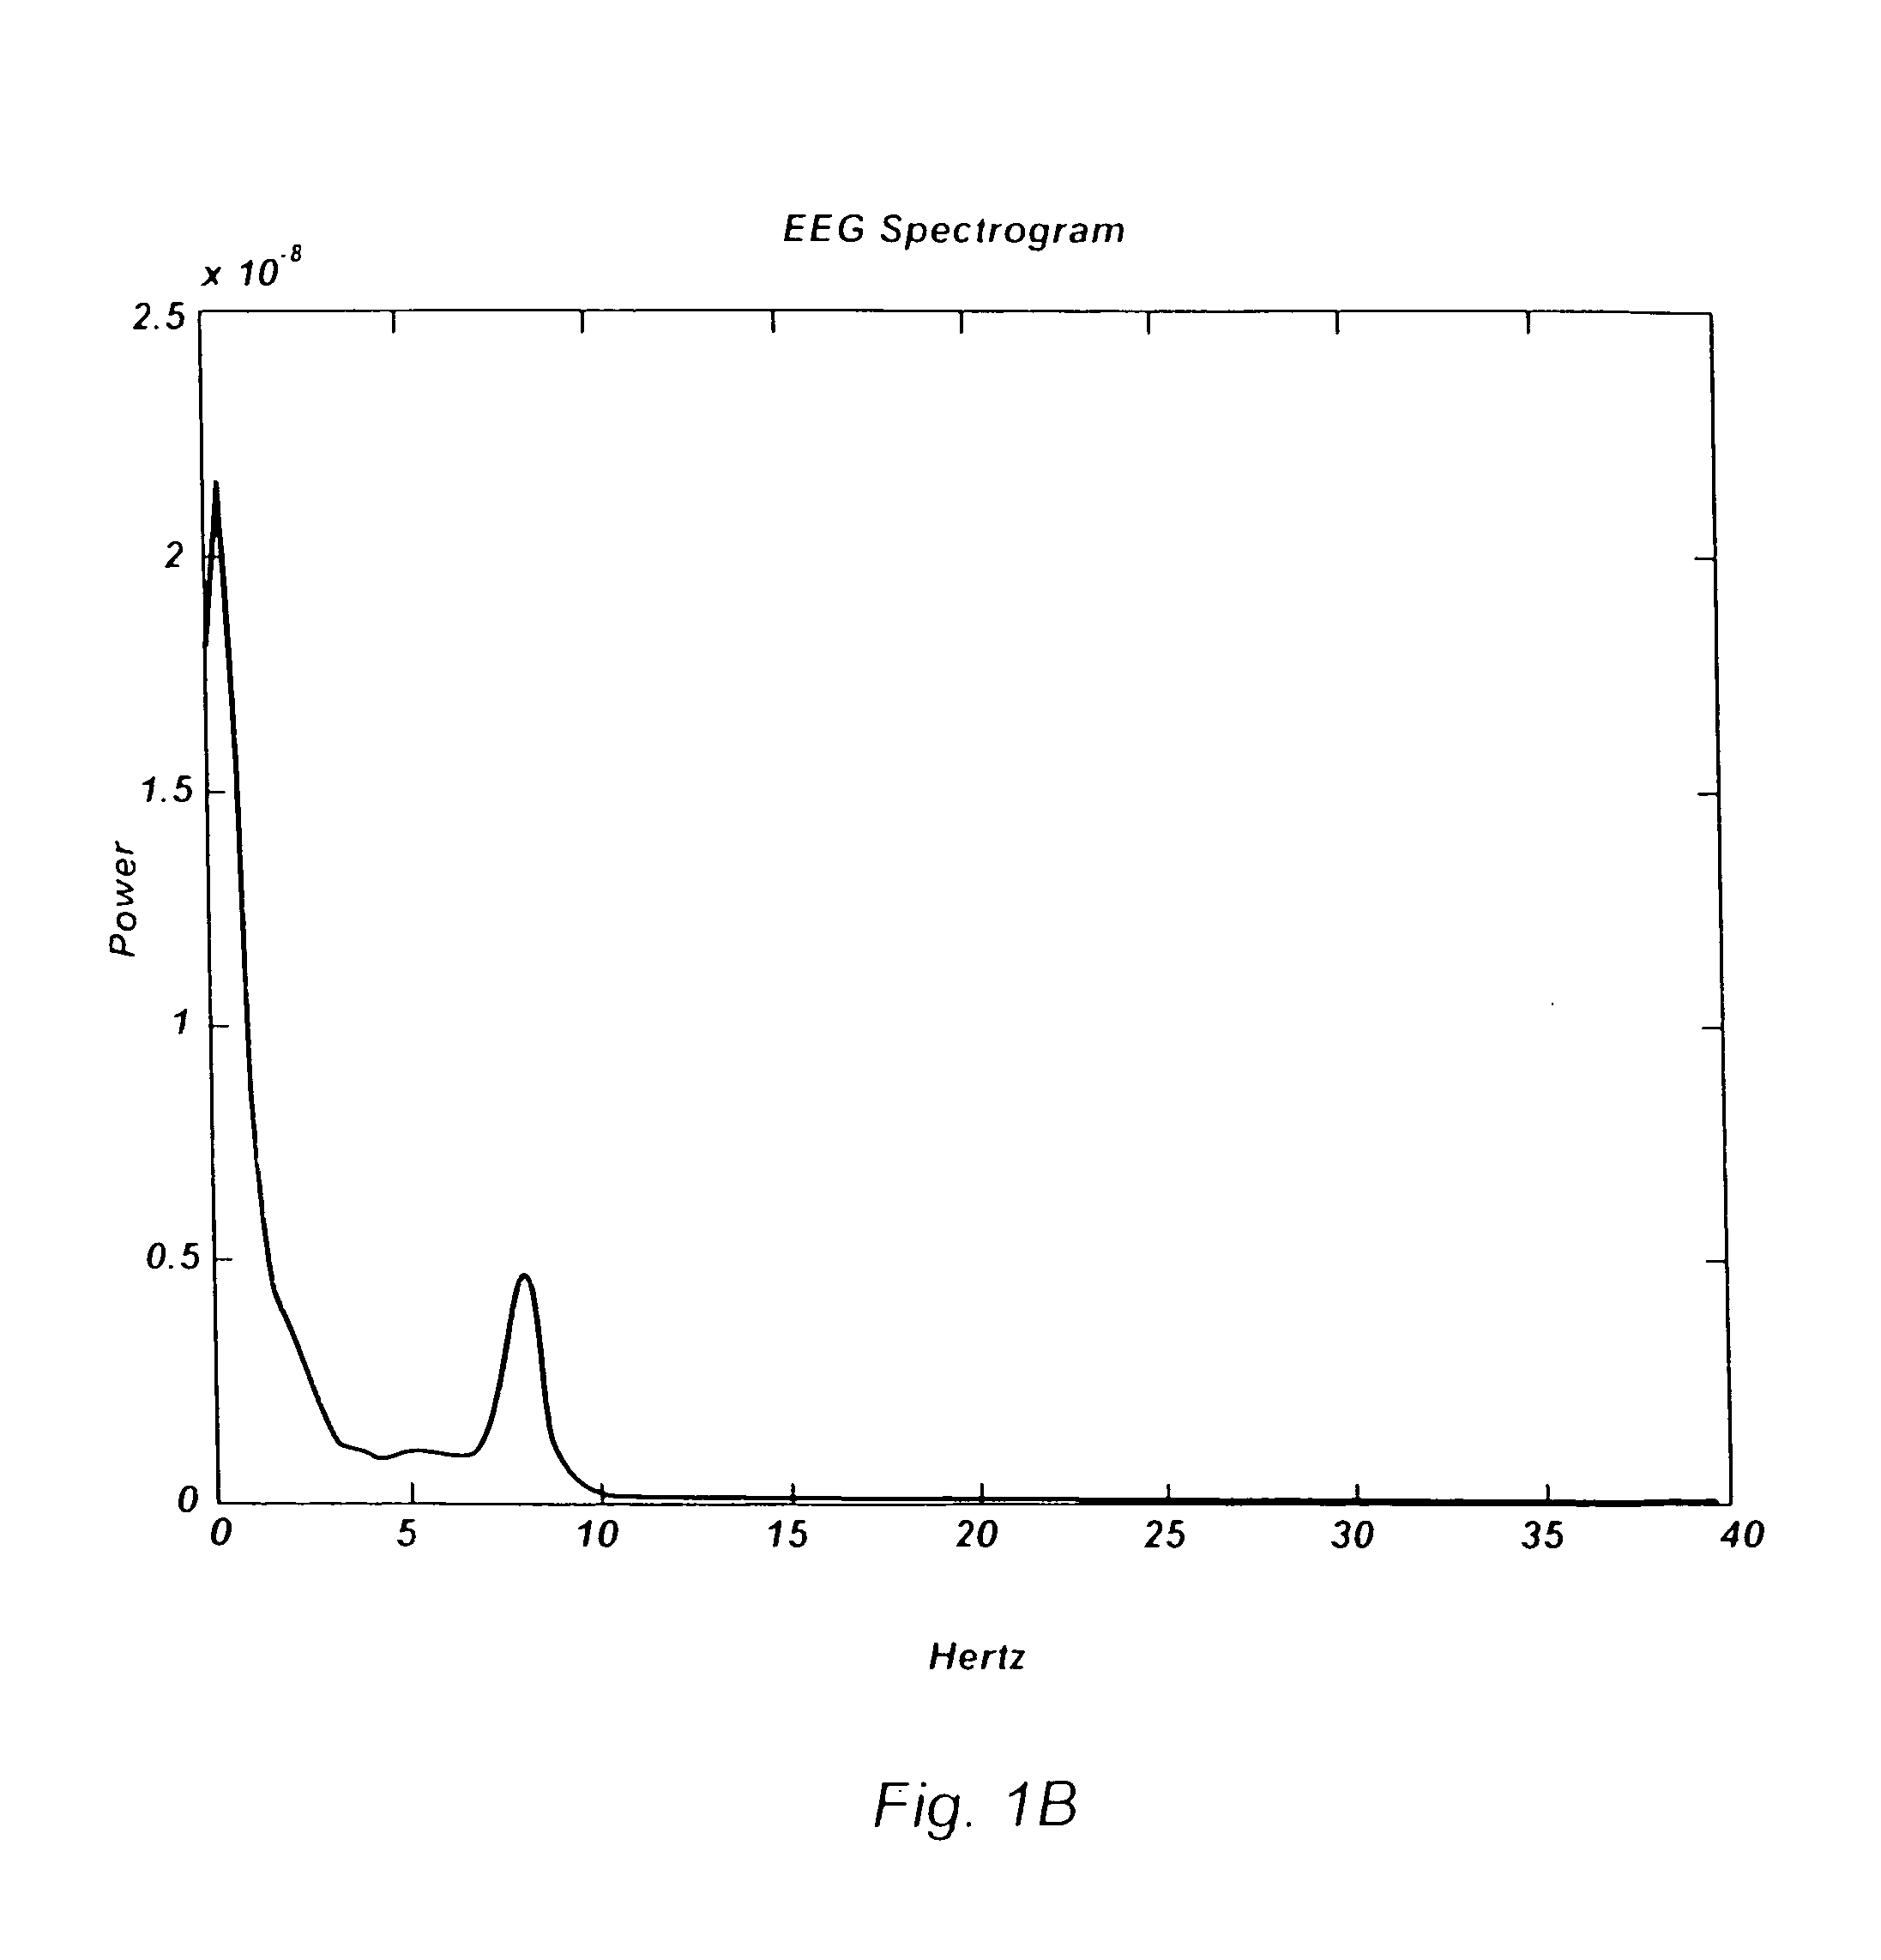
[0030]FIGS. 1B and 1C illustrate common ways that EEG spectrograms can be displayed. In FIG. 1B the y-axis shows the power (scaled logarithmically) of the different frequencies present in the spectrogram. The x-axis is scaled linearly from about 0 to 40 Hz. In FIG. 1C, a similar spectrogram is shown but the y-axis is scaled linearly.

[0031]As discuss...


PUM


Abstract

A system and method determines from EEG signals the lack of awareness and the depth of anesthesia of a patient to whom an anesthetic agent is being administered. In particular, a log-log representation of the EEG power spectrum is converted to two intersecting lines so that the intersection point and the relative slopes can be analyzed to determine a state of awareness of a patient. This system and method may also be used in an analysis of the brain function of a sleeping individual to distinguish between different levels of non-REM sleep, REM sleep, and awakeness.

Description

BACKGROUND OF THE INVENTION[0001]1. Field of the Invention[0002]The present invention relates generally to monitoring brain function during different states of consciousness such as general anesthesia or natural sleep and, more particularly, to using electroencephalogram (EEG) data to monitor brain function.[0003]2. Description of Related Art[0004]The definition of the term “anesthesia” is—a lack of aesthesia—or lack of sensation. For surgical purposes this is generally achieved in two main ways: 1) infiltration of a peripheral or more central nerve bundle with a local anesthesia, which prevents the nerve impulse being processed by the central nervous system and, thus, sensation (of pain or otherwise is not perceived by the individual who remains conscious and aware; and 2) general anesthesia which requires a loss of consciousness in order for the sensation not to be perceived by the individual. To date no systems of monitoring brain function has produced a reference point beyond wh...

Claims


Application Information

Patent Timeline
Patent Type & Authority Applications(United States)
IPC IPC(8): A61B5/0476
CPCA61B5/4821A61B5/048A61B5/374
Inventor SCHIEB, CHRISTOPHER
Owner SCHEIB CHRISTOPHER
Why Eureka
Try Eureka