
Method and system for conversion of graphical representations of automation environments

Active Publication Date: 2010-04-01
ROCKWELL AUTOMATION TECH
View PDF4 Cites 6 Cited by
  • Summary
  • Abstract
  • Description
  • Claims
  • Application Information

AI Technical Summary

Problems solved by technology

Further, large companies may have multiple automation environments distributed throughout multiple locations.
However, the remote location may not have devices configured the same as those within the industrial enterprise.
When graphical representations of the machines are transmitted to the client device for display their normal size and complexity may prevent the graphical representations from displaying in a usable manner on the client device.

Method used


Image

  • Method and system for conversion of graphical representations of automation environments
  • Method and system for conversion of graphical representations of automation environments
  • Method and system for conversion of graphical representations of automation environments

Examples


Embodiment Construction

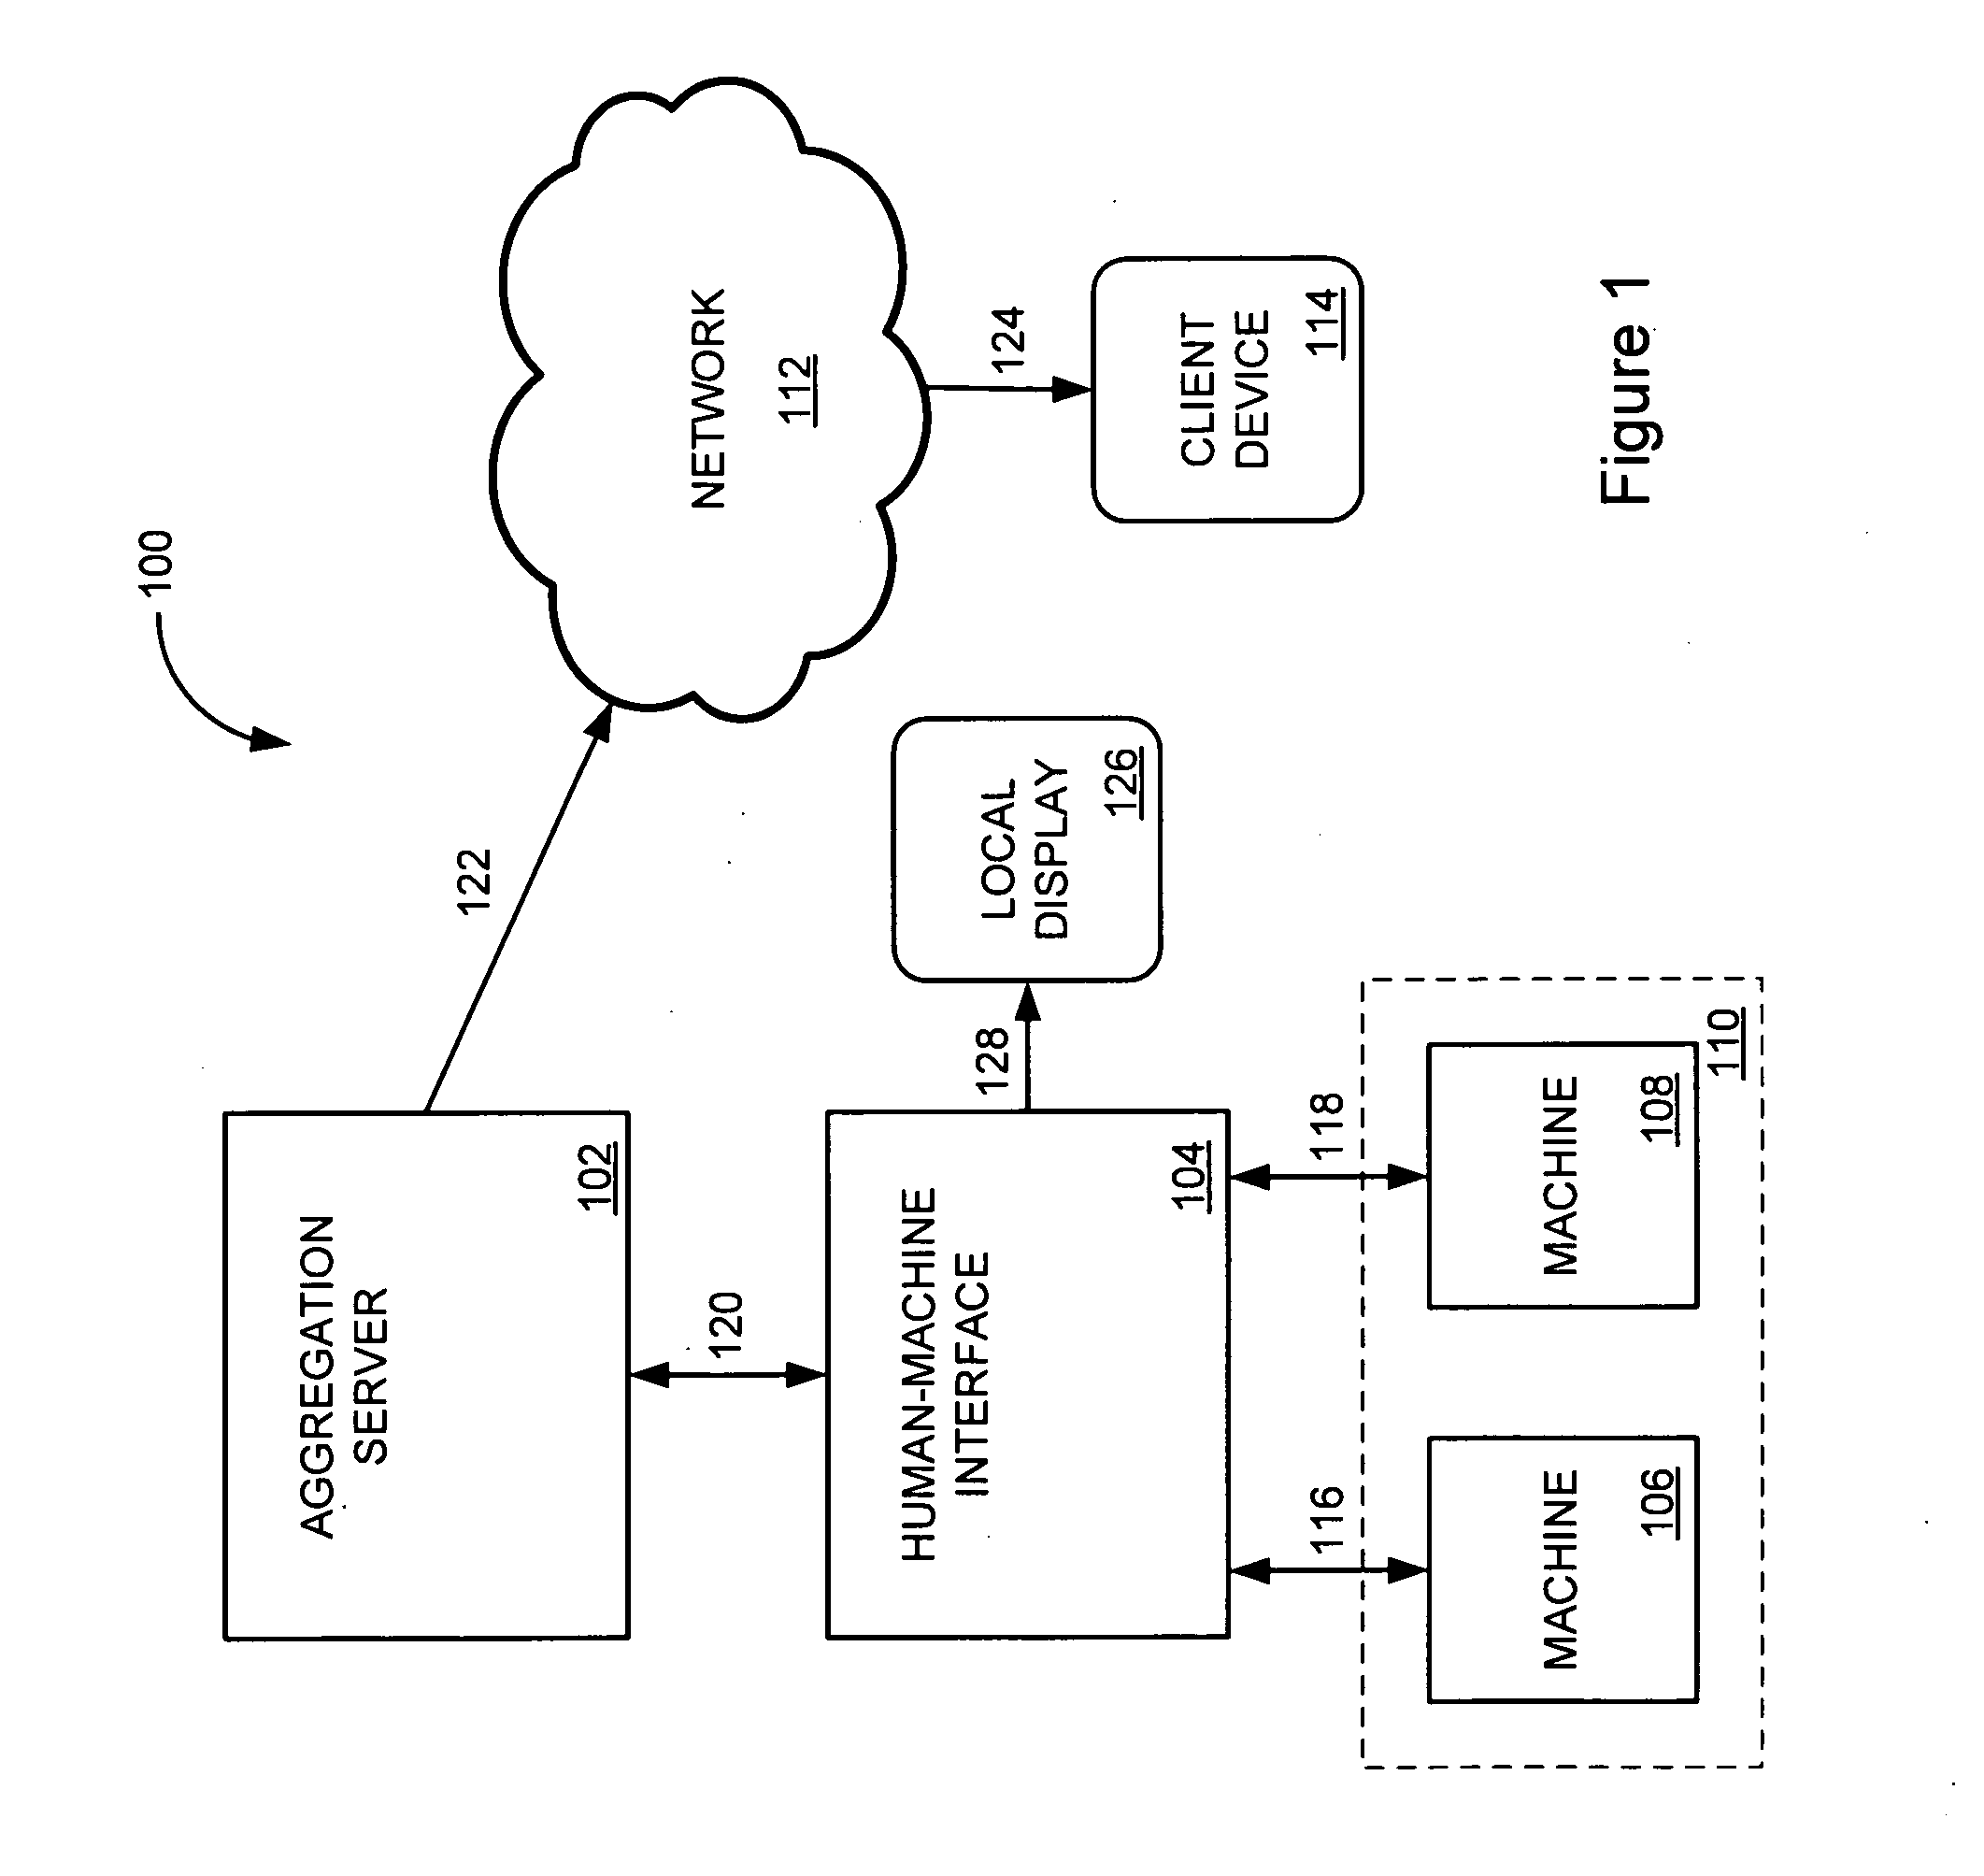
[0013]FIG. 1 is a block diagram illustrating an industrial automation system 100 configured for conversion of graphical representations of automation environments. In this example, industrial automation system 100 includes automation environment 110, human-machine interface 104, and aggregation server 102. Automation environment 110 includes machine 106 and machine 108. Client device 114 is being used to remotely view automation data from human-machine interface 104 through aggregation server 102.

[0014]Human-machine interface 104 is coupled to machine 106 through link 116, and to machine 108 through link 116. Aggregation server 102 is coupled to human-machine interface 104 through link 120. Local display 126 is coupled to human-machine interface through link 128. Client device 114 is coupled to aggregation server 102 through network 112 and links 122 and 124.

[0015]These links may use any of a variety of communication media, such as air, metal, optical fiber, or any other signal prop...


PUM


Abstract

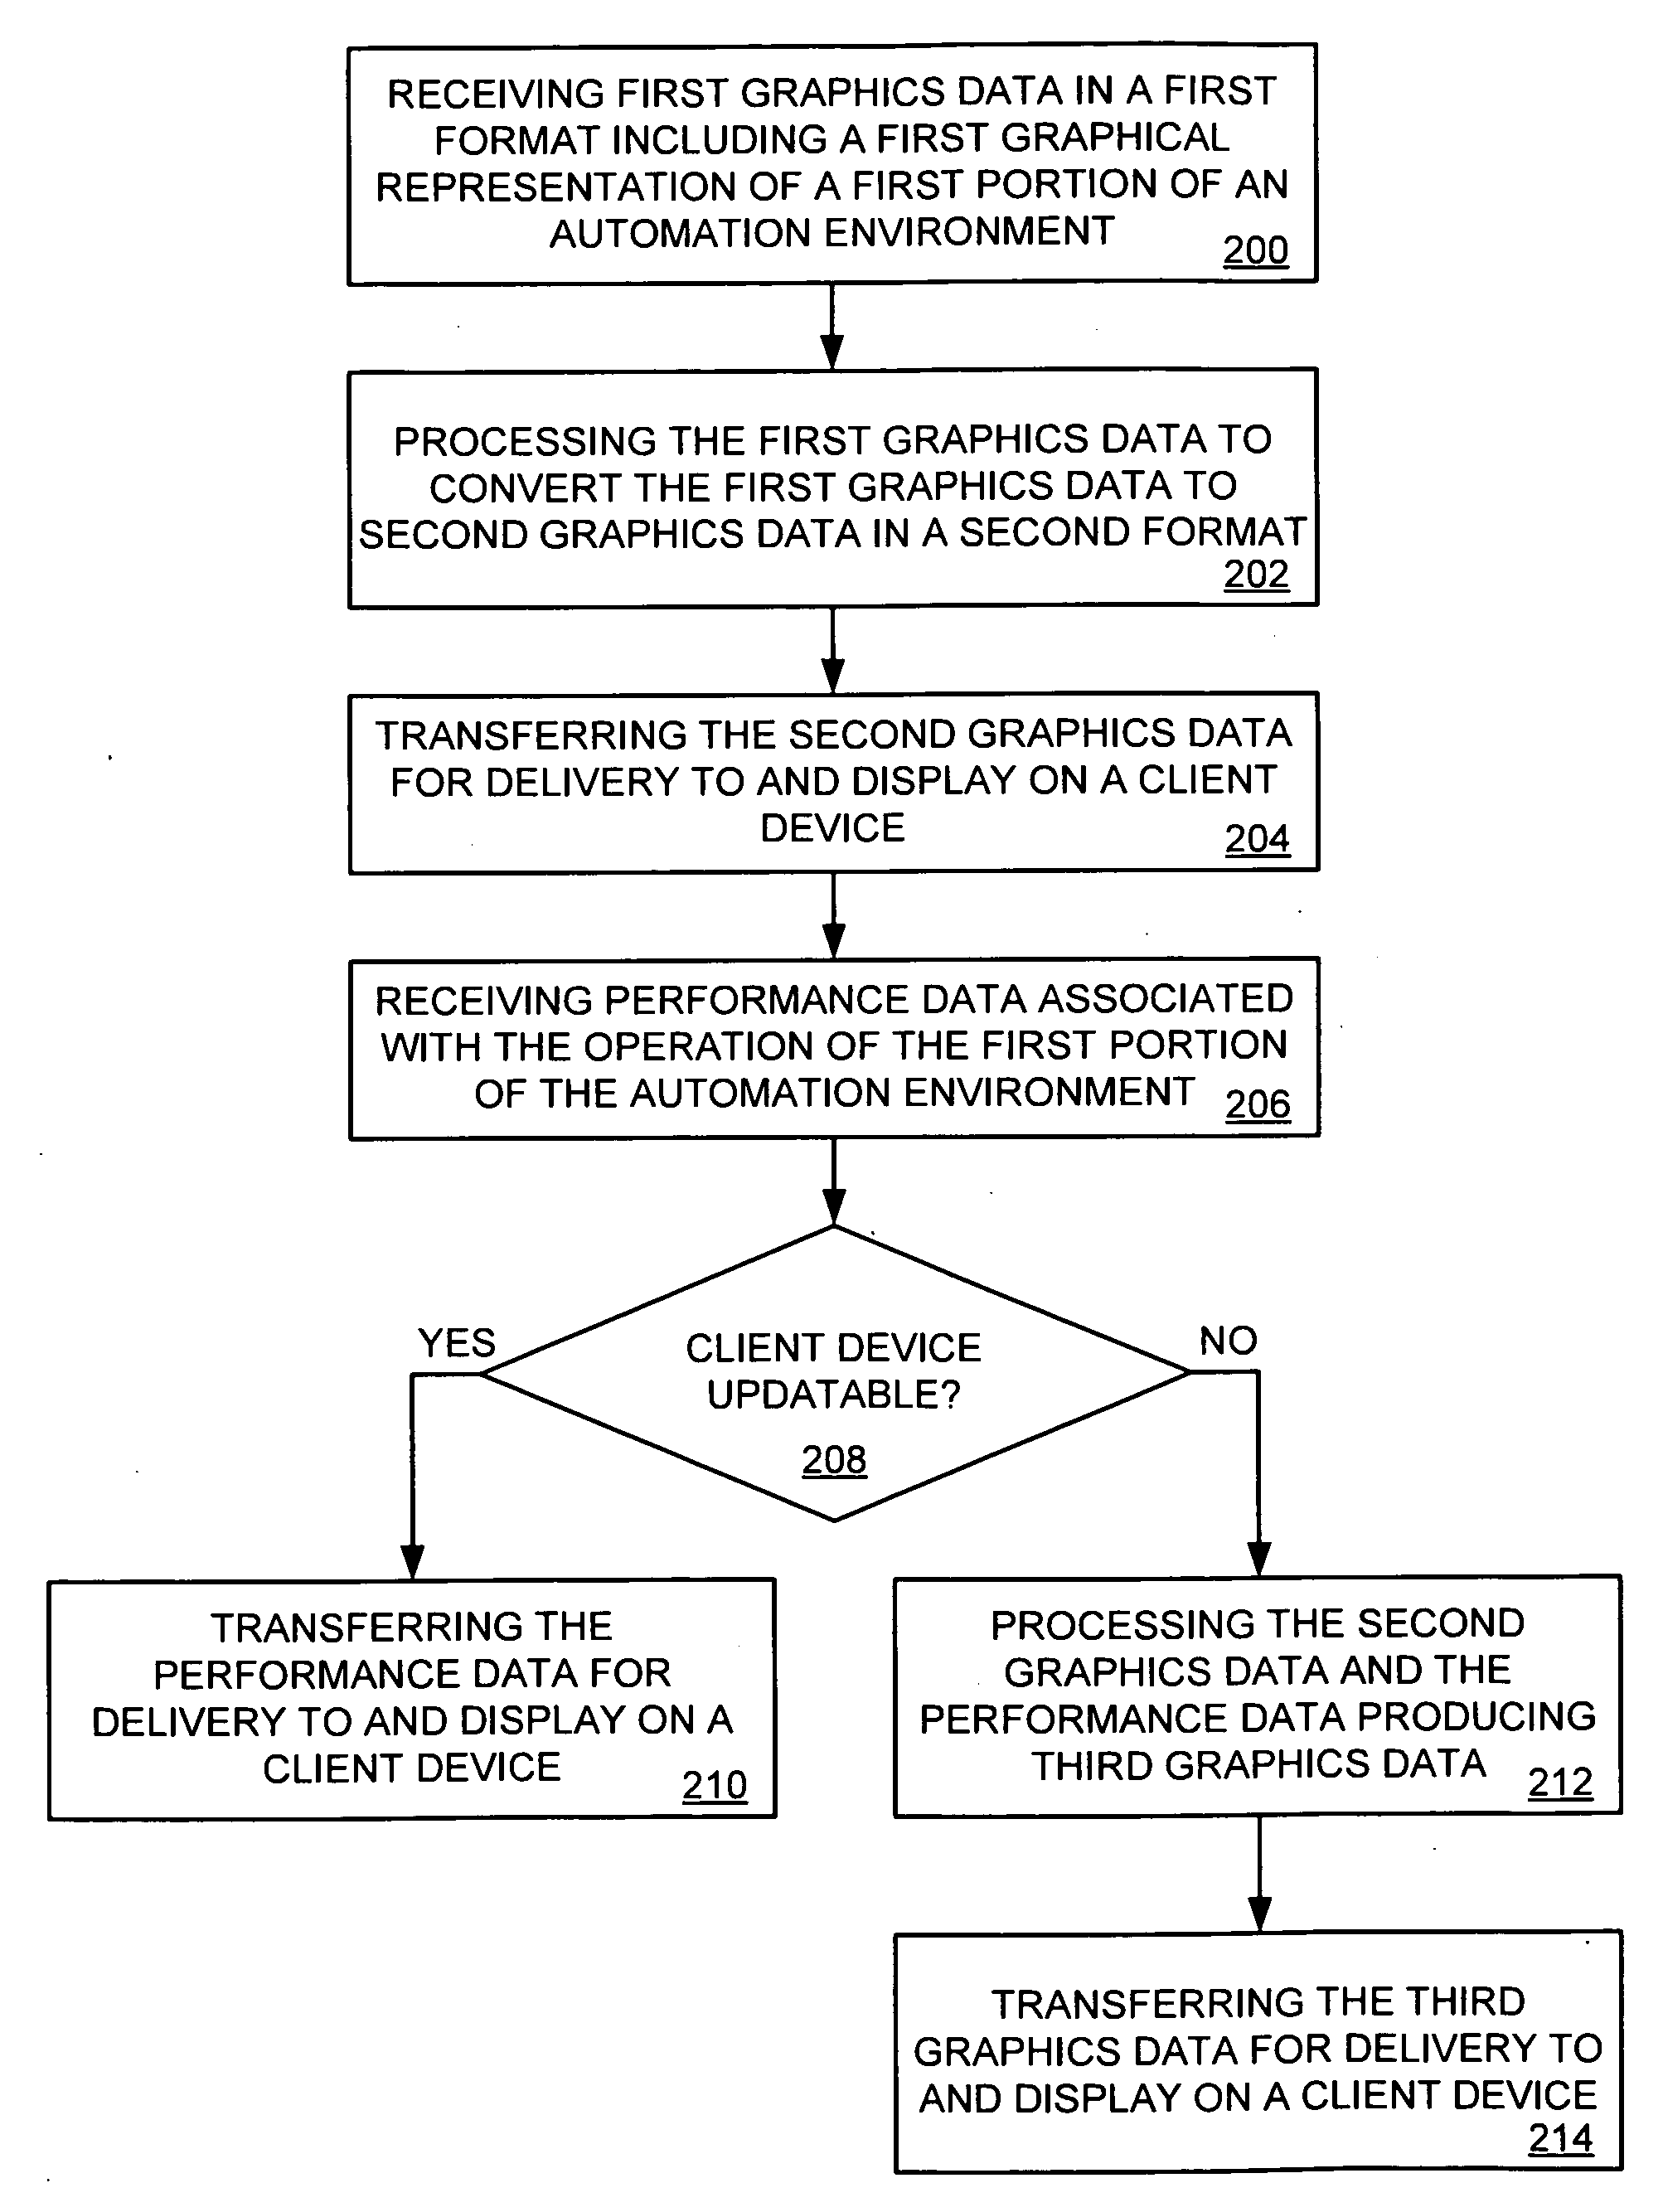
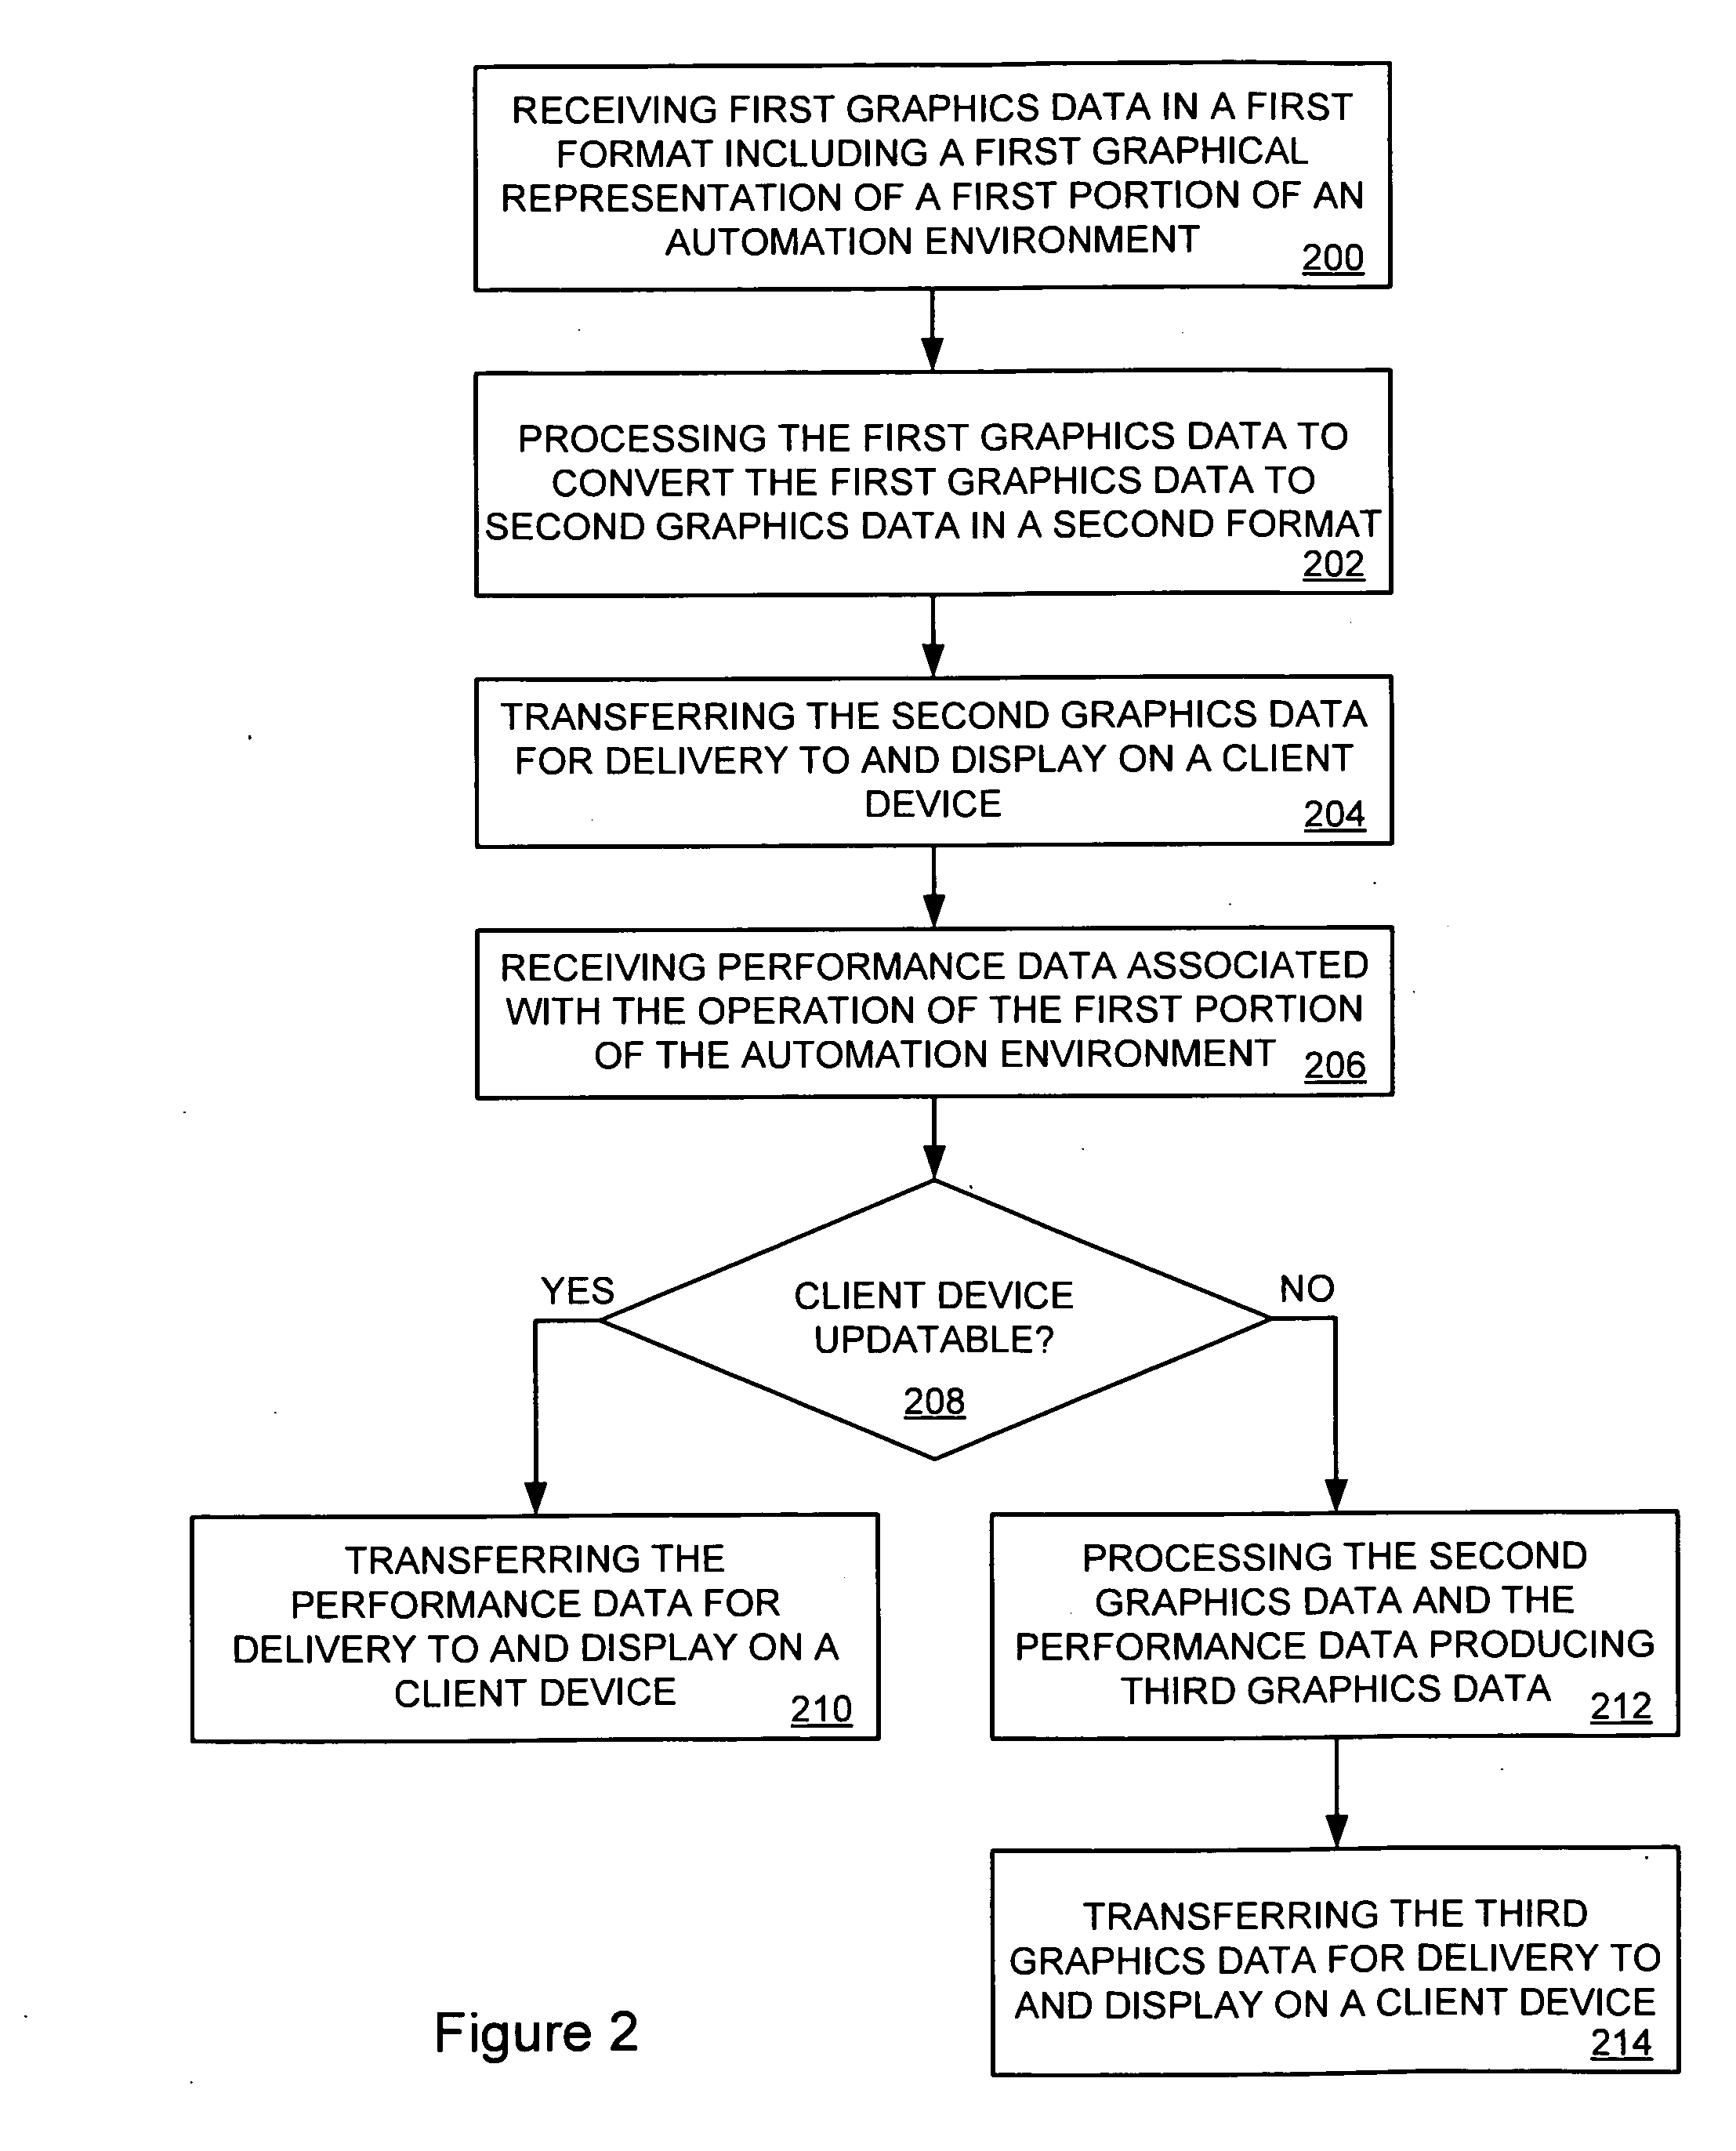
A method for the conversion of graphical representations of automation environments is provided. The method includes receiving first graphics data in a first format comprising a first graphical representation of a first portion of an automation environment, processing the first graphics data to convert the first graphics data to second graphics data in a second format, where the second graphics data comprises a second graphical representation of the first portion of the automation environment, and transferring the second graphics data for delivery to and display on a client device.

Description

TECHNICAL BACKGROUND[0001]Automation environments typically include a quantity of machines controlled and monitored by human-machine interfaces. These human-machine interfaces may be configured to control the machines while displaying automation data related to the present or past states of the machines. The interfaces may vary widely in complexity as required by particular machines and automation environments.[0002]Often human-machine interfaces are located within an industrial enterprise where they are used by operators to control the machines. One or more human-machine interfaces may be monitored by a supervisor or engineer via an aggregation server, allowing the supervisor or engineer to monitor the operation of the machines from a central location. This location may be a particular location within the industrial enterprise either local or remote to the actual machines under inspection.[0003]Further, large companies may have multiple automation environments distributed throughou...

Claims


Application Information

Patent Timeline
IPC IPC(8): G09G5/00
CPCG06T1/00G05B2219/40161G05B2219/36163G05B19/409
Inventor BAIER, JOHN JOSEPHGORDON, KEVIN GEORGEHOBBS, MARK DAVIDFEVANG, MONTE LEROY
Owner ROCKWELL AUTOMATION TECH
Learn More