
Color mapping method

Active Publication Date: 2010-04-29
TOP VICTORY INVESTMENTS
View PDF12 Cites 48 Cited by
  • Summary
  • Abstract
  • Description
  • Claims
  • Application Information

AI Technical Summary

Benefits of technology

[0007]It is an object of the invention to improve the color reproduction of a display which has color primaries spanning a gamut different than the gamut of the input signal.
[0019]In an embodiment, the mapped luminance is clipped to substantially the stored luminance. Thus, the too bright colors are prevented by changing the drive signals for the display primaries such that the luminance substantially matches the luminance of a real reflective object which has the same color.
[0021]In an embodiment, the color mapping method retrieves a further looked-up luminance by looking up the stored luminance in the look-up table at the input chromaticity of the input signal. The mapped luminance is scaled by a factor which is substantially equal to a ratio of the looked-up luminance at the mapped chromaticity and the looked-up luminance at the input chromaticity. This scaling has the advantage that artifacts caused by clipping are prevented.
[0023]In an embodiment, the gamut mapping provides a color enhancement which, for example is a saturation boost in a wide gamut display which has more than three primary colors.
[0024]In an embodiment, a display in which the color mapping method is applied is optimized to improve the color reproduction. The color mapping of the present invention may be inside of and define the color behavior of the display, or may be applied in a separate apparatus, the display just obtaining corrected input signals. The color mapping method may be combined with such a display to further decrease any mismatch between the luminance of displayed colors and the luminance of the real world reflective objects which have the same color. Such an optimized display may be designed in accordance with the following design method. The display has pixels of which a pixel color is obtained by mixing of at least four primary colors. These primary colors define the display color gamut of the display. Thus, the display color gamut covers all colors which can be displayed by the display. However, these primary colors have to fulfill special requirements to avoid the fluorescence or dullness artifacts in the color reproduction.

Problems solved by technology

For a display with a display gamut smaller than the input gamut, a typical artifact is that some saturated colors have a too low luminance and look dull, i.e. again the luminance is uncontrolledly incorrect.

Method used


Image

  • Color mapping method
  • Color mapping method
  • Color mapping method

Examples


Embodiment Construction

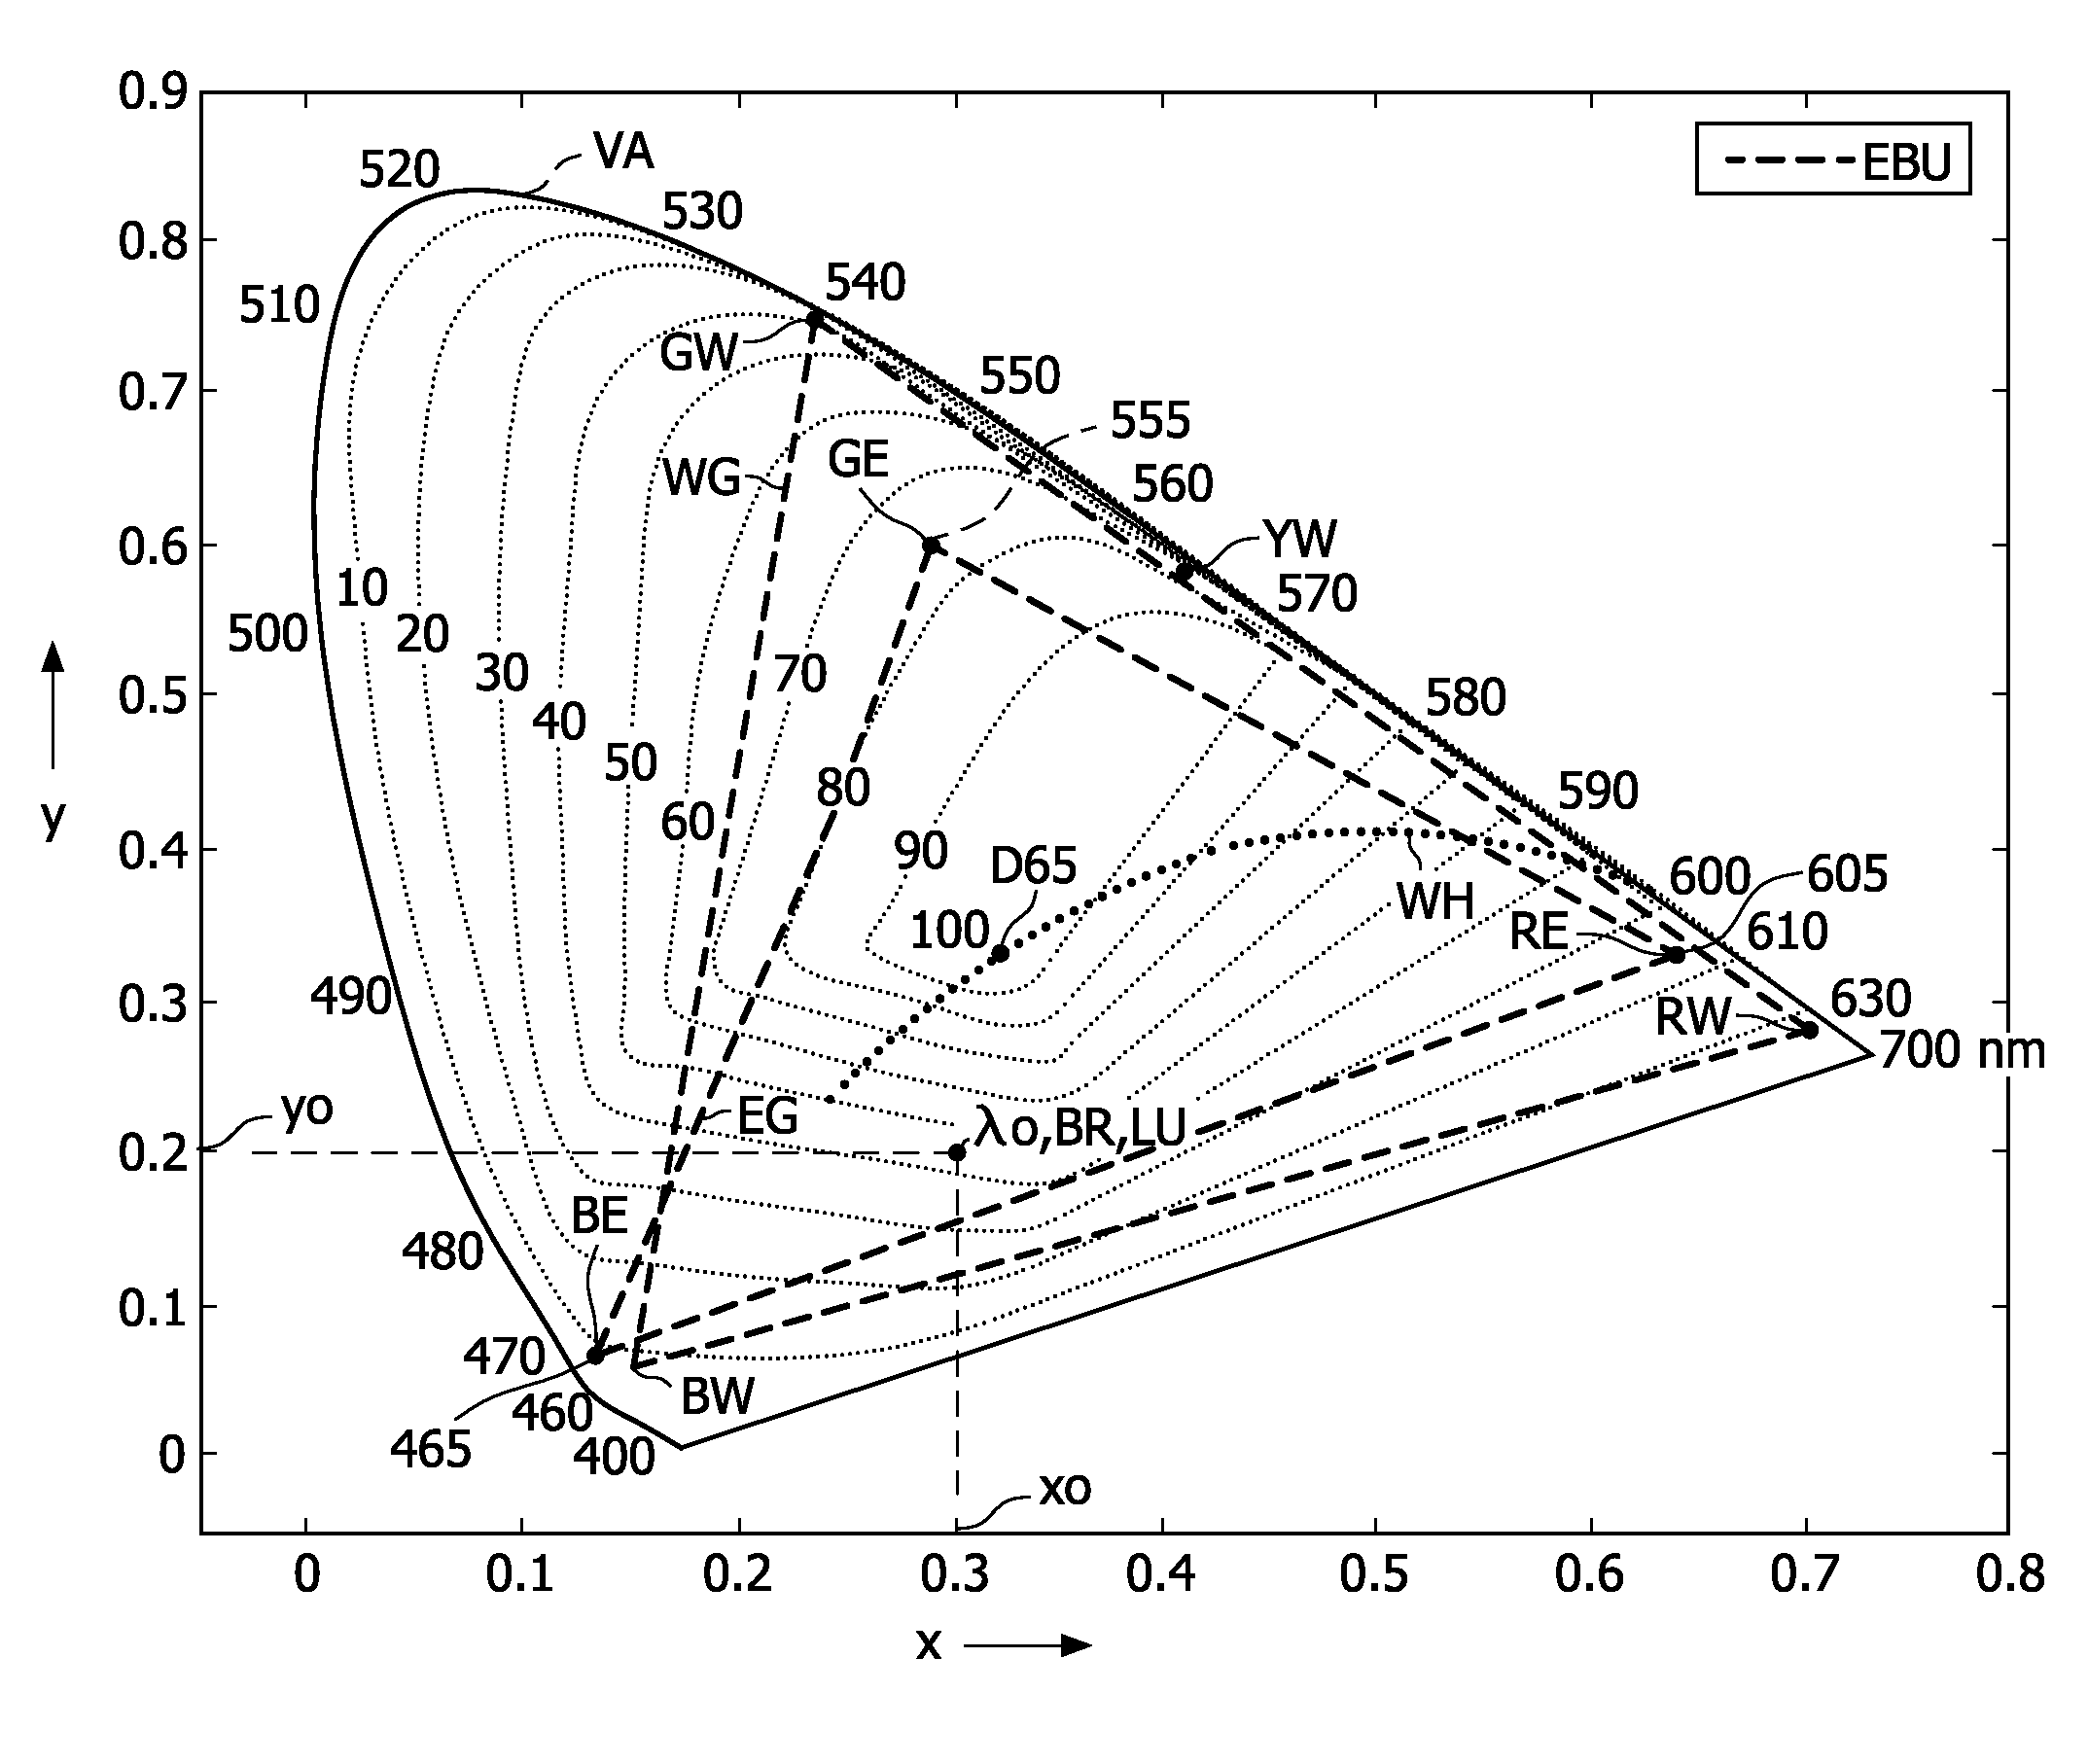
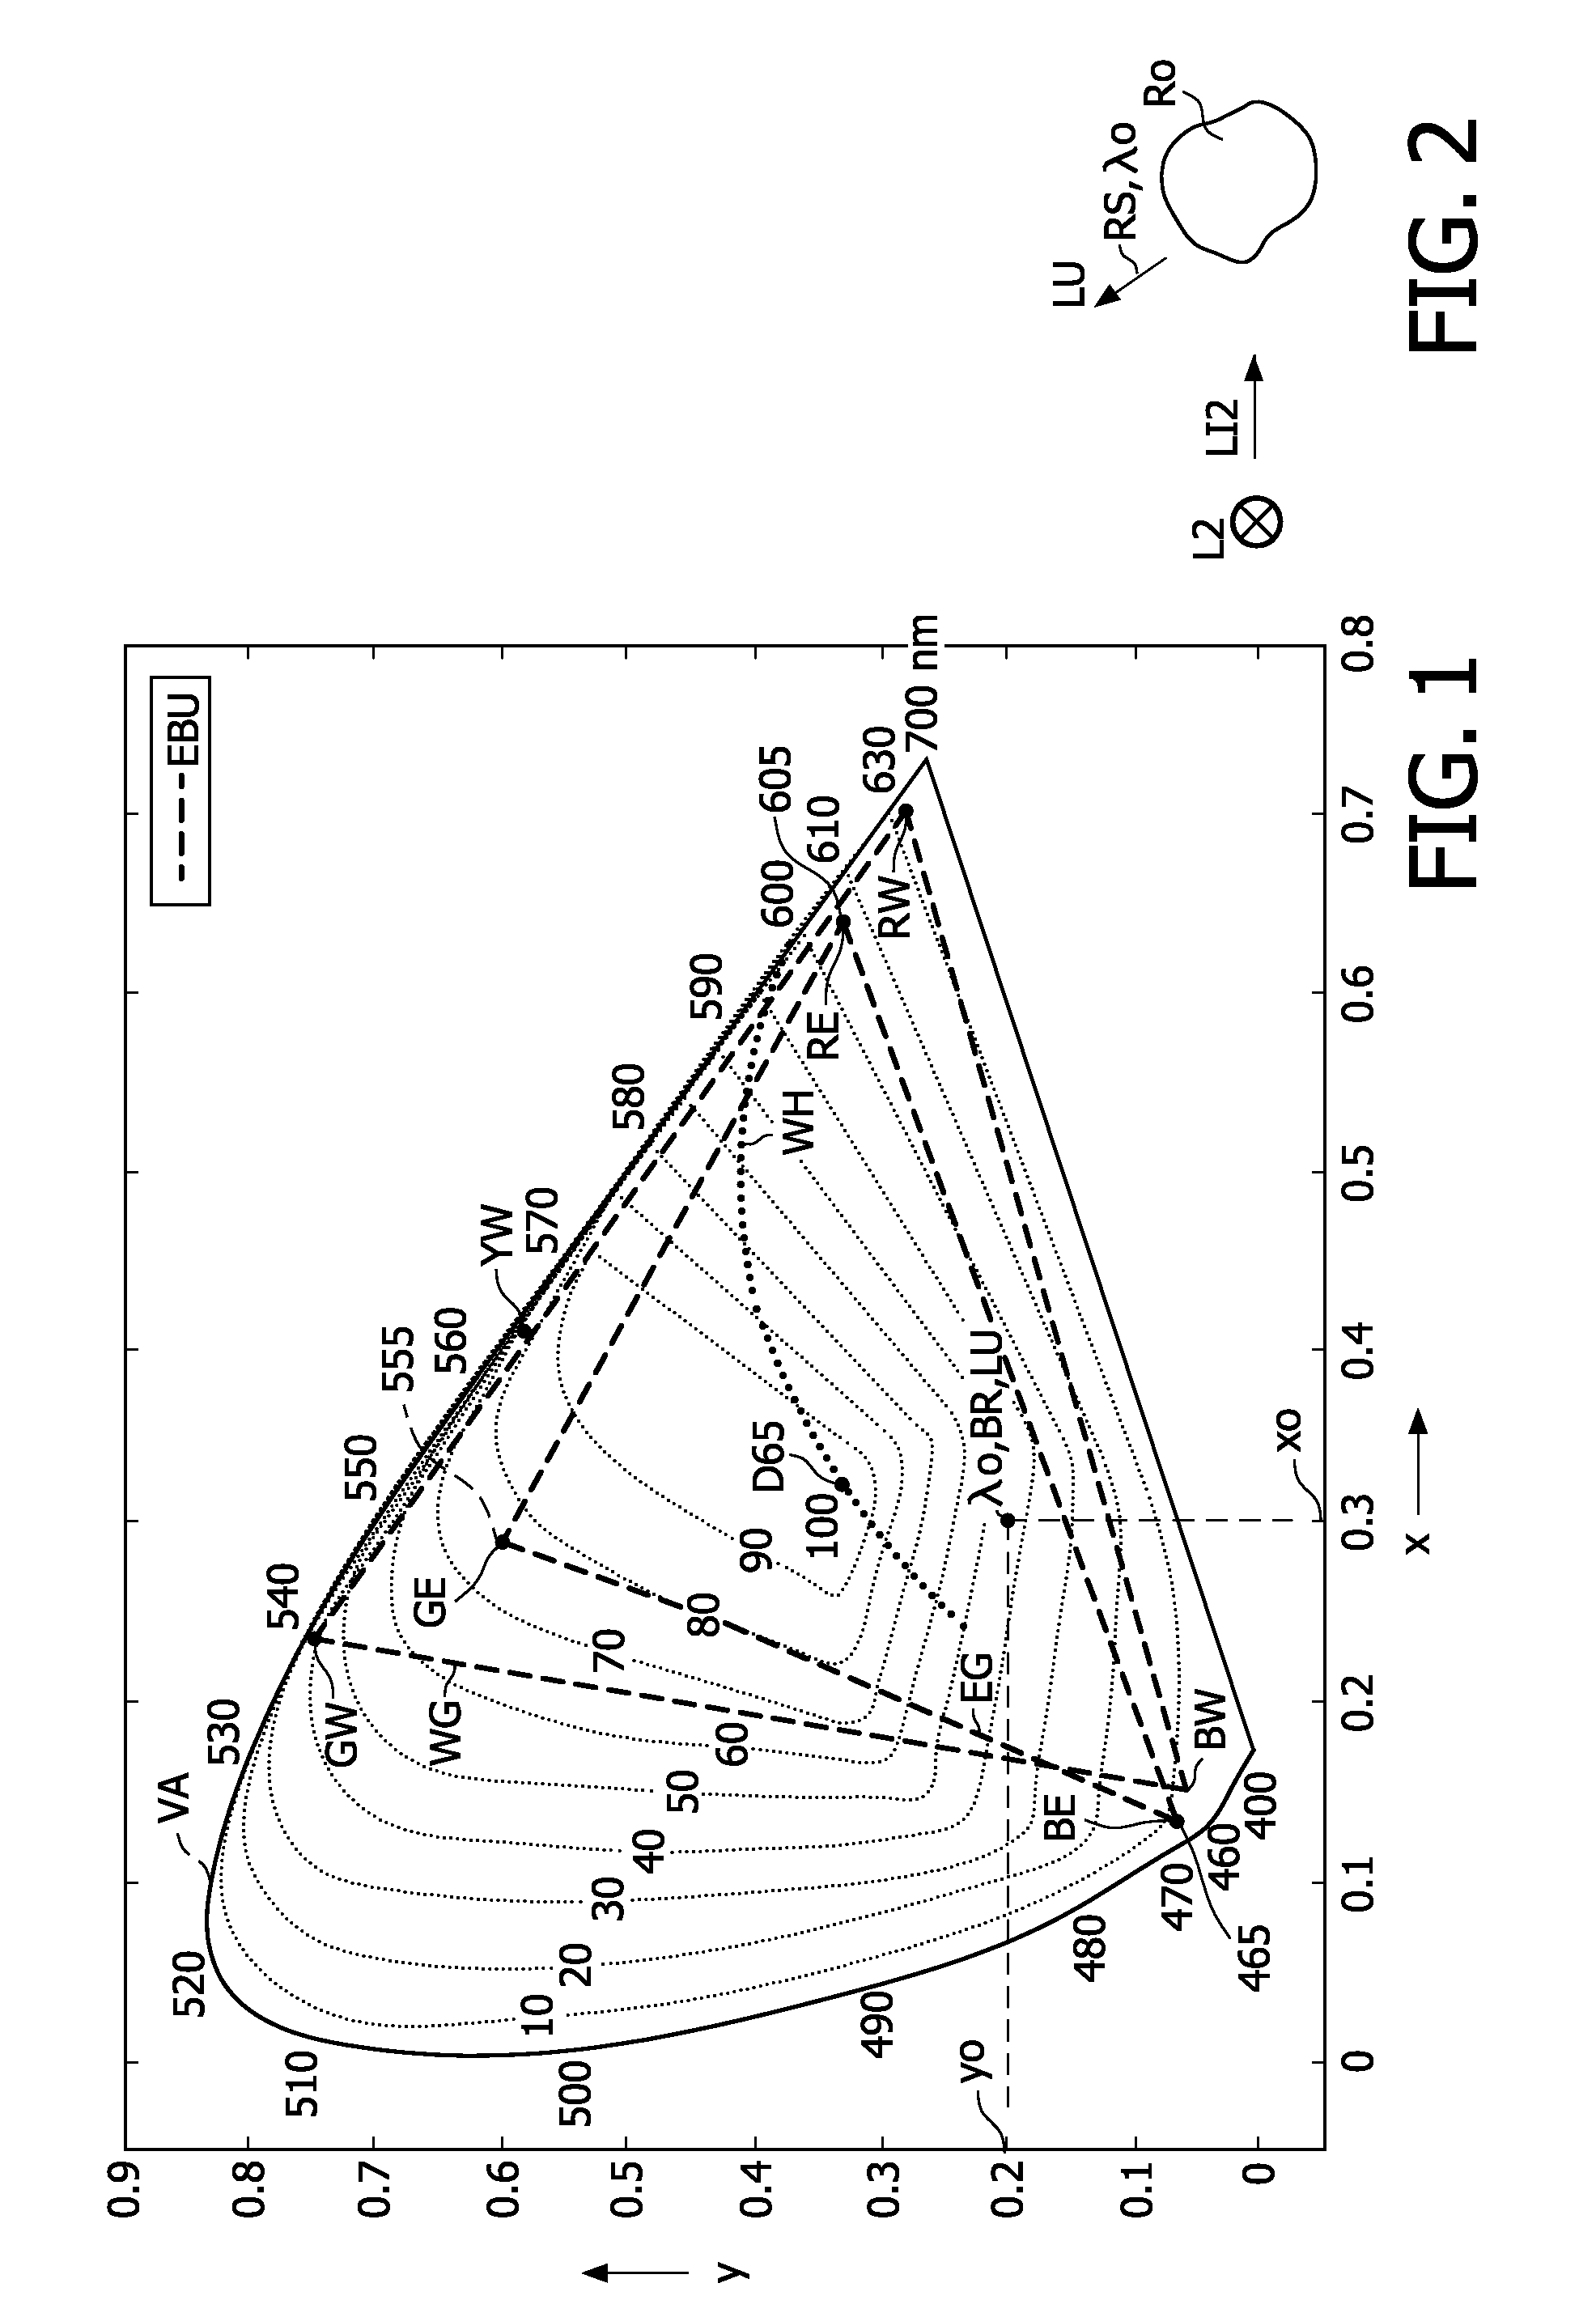
[0042]FIG. 1 schematically shows equal luminance loci of the reflective spectra in the “horse shoe” visible color space of the xy-chromaticity plane. The CIE 1931 x chromaticity coordinate is depicted along the horizontal axis, and the CIE 1931 y chromaticity coordinate is depicted along the vertical axis. The “horse shoe” locus VA indicates the boundary of visible colors. Colors with xy chromaticity coordinates on the locus VA are the 100% saturated colors which are also referred to as the monochromatic colors because the spectra of these colors comprise only a single wavelength. The numbers along the locus VA indicate the wavelength in nm. With the EBU primaries red RE, green GE and blue BE all the colors with xy chromaticity coordinates within the triangle EG of which the primaries RE, GE, BE are the vertices can be displayed. The white colors have xy chromaticity coordinates which lie on the curve WH. For example, white D65 is indicated.

[0043]As is well known from displays which...


PUM


Abstract

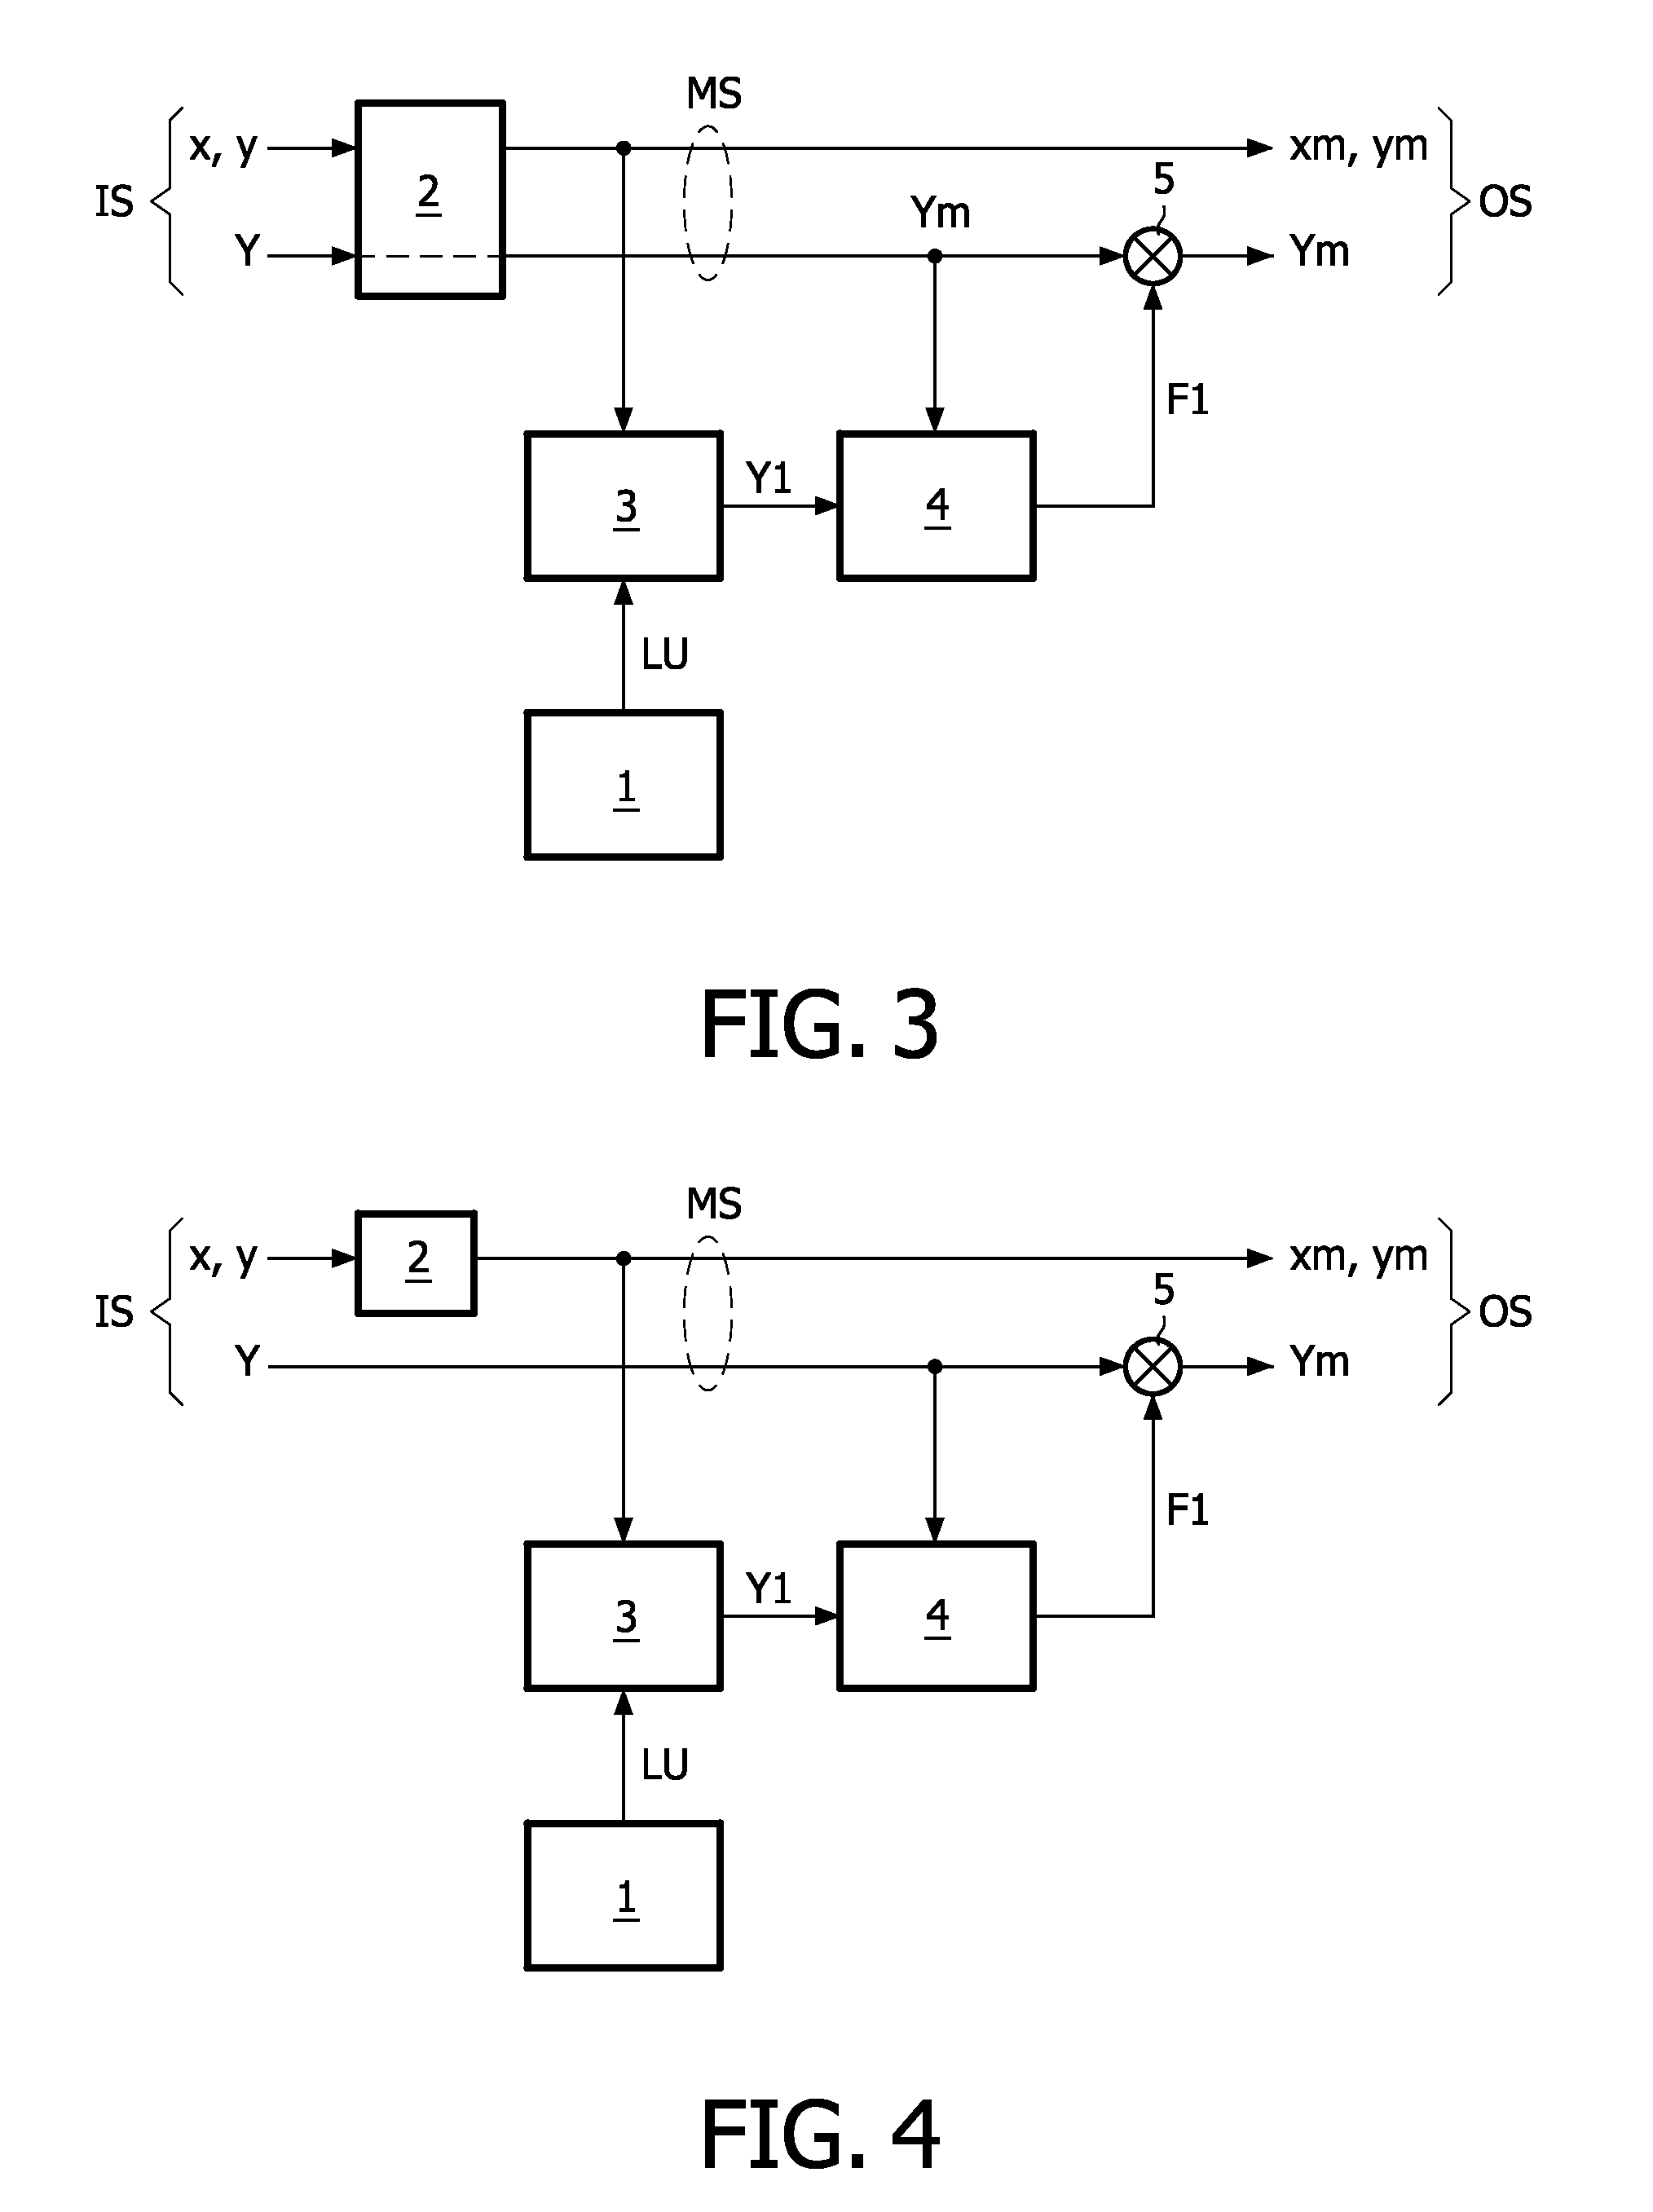
A color mapping method maps an input image signal (IS) into an output image signal (OS) for a display (DD) with display pixels (Pi) having sub-pixels (RP, GP, BP, YP) with primary colors (RW, GW, BW, YW) defining a display color gamut (WG). A look-up table (1) comprises stored luminances (LU) of reflective spectra (RS) at different chromaticities (λO) within the display color gamut (WG). The reflective spectra (RS) are spectra of reflective objects (RO) having a substantial maximum reflectivity at the corresponding chromaticities (λO). The color mapping method comprises a gamut mapping (2), retrieving (3) a looked-up luminance (Y1), a factor determination (4), and adapting the mapped luminance (Ym; Y). The gamut mapping (2) maps the input image signal (IS) having input pixel colors defined by an input luminance (Y) and an input chromaticity (x, y) into a mapped image signal (MS) having corresponding mapped pixel colors defined by a mapped luminance (Ym; Y) and a mapped chromaticity (xm, ym). The input pixel colors lie within an input color gamut different than the display color gamut (WG). The looked-up luminance (Y1) is retrieved (3) by looking up the stored luminance (LU) in the look-up table (1) at the mapped chromaticity (xm, ym). The factor (F) is determined (4) from a difference between the looked-up luminance (Y1) and the mapped luminance (Ym; Y). The mapped luminance (Ym; Y) is adapted (5) by using the factor (F; G) to obtain an output luminance (Ys) nearer to the looked-up luminance (Y1) than the mapped luminance (Ym). The image output signal (OS) is defined by the mapped chromaticity (xm, ym) and the output luminance (Ys).

Description

FIELD OF THE INVENTION[0001]The invention relates to a method of designing a display, a method of manufacturing a display, a display, and a computer program product.BACKGROUND OF THE INVENTION[0002]In order to show a color image, conventional displays have three primaries: red, green and blue. In Europe, the chromaticity coordinates of these three primaries are defined by the EBU standard for standard definition content, and by the Rec709 standard for high definition content. The chromaticity coordinates are also referred to as color points or colors. In other countries, different standards may define the colors of the three primaries. The chromaticity coordinates of the primaries in the EBU standard are in the CIE 1931 xy-color space for red: x=0.64 and y=0.33, for green: x=0.29 and y=0.60 and for blue: x=0.15 and y=0.06. The white point of the display is also defined in the EBU standard and is close to D65 (6500K) which has the chromaticity coordinates: x=0.3127 and y=0.3290. In p...

Claims


Application Information

Patent Timeline
IPC IPC(8): G09G5/10
CPCG09G3/2074G09G3/3611G09G5/02H04N9/67G09G2300/0452G09G2340/06H04N9/3114G09G2300/0439G09G3/36G09G3/20G09G5/04
Inventor LANGENDIJK, ERNO HERMANUS ANTONIUS
Owner TOP VICTORY INVESTMENTS
Learn More