Site effectiveness index and methods to measure and improve operational effectiveness in clinical trial execution

a clinical trial and operational effectiveness technology, applied in the field of clinical trial operational effectiveness improvement, can solve the problems of inability to meet the needs of clinical trial participants, lack of structure and objectivity, and sometimes worsening, and achieve the effect of improving operational effectiveness in clinical trial execution, reducing cycle time and financial savings

Active Publication Date: 2010-09-30
LI GEN
View PDF6 Cites 10 Cited by
  • Summary
  • Abstract
  • Description
  • Claims
  • Application Information

AI Technical Summary

Benefits of technology

[0008]The present invention provides a method of calculating and utilizing SEI to improve operational effectiveness in clinical trial execution, resulting in financial savings and cycle time reductions. Moreover, replacing a nominal patient enrol

Problems solved by technology

But we still lack a fundamental understanding of patient enrollment as a business process.
While many companies are attempting to manage trials better, it is not surprising to see that their approaches, even those of established industry experts, lack in structure and objectivity and

Method used


Image

  • Site effectiveness index and methods to measure and improve operational effectiveness in clinical trial execution
  • Site effectiveness index and methods to measure and improve operational effectiveness in clinical trial execution
  • Site effectiveness index and methods to measure and improve operational effectiveness in clinical trial execution

Examples


example 1

Define Operational Boundaries and Quantitative Operational Improvement Opportunities

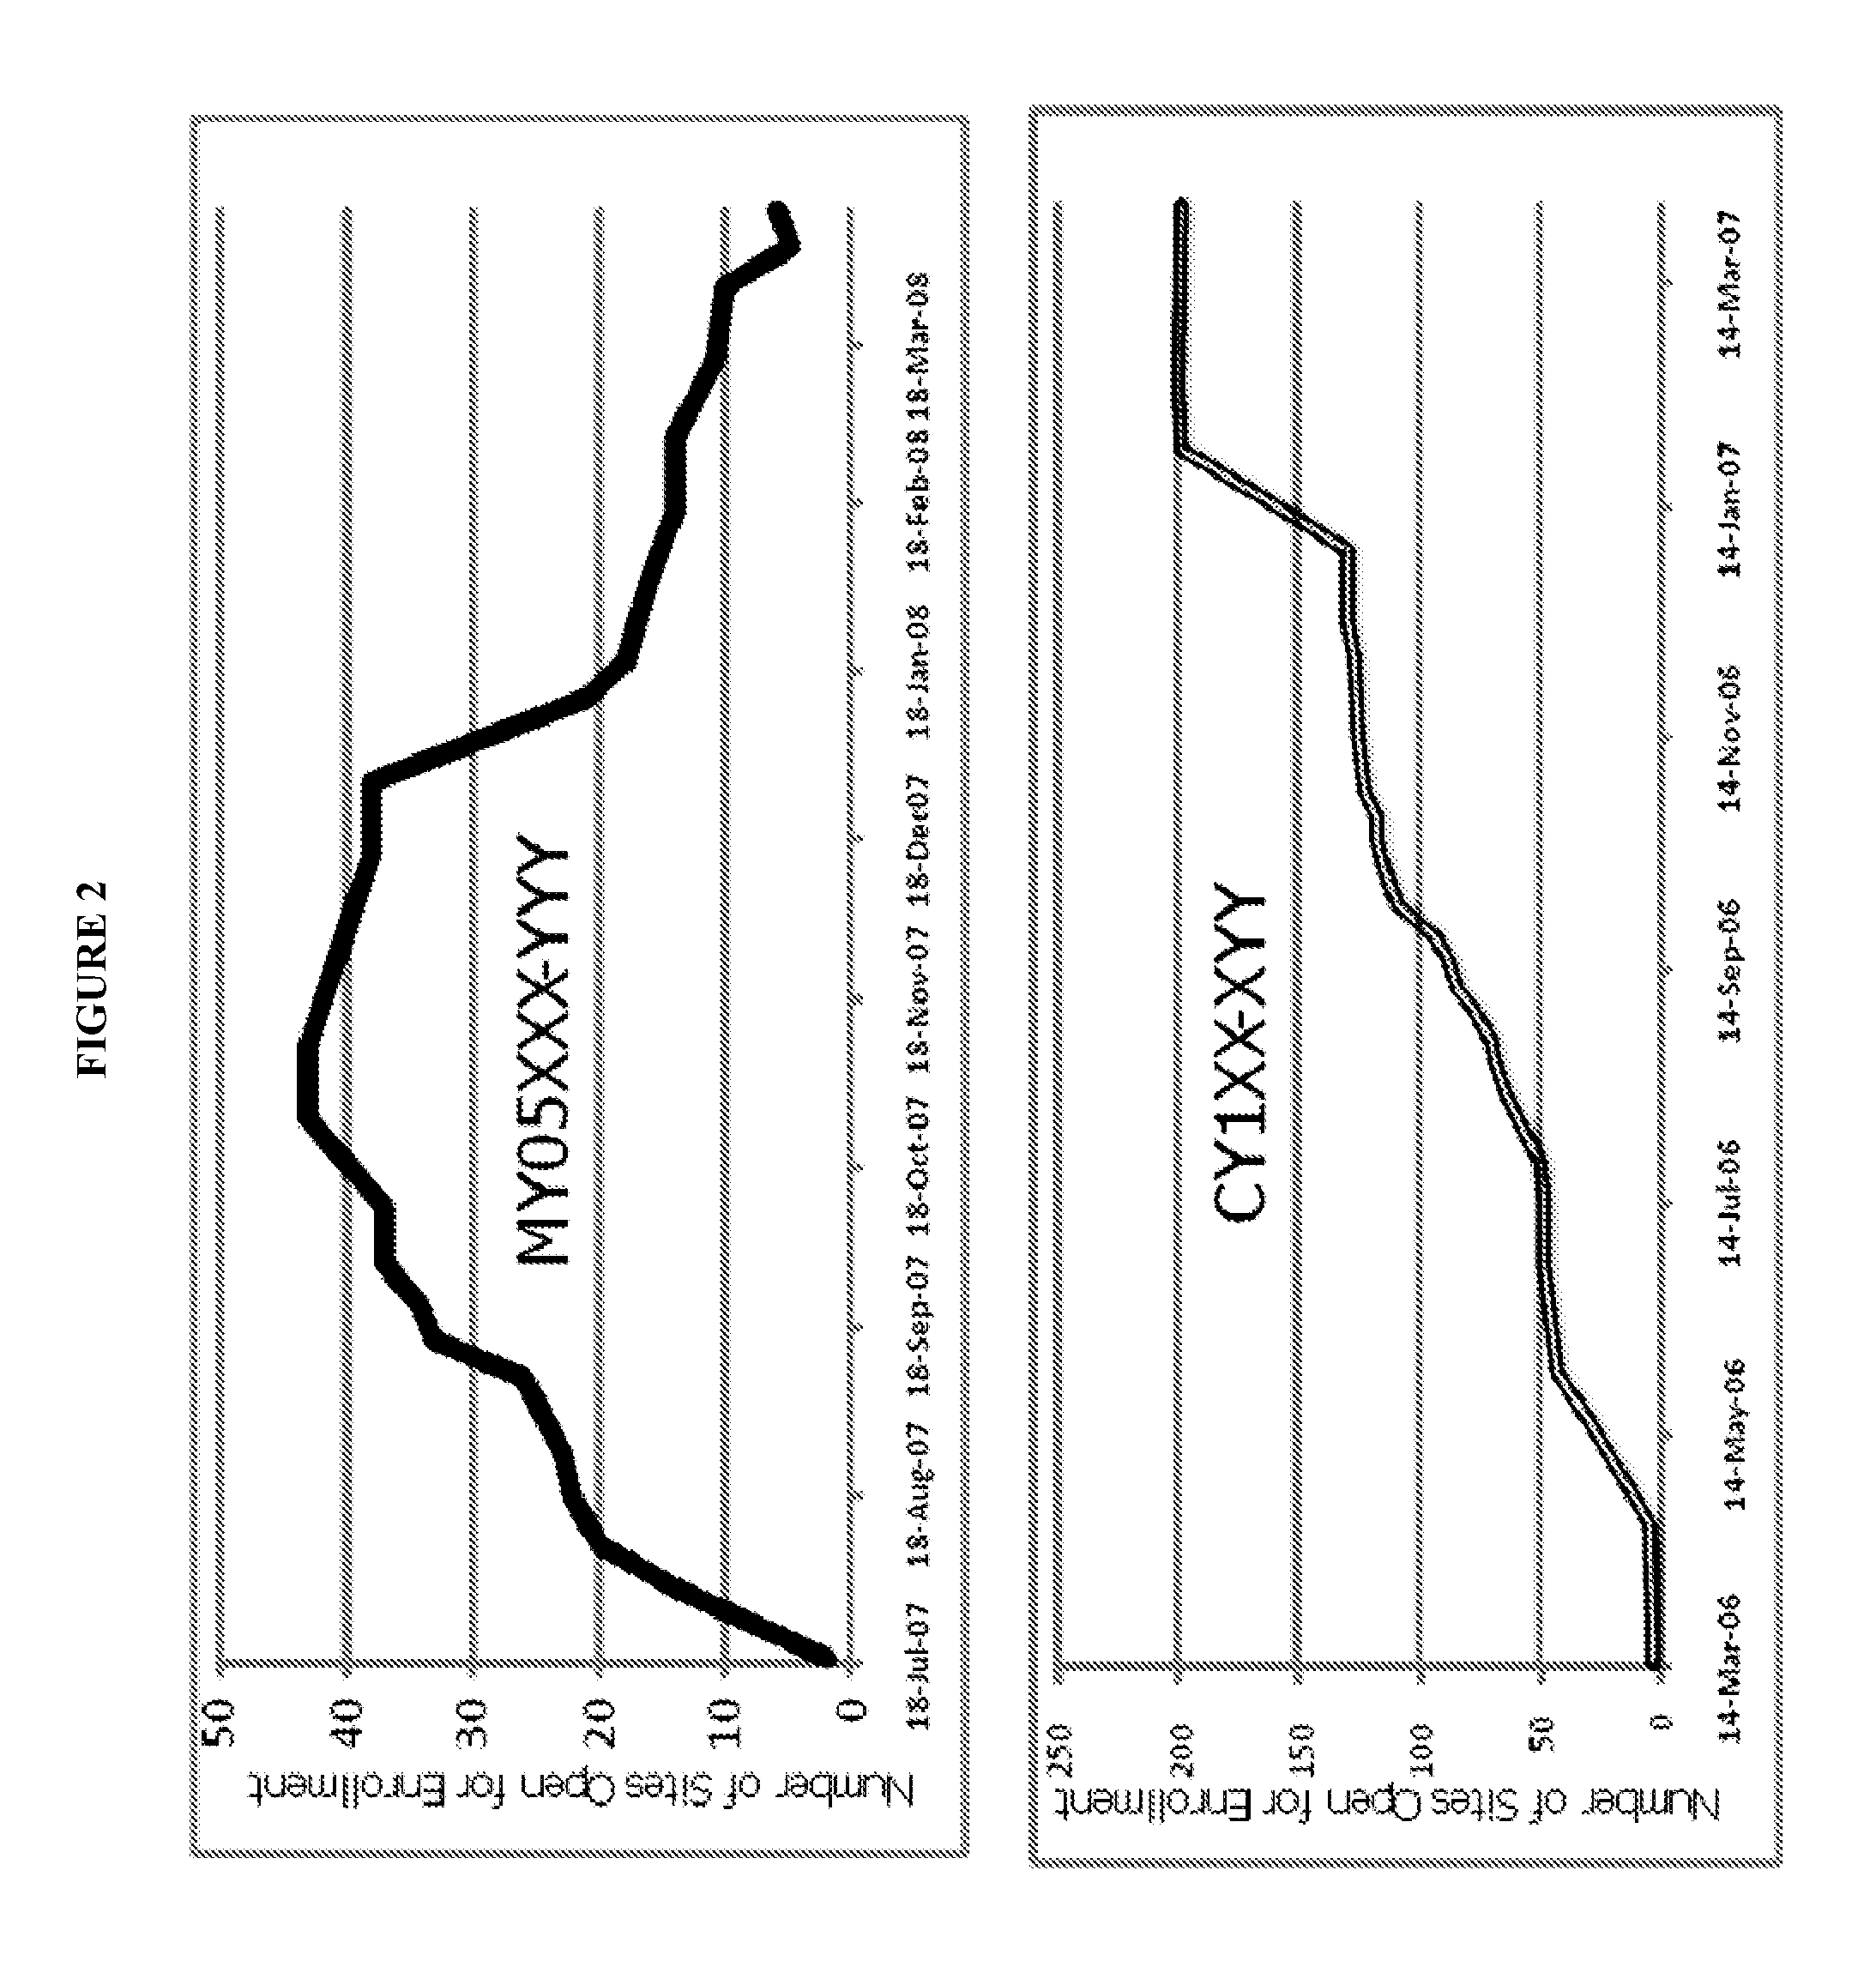
[0049]Step 1: Use a protocol synopsis of a planned clinical trial as a guidance to identify clinical trials in similar disease condition. Extract from a database historical operations data, including number of investigator sites open for patient enrollment at different point of time along the timeline between first subject first visit (FSFV) and last subject first visit (LSFV), and last subject last visit (LSLV), design of the study, key inclusion exclusion criteria, targeted number of patient enrollment, milestones including FSFV and LSFV, the company sponsoring the clinical trial, intervention(s), disease condition(s), and protocol identification(s) from sponsor(s). In the present example, diabetes is chosen as the disease condition, and the PhESiTM database is the source for historical operations data. Two examples of site activation curve charts are shown in FIG. 2.

[0050]Step 2: Data normalizatio...

example 2

Measuring Site Activation

[0060]There are different ways to measure effectiveness in trial site activation. The cycle time of site activation is one. Site activation starts from the time the first site is activated or initiated, and ends when the last site is activated. The less time between the first site activation and the last site activation, the more effective the overall activation process will be. As in the process of enrollment, site activation cycle times depend on many variables, making it difficult to compare one clinical trial against another.

[0061]Site Effectiveness Index (SEI) disclosed herein defines how effectively selected sites in a clinical trial are utilized. There are two ways to measure SEI. One is the percentage of selected sites open for enrollment over the duration of the enrollment cycle time. Another is from a single participating site perspective; its percentage of time open for enrollment compared to the overall clinical trial enrollment duration. As a pe...


PUM


Abstract

This invention provides a method of improving operational effectiveness in a clinical trial, the method comprises the steps of: obtaining historical clinical trial operation data for a disease condition; normalizing data from different clinical trials; grouping different clinical trials into groups; and calculating Site Effectiveness Index (SEI), wherein the SEI is useful for improving operational effectiveness in a clinical trial. In one embodiment, using the method disclosed herein would result in reducing the cost for the clinical trial.

Description

CROSS-REFERENCE TO RELATED APPLICATIONS[0001]This application claims benefit of U.S. Ser. No. 61 / 163,528, filed Mar. 26, 2009. The entire content and disclosure of the preceding application is incorporated by reference into this application.FIELD OF THE INVENTION[0002]This invention relates generally to methods of improving operational effectiveness in clinical trial execution.BACKGROUND OF THE INVENTION[0003]Nothing in any other industry quite compares to the pharmaceutical industry's clinical development process. In 2007, $28 billion dollars were spent on drug development. Nowadays a single clinical trial can be capital intensive (up to $500 million), with massive geographic coverage (as many as 53 countries), long duration (five years or longer), and enroll a large number of patients (20,000- to 50,000-patient trials are no longer rare).[0004]A median Phase III clinical trial involves about 800 patients, 50 investigator sites, and two years (700 days) from First Subject First Vis...

Claims


Application Information

Patent Timeline
IPC IPC(8): G06Q10/00G06Q50/00G16H10/20
CPCG06Q50/22G06Q10/00G16H10/20
Inventor LI, GEN
Owner LI GEN
Why Eureka
Try Eureka