Presaging and surfacing interactivity within data visualizations

a data visualization and interactivity technology, applied in the field of data visualization, can solve the problems of limiting the amount of user (other than the actual author of the model) that can manipulate the model, and the application does have limitations on the type of information that can be visually conveyed,

Active Publication Date: 2010-12-23
MICROSOFT TECH LICENSING LLC
View PDF51 Cites 143 Cited by
  • Summary
  • Abstract
  • Description
  • Claims
  • Application Information

AI Technical Summary

Problems solved by technology

However, any given application does have limits on the type of information that can be visually conveyed, how that information is visually conveyed, or the scope of data and behavior that can be attributed to the various visual representations.
Also, there are limits to how much a user (other than the actual author of the model) can manipulate the model to test various scenarios.

Method used


Image

  • Presaging and surfacing interactivity within data visualizations
  • Presaging and surfacing interactivity within data visualizations
  • Presaging and surfacing interactivity within data visualizations

Examples


Embodiment Construction

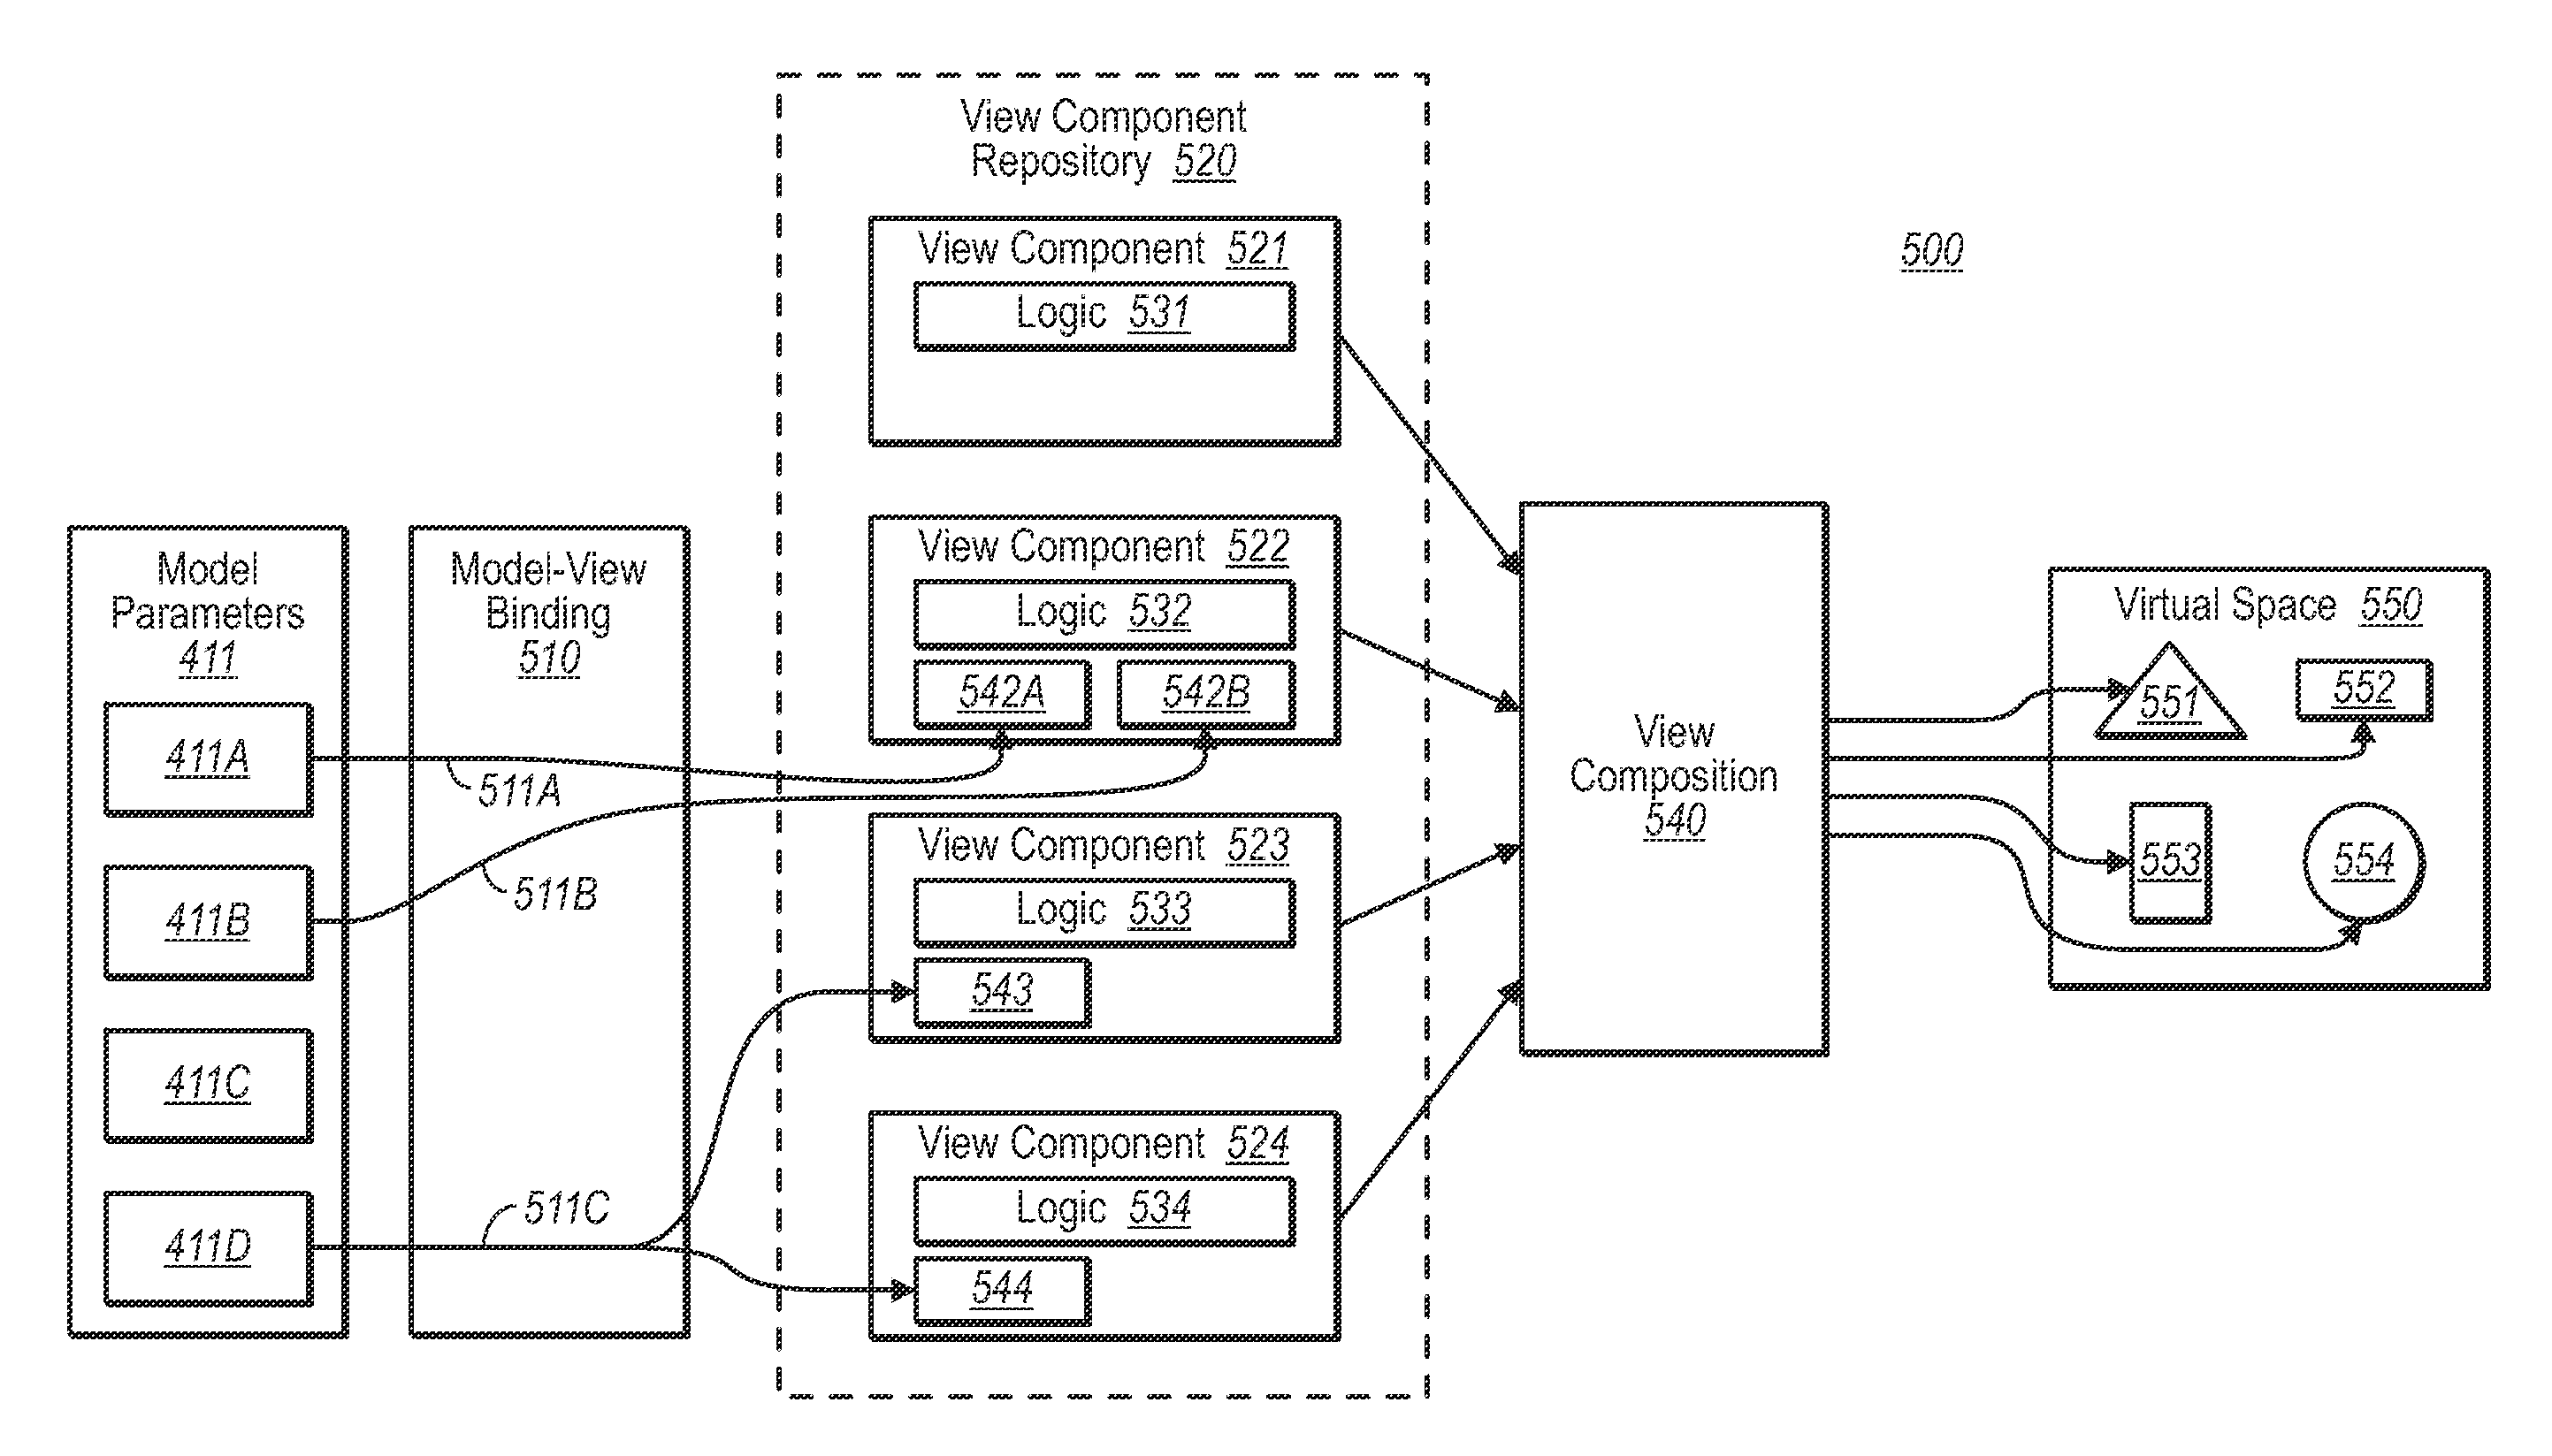
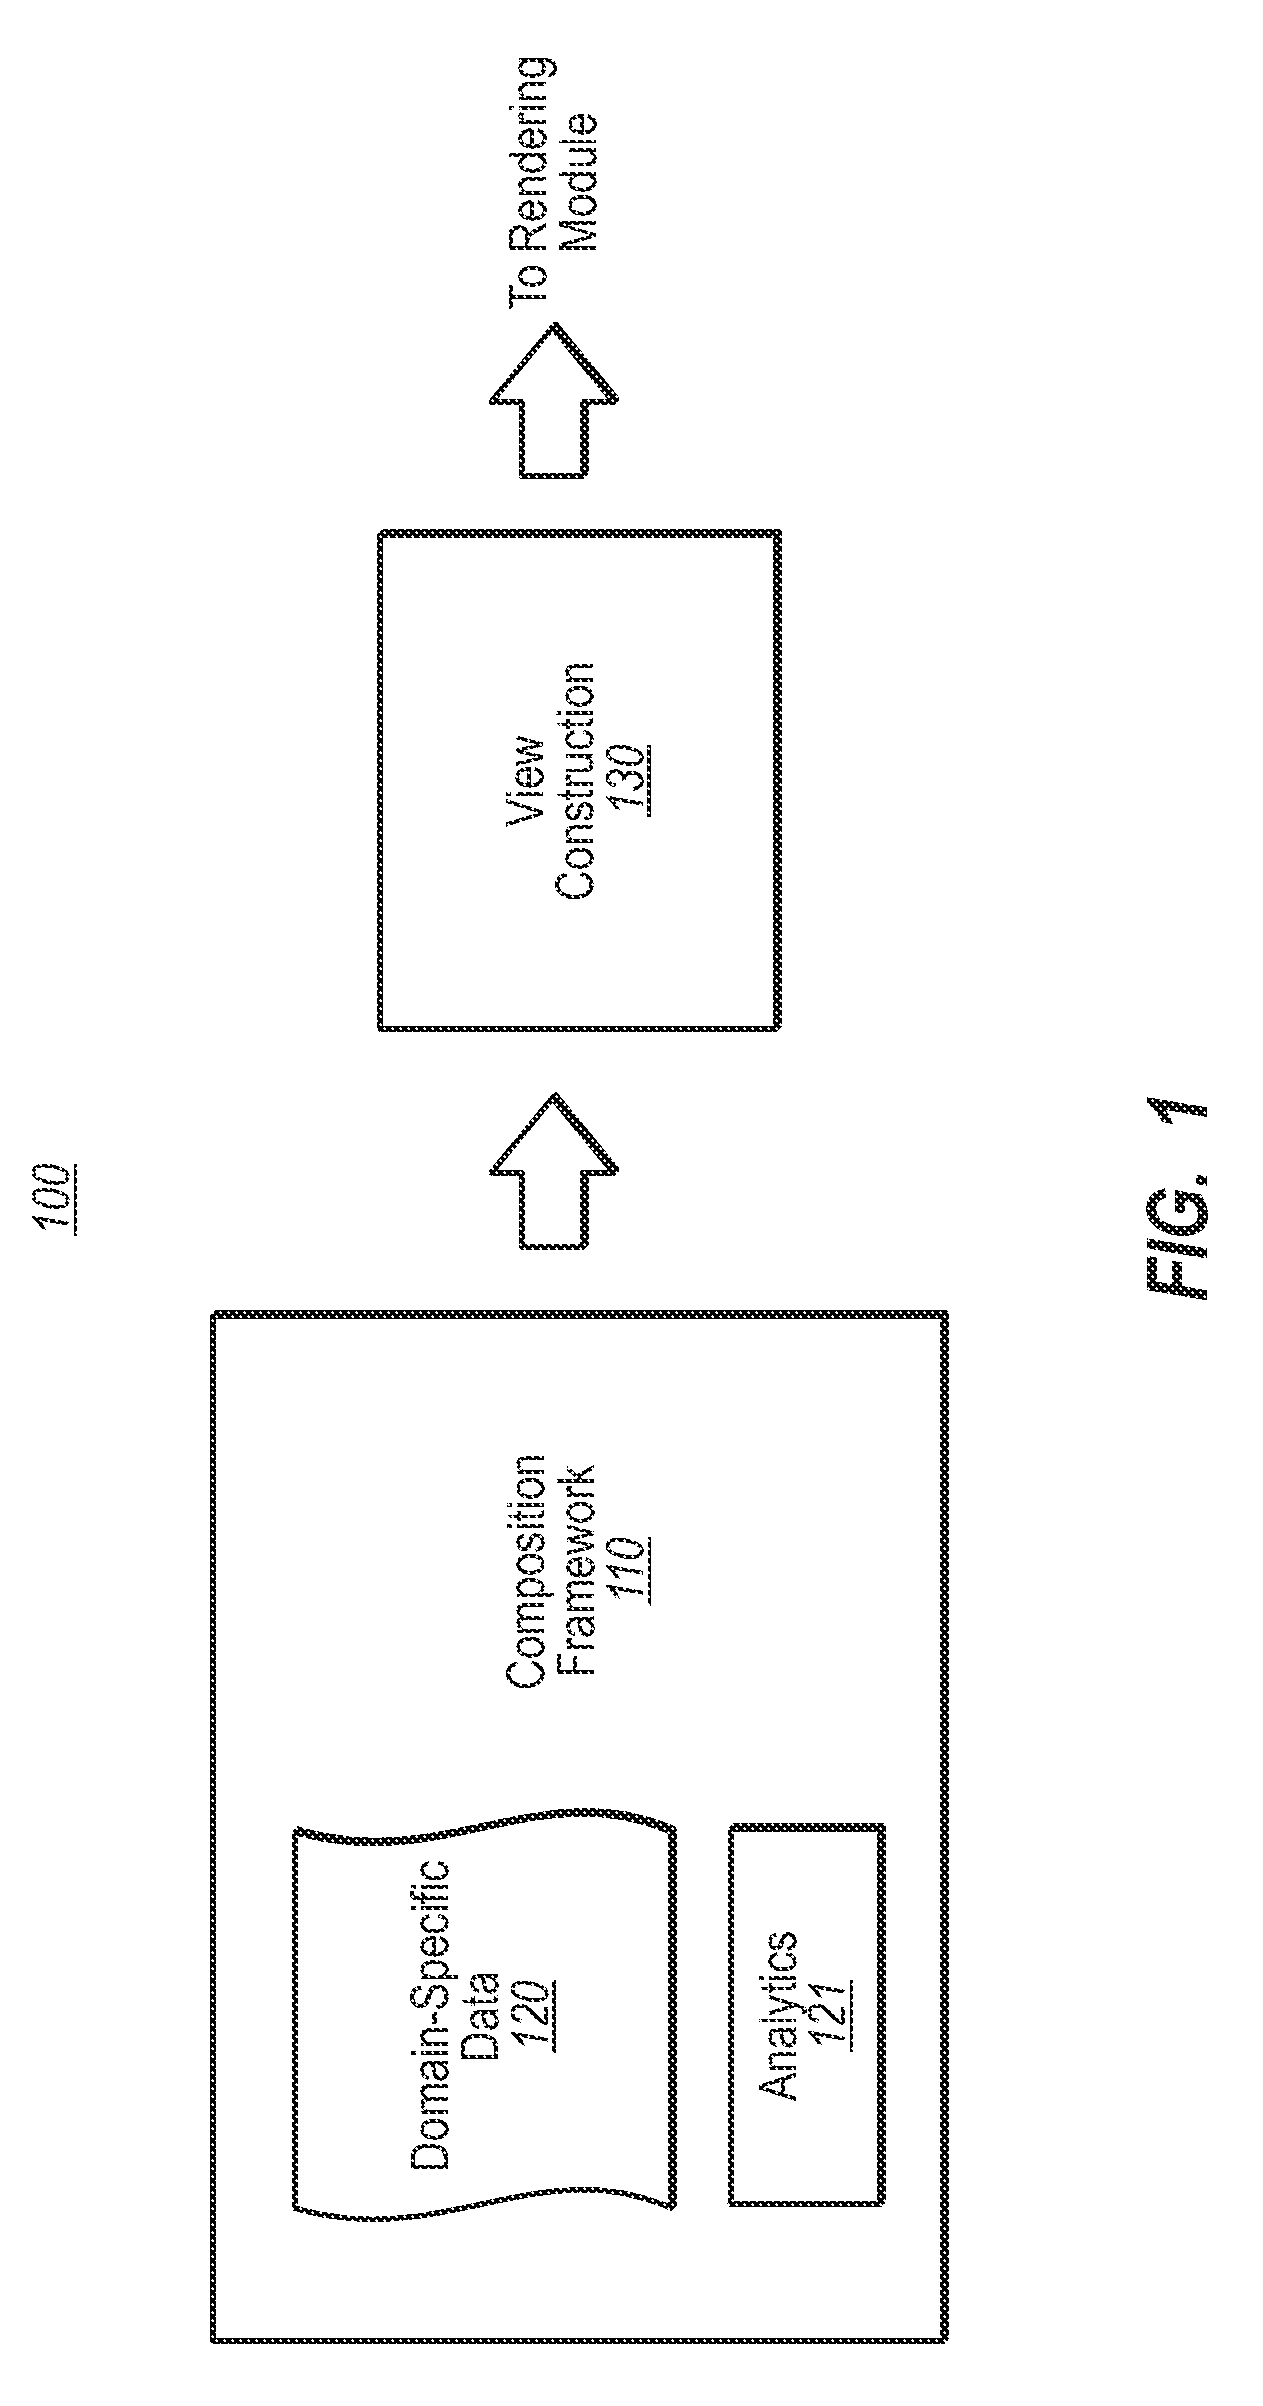
[0052]FIG. 1 illustrates a visual composition environment 100 that uses data-driven analytics and visualization of the analytical results. The environment 100 (also called hereinafter a “pipeline”) includes a composition framework 110 that performs logic that is performed independent of the problem-domain of the view construction 130. For instance, the same composition framework 110 may be used to compose interactive view compositions for city plans, molecular models, grocery shelf layouts, machine performance or assembly analysis, or other domain-specific renderings. As will be described, the analytics may be used to search and explore in various scenarios. First, however, the basic composition framework 110 will be described in detail.

[0053]The composition framework 110 performs analytics 121 using domain-specific data 120 that is taxonomically organized in a domain-specific way to construct the actual view construction 130 (also called herein a “view composition”) that is specifi...


PUM


Abstract

The use of visual cues associated with rendered visual items to cue a user on whether a rendered visual item has interactive capability and / or what type of interaction is possible with that visual item. The visual items may be rendered in a data driven way with each constructed using a corresponding parameterized view component. The parameter(s) are populated by data, perhaps by model variables obtained from an analytical model. The parameters then drive logic associated with the view component to thereby construct a visual item which may then be rendered. The rendering engine then renders the visual item with the visual cue. The user may then interact with the rendered visual item. Such interaction might cause some external action to occur, might change which visual items are displayed, and / or might change a value of the input parameters of one or more view components used to generate displayed visual items.

Description

BACKGROUND[0001]Often, the most effective way to convey information to a human being is visually. Accordingly, millions of people work with a wide range of visual items in order to convey or receive information, and in order to collaborate. Such visual items might include, for example, concept sketches, engineering drawings, explosions of bills of materials, three-dimensional models depicting various structures such as buildings or molecular structures, training materials, illustrated installation instructions, planning diagrams, and so on.[0002]More recently, these visual items are constructed electronically using, for example, Computer Aided Design (CAD) and solid modeling applications. Often these applications allow authors to attach data and constraints to the geometry. For instance, the application for constructing a bill of materials might allow for attributes such as part number and supplier to be associated with each part, the maximum angle between two components, or the lik...

Claims


Application Information

Patent Timeline
Patent Type & Authority Applications(United States)
IPC IPC(8): G06F3/048
CPCG06T19/20G06F3/04815
Inventor MITAL, VIJAYRUBIN, DARRYL E.WOLF, JASON A.PAYNE, JOHN A.GREEN, DAVID G.
Owner MICROSOFT TECH LICENSING LLC
Why Eureka
Try Eureka