System and method for analyzing an electrocardiogram signal

a system and signal technology, applied in the field of system and method for analyzing an electrocardiogram signal, can solve the problems of automatic measurement of st segment deviation and classification and achieve the effect of improving the accuracy of st segment morphology and accuracy

Active Publication Date: 2011-02-17
SIEMENS HEALTHCARE GMBH
View PDF3 Cites 26 Cited by
  • Summary
  • Abstract
  • Description
  • Claims
  • Application Information

AI Technical Summary

Benefits of technology

[0005]Briefly, in accordance with one aspect of the present invention, a system for analyzing an electrocardiogram (ECG) signal comprises an interface that receives and digitizes an ECG signal waveform associated with a series of heart beat cycles of a patient and a signal processor that processes digitized data samples representing the ECG waveform to evaluate an ST segment deviation. To determine ST segment deviation the signal processor determines a first and a second isoelectric portion of the ECG waveform, the first isoelectric portion lying temporally between a T-wave of a first heart beat cycle and a P-wave of a successive heart beat cycle, the second isoelectric portion lying temporally between a P-wave of the first heart beat cycle and a QRS complex of the first heart beat cycle. The signal processor further determines a stability measure for each of said first and second isoelectric portions. The signal processor adaptively selects the first isoelectric portion or the second isoelectric portion as a baseline for the first heart beat cycle based on the stability measures of the first and second isoelectric portions. The signal processor further determines a point of reference on an ST segment on the ECG waveform associated with the first heart beat cycle and evaluates a deviation of the determined point of reference on the ST segment from the selected baseline.
[0006]In accordance another aspect of the present invention, a method for analyzing an electrocardiogram (ECG) comprises providing digitized data samples of an ECG waveform associated with a plurality of heart beat cycles of a patient. The method then includes determining a first isoelectric portion of said ECG waveform from data samples of said ECG waveform between a T-wave of a first heart beat cycle and a P-wave of a successive heart beat cycle and a second isoelectric portion of said ECG waveform from data samples of said ECG signal waveform between P-wave of the first heart beat cycle and a QRS complex of the first heart beat cycle. The method further comprises determining a stability measure for each of said first and second isoelectric portions and adaptively selecting the first isoelectric portion or the second isoelectric portion as a baseline for the first heart beat cycle based on a comparison of the stability measures of said first and second isoelectric portions. Still further, the method comprises determining a point of reference on an ST segment of the ECG waveform associated with the first heart beat cycle and evaluating a deviation of the point of reference with respect to the selected baseline.
[0007]In accordance with yet another aspect, a method for aiding diagnosis of a medical condition a patient from an electrocardiogram (ECG), comprises providing digitized data samples of an ECG waveform associated with a plurality of heart beat cycles of the patient. The method further includes adaptively selecting a baseline for a first heart beat cycle between a first isoelectric portion of said ECG waveform lying temporally between a T-wave of the first heart beat cycle and a P-wave of a successive heart beat cycle and a second isoelectric portion lying temporally between P-wave of the first heart beat cycle and a QRS complex of the first heart beat cycle. The adaptive selection being based on a stability measure determined for each of said first and second isoelectric portions. Further, the method includes evaluating a deviation of a J-point on an ST segment associated with the first heart beat cycle with respect to the selected baseline. The method subsequently includes classifying the ST segment into one of a plurality of morphological classes based on the determined deviation of the J-point from the selected baseline.

Problems solved by technology

However, automated measurement of ST segment deviation and classification of ST segment morphology presents technical difficulties like the presence of noise in the signal, baseline wander of the signal and so on.

Method used


Image

  • System and method for analyzing an electrocardiogram signal
  • System and method for analyzing an electrocardiogram signal
  • System and method for analyzing an electrocardiogram signal

Examples


Embodiment Construction

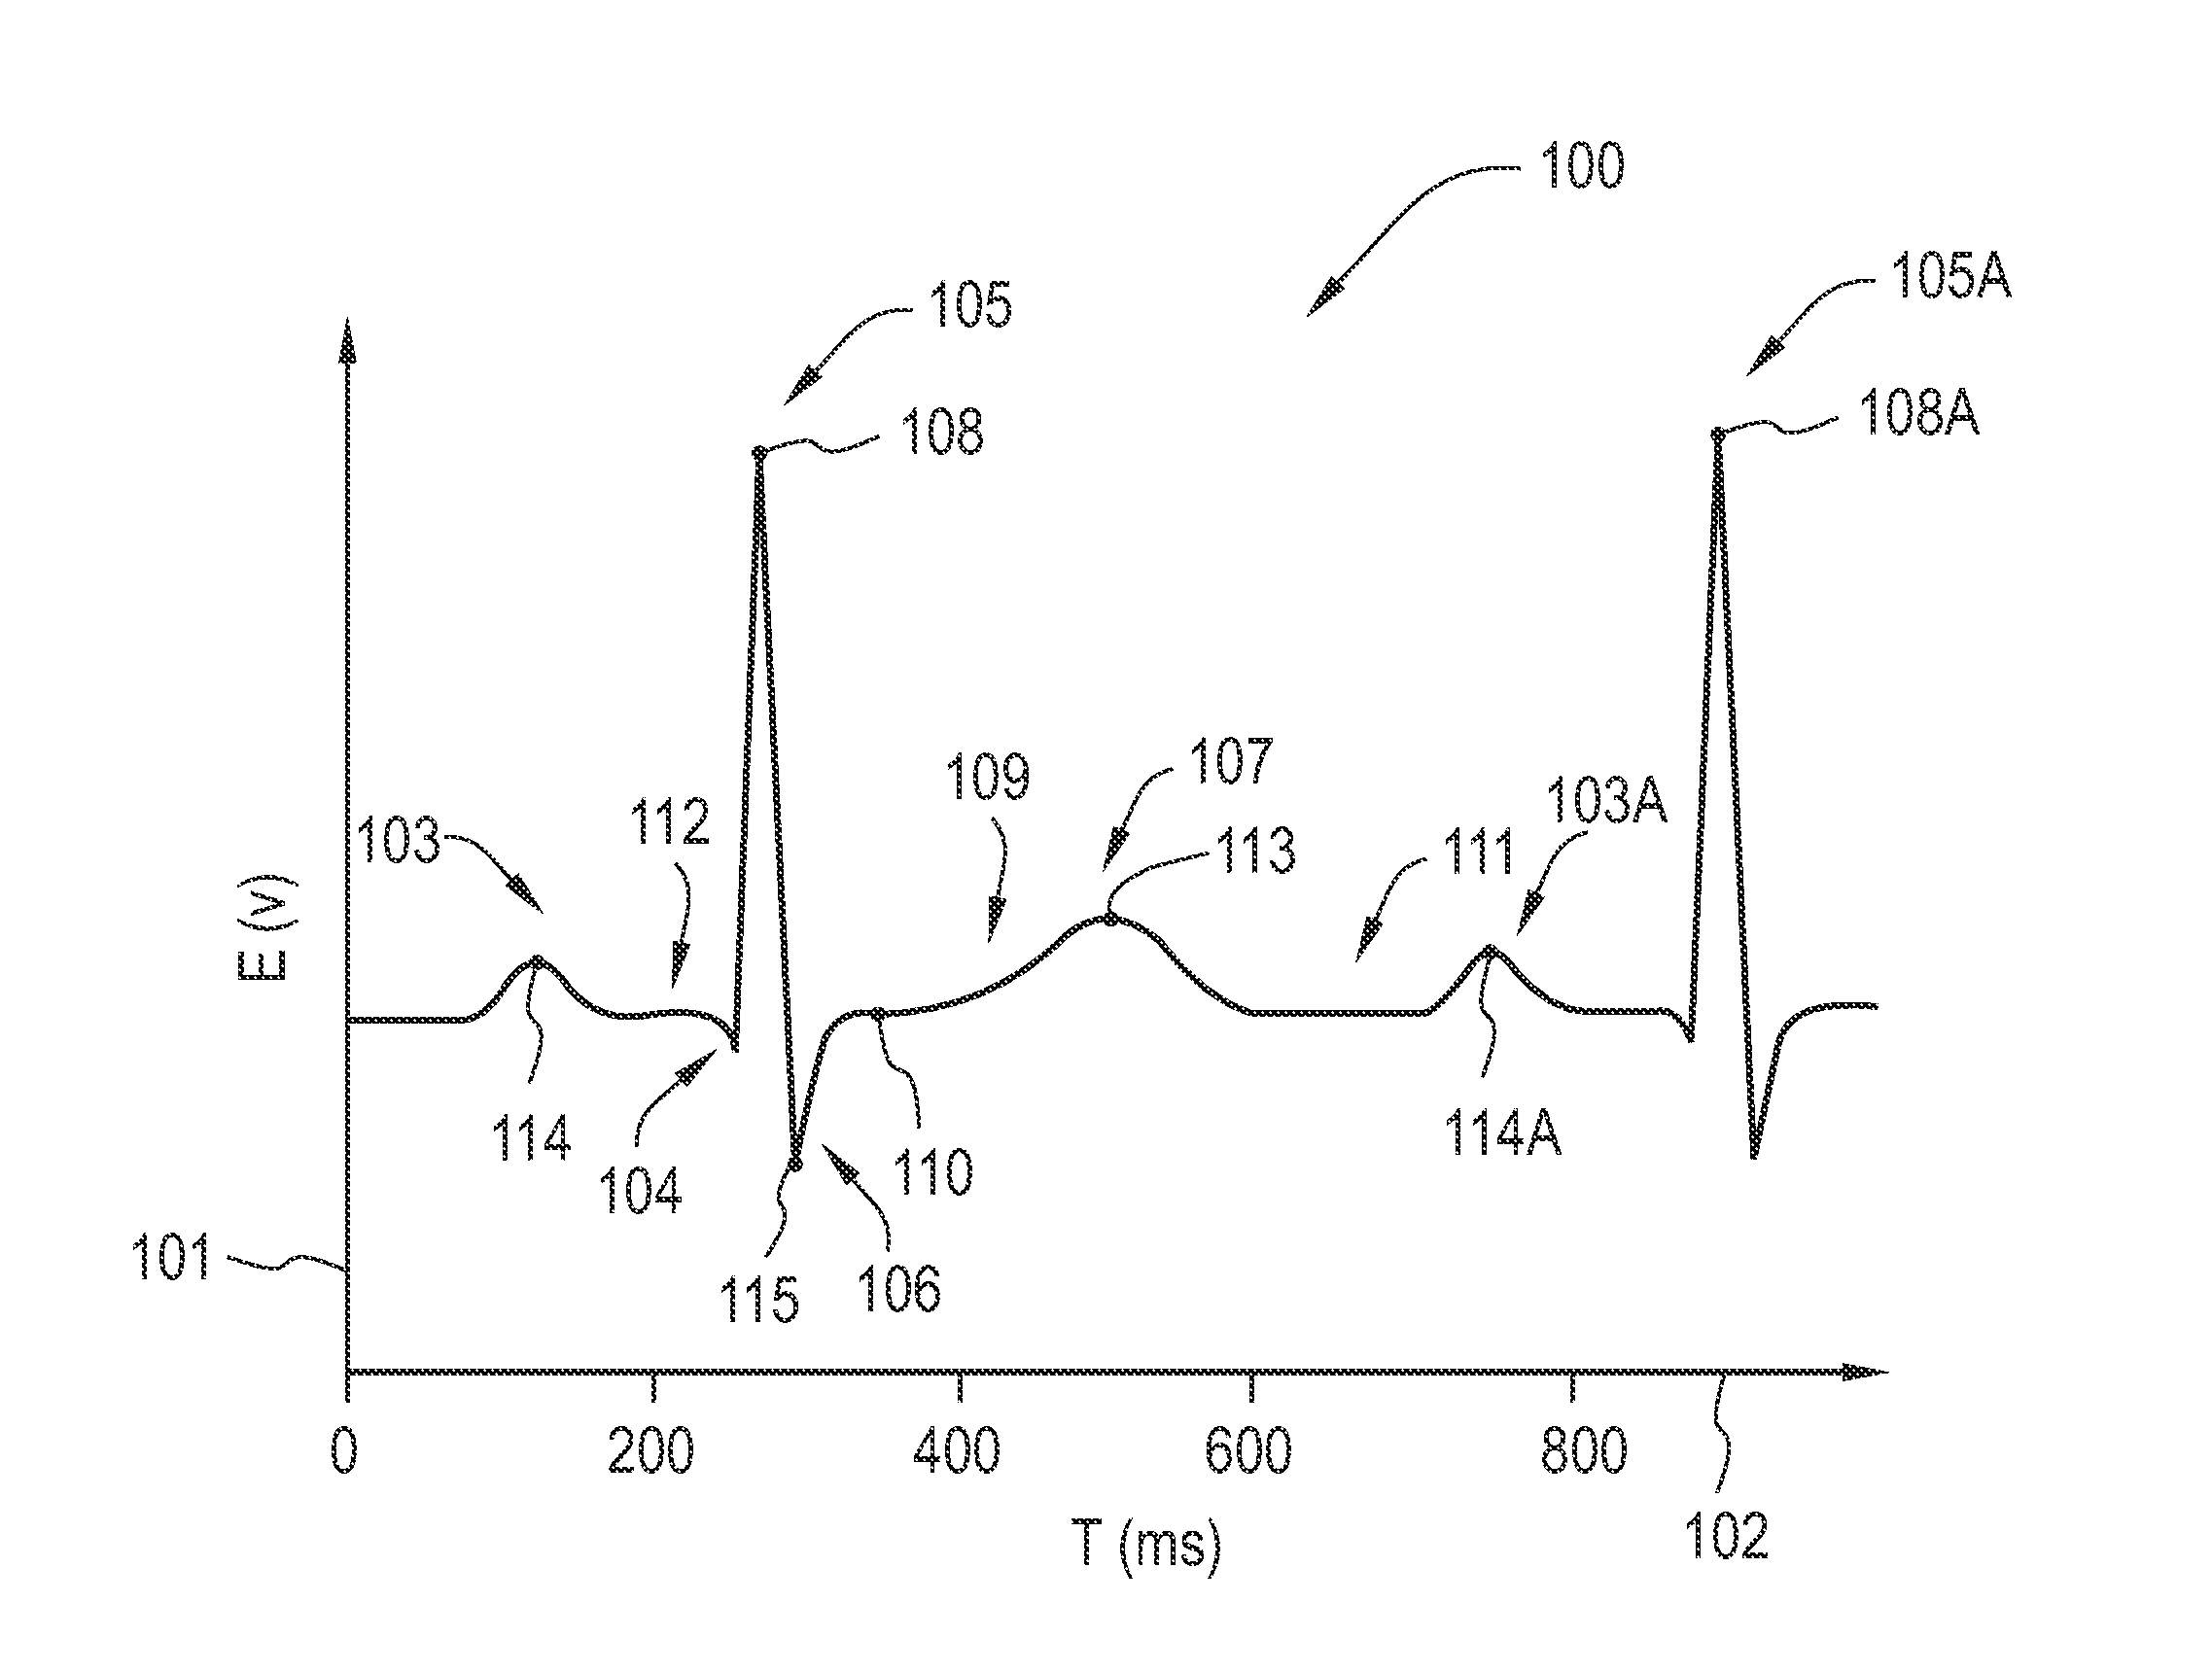
[0019]FIG. 1 shows an exemplary plot 100 representative of human ECG waveform, wherein the axis 101 represents an electrical voltage (V) associated with heart electrical activity of a patient as measured by an ECG electrode and the axis 102 represents time (ms). A deflection 103 is known as a “P-wave” and is a resultant of excitation of the atria of the heart. Deflections 104, 105 and 106 are known as “Q-wave,”“R-wave,” and “S-wave” respectively. The Q-wave, R-wave and S-wave in the ECG waveform result from excitation (de-polarization) of the ventricles of the heart and are hence collectively referred to as a QRS complex. It should be noted that not every QRS complex contains a Q-wave, an R-wave, and an S-wave. By convention, any combination of these waves can be referred to as a QRS complex. Deflection 107 is known as a “T-wave” and is a resultant of recovery (repolarization) of the ventricles. The temporal distance on the ECG waveform from the peak point 108 of a first R-wave 105 ...


PUM


Abstract

A system for analyzing an ECG signal is provided. The system comprises an interface that receives an ECG waveform associated with heart beat cycle of a patient. The system includes signal processor that determines a first isoelectric portion lying between a T-wave of a first heart beat cycle and a P-wave of a successive heart beat cycle, and a second isoelectric portion lying between a P-wave and a QRS complex of the first heart beat cycle. The signal processor determines a stability measure for each of said first and second portions and adaptively selects the first or the second portion as a baseline for the first heart beat cycle based on the stability measures. The signal processor determines a point of reference on an ST segment associated with the first heart beat cycle and evaluates a deviation of the point of reference on the ST segment from the selected baseline.

Description

FIELD OF INVENTION[0001]The present invention relates to a system and method for analyzing an electrocardiogram (ECG) signal, in particular, for estimating an ST segment deviation for evaluating a medical condition of a patient.BACKGROUND OF INVENTION[0002]Electrocardiography is the recording of the electrical activity of the heart over time via skin electrodes. An electrocardiogram (ECG) is used by cardiologists to aid in the diagnosis of various cardiac abnormalities. Cardiac arrhythmia and ischemia are some of the conditions that are identified through the analysis of ECG. There is a strong correlation between the ST segment deviation and the incidence of ischemia and thus ST segment deviation measurement is an important parameter in clinical study. Further, morphology of the ST segment is an important clinical parameter in identifying a type of heart attack. Some of these types of heart attacks are ST Elevation Myocardial Infarction (STEMI) and Non ST Elevation Myocardial Infarc...

Claims


Application Information

Patent Timeline
Patent Type & Authority Applications(United States)
IPC IPC(8): A61B5/0468A61B5/364
CPCA61B5/726A61B5/0472A61B5/366
Inventor DOUGLAS, ANTONY LOUIS PIRIYAKUMARSCHULLERI, WIEBKE
Owner SIEMENS HEALTHCARE GMBH
Why Eureka
Try Eureka