Computer-implemented visualization method

a computer and visualization technology, applied in the field of computer-implemented visualization methods and systems, can solve problems such as increasing the need for advanced visualization techniques

Inactive Publication Date: 2011-04-28
IBM CORP
View PDF9 Cites 24 Cited by
  • Summary
  • Abstract
  • Description
  • Claims
  • Application Information

AI Technical Summary

Problems solved by technology

Complex data such as large amounts of highly dimensional data intensify the need for advanced visualization techniques.

Method used


Image

  • Computer-implemented visualization method
  • Computer-implemented visualization method
  • Computer-implemented visualization method

Examples


Embodiment Construction

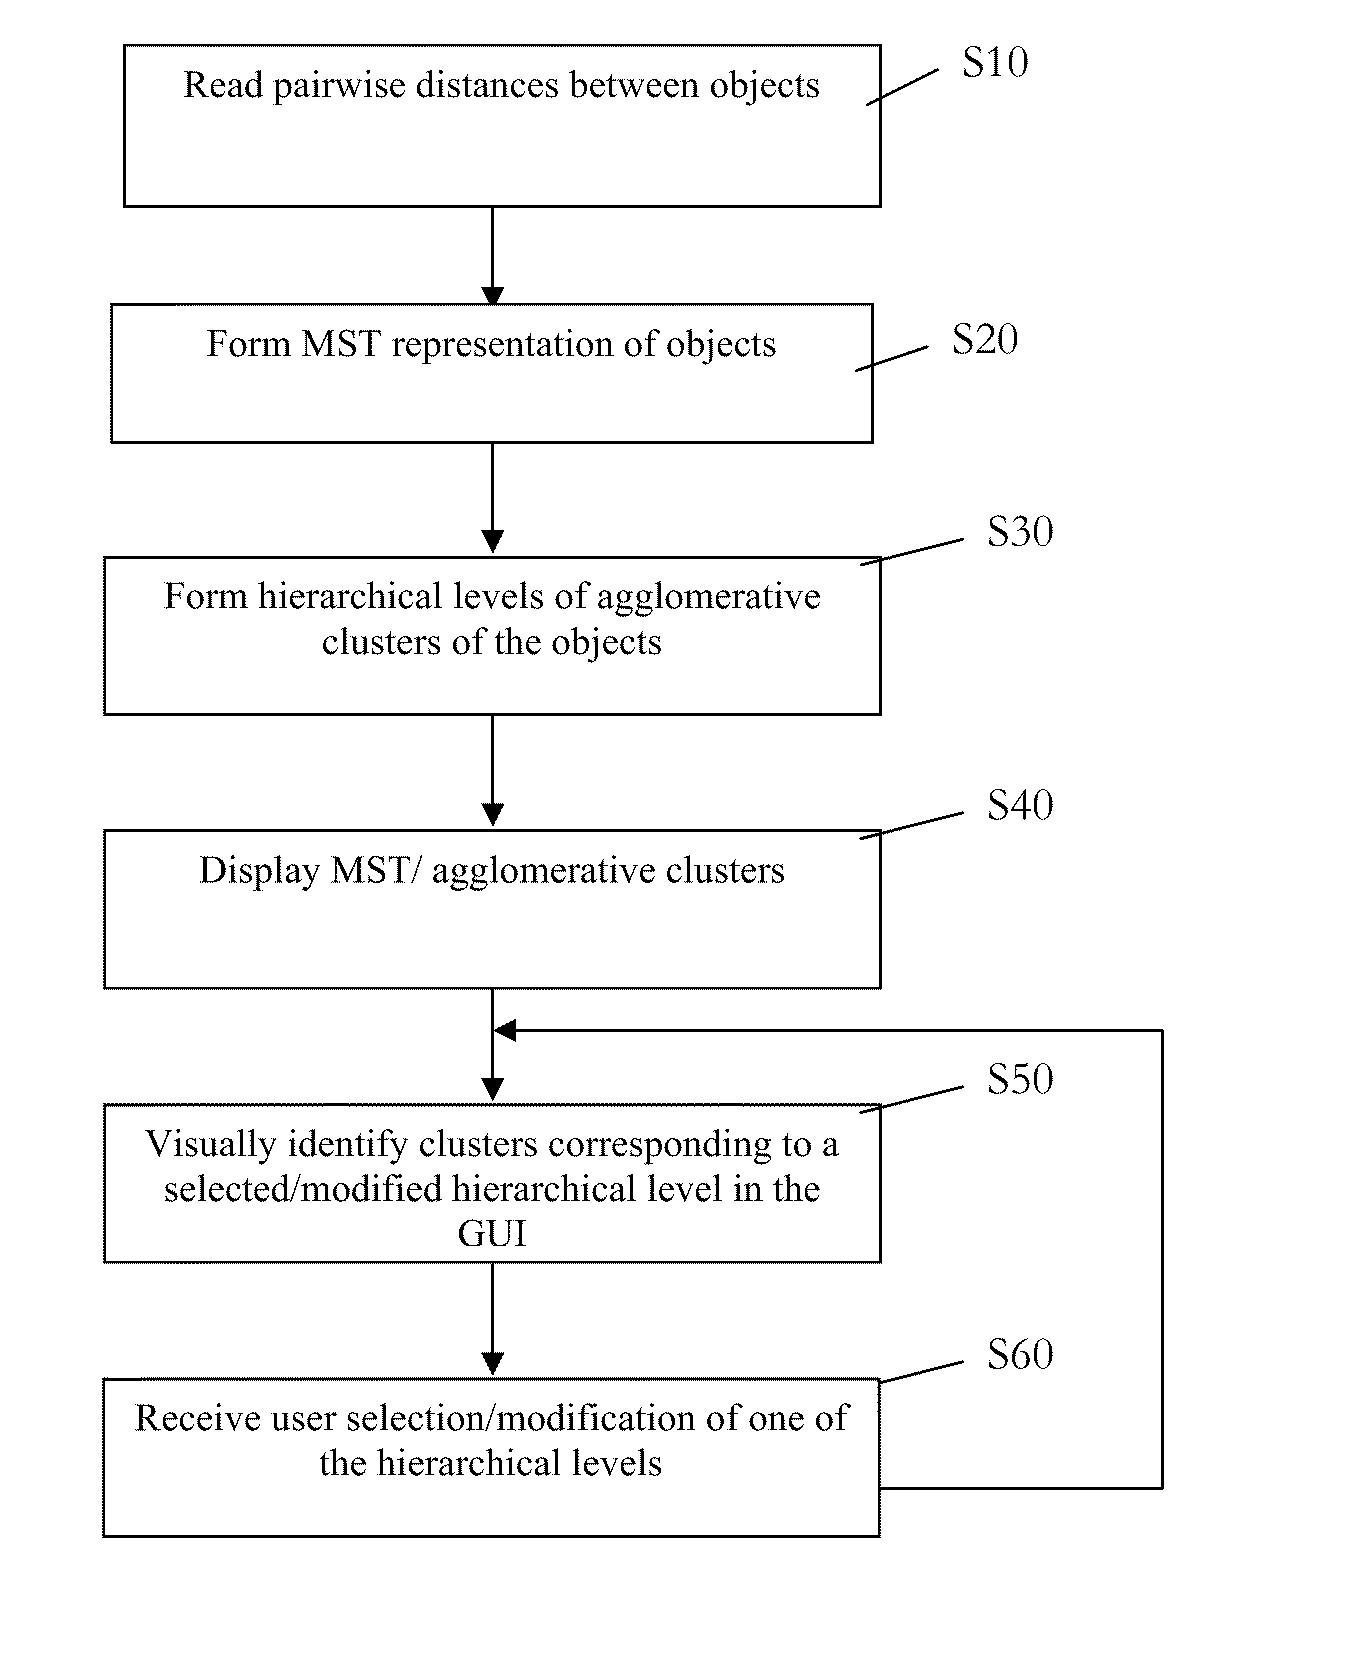
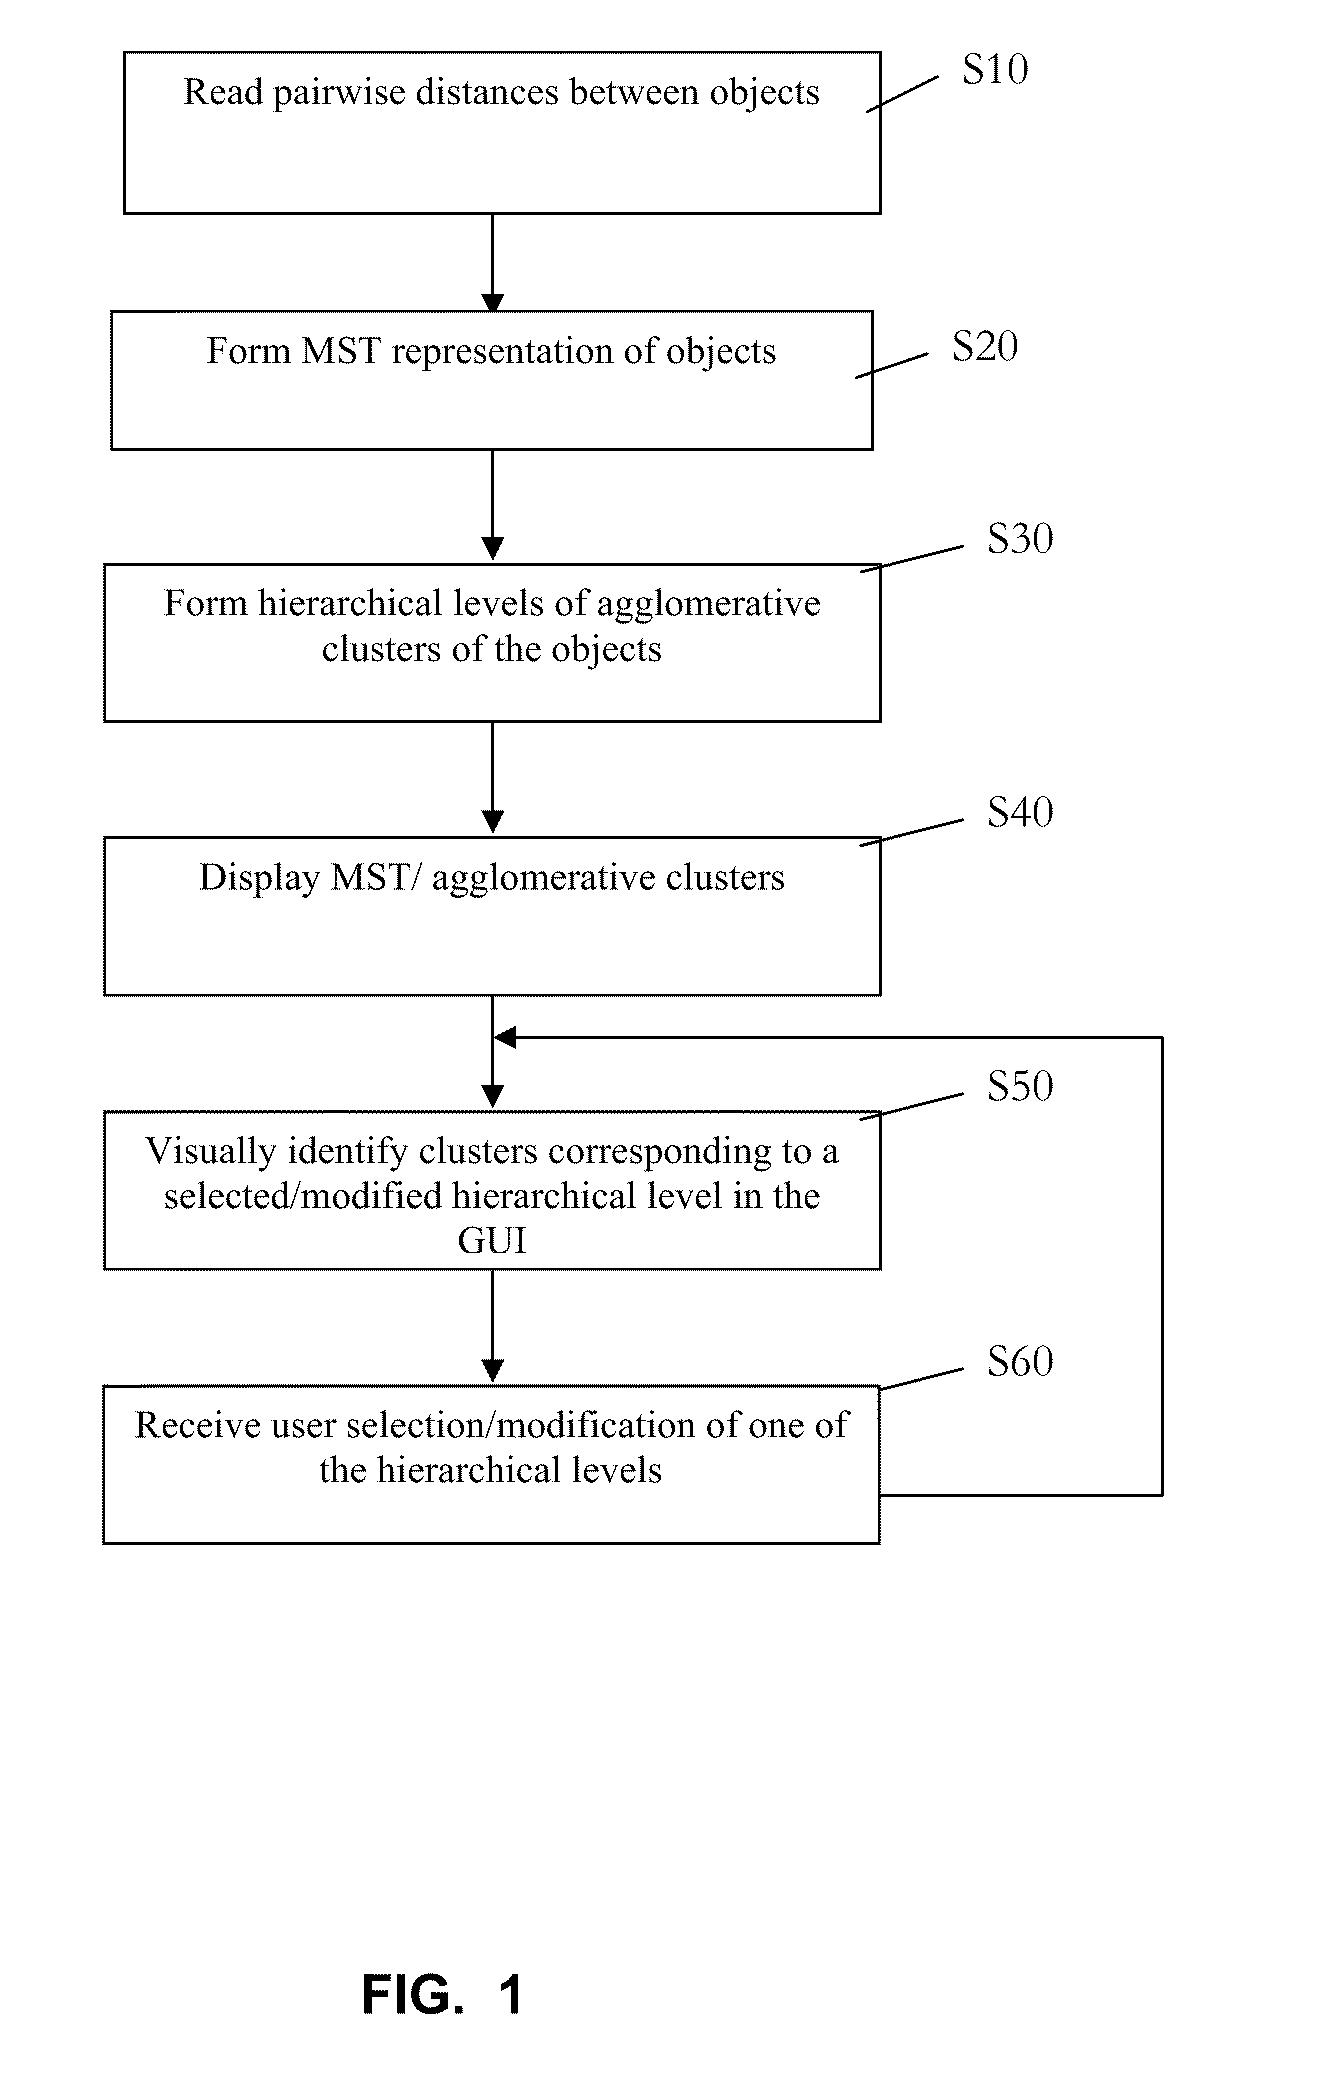
[0016]Many data visualization techniques have been introduced in the recent years. For instance, some known techniques put emphasis on pairwise distances between objects, where other techniques, such as hierarchical clustering, focus on cluster information.

[0017]These so-called “information visualization” techniques aim at providing visual representation of large-scale collections of non-numerical information, such as files and lines of code in software systems. In addition, these techniques make use of graphical techniques to help in understanding and analyzing data. Information visualization focuses on abstract data sets, such as unstructured text or points in high-dimensional spaces that do not have an inherent 2D or 3D geometrical structure.

[0018]More generally, in computer graphics sciences, visualization techniques today have expanding applications in every domain. Some examples of these visualization techniques are:[0019]Treemaps: treemapping aims at displaying tree-structure...


PUM


Abstract

A method, system and computer product for visualizing affinities between objects. The method includes the steps of: forming a representation of a minimum spanning tree where the minimum spanning tree connects the plurality of objects based on a pairwise distance between the plurality of objects; forming a hierarchical cluster of the plurality of objects where the hierarchical cluster includes a level; agglomerating the plurality of objects based on the pairwise distance; displaying a view of the representation of the minimum spanning tree in a graphical user interface; receiving a user selection of a parameter containing a hierarchical level; and identifying, in the view, a target cluster that corresponds to the hierarchical level; where at least one of the steps is carried out using a computer device so that affinities between the plurality of objects are visualized.

Description

CROSS-REFERENCE TO RELATED APPLICATION[0001]This application claims priority under 35 U.S.C. §119 from European Patent Application No. 09173945.8 filed Oct. 23, 2009, the entire contents of which are incorporated herein by reference.BACKGROUND OF THE INVENTION[0002]The invention relates to the field of computer-implemented visualization methods and systems. More specifically, a data visualization technique which emphasizes affinities between objects is shown.[0003]Today, data visualization is a task inherent to data analysis and data mining. Complex data such as large amounts of highly dimensional data intensify the need for advanced visualization techniques. Ideally, such techniques translate the original data structure into a more comprehensible structure where interrelations between objects become more apparent.SUMMARY OF THE INVENTION[0004]Accordingly, one aspect of the present invention provides a visualization method for visualizing affinities between a plurality of objects, t...

Claims


Application Information

Patent Timeline
Patent Type & Authority Applications(United States)
IPC IPC(8): G06K9/62
CPCG06F18/231G06F18/40
Inventor LABBI, ABDERRAHIMVLACHOS, MICHAIL
Owner IBM CORP
Why Eureka
Try Eureka