Method of determining a reliability indicator for signatures obtained from clinical data and use of the reliability indicator for favoring one signature over the other

Active Publication Date: 2011-07-14
KONINKLIJKE PHILIPS ELECTRONICS NV
View PDF0 Cites 0 Cited by
  • Summary
  • Abstract
  • Description
  • Claims
  • Application Information

AI Technical Summary

Benefits of technology

[0010]Thus, it is now possible to compare signatures for their “alignment” with particular parallel stratification criteria and thus help to eliminate spurious patterns.
[0025]Thus, by using such iterative application of the reliability indicator, the effect of overfitting is diminished or at least reduced depending on the stratification power of the parallel criterion.

Problems solved by technology

In addition, the awareness is growing among biologists and clinicians that it is unlikely that single-variable (univariate) signatures will be discovered for most diseases and conditions of interest; multi-variable (multivariate) signatures are believed to be necessary which increases the combinatorial challenge of the signature discovery.
One difficulty that plagues this domain is that the datasets are invariably characterized as being measurement-rich but case-poor, i.e. there are significantly many more measurements than patients.
As a consequence, pattern discovery methods become prone to discovering spurious patterns, i.e. patterns that predict well on the given data, but poorly on new cases.
Various schemes for reducing the number of measurements by discarding some believed to be of low quality or unlikely to be related to the clinical question, such as schemes for re-sampling and cross-validation, have been applied to overcome overfitting, but the problem cannot be completely overcome by theses methods.

Method used


Image

  • Method of determining a reliability indicator for signatures obtained from clinical data and use of the reliability indicator for favoring one signature over the other
  • Method of determining a reliability indicator for signatures obtained from clinical data and use of the reliability indicator for favoring one signature over the other
  • Method of determining a reliability indicator for signatures obtained from clinical data and use of the reliability indicator for favoring one signature over the other

Examples


example 1

[0061]

SIMILARITY1(si,ri1>,<si,ri2>)=count(ri1≠ri2).

example 2

[0062]

SIMILARITY2(si,ri1>,<si,ri2>)=ri1≠ri2)&ri2cA, count(ri1≠ri2)&ri2=cB>,

[0063]where cA can be say aggressive, and cB non-aggressive.

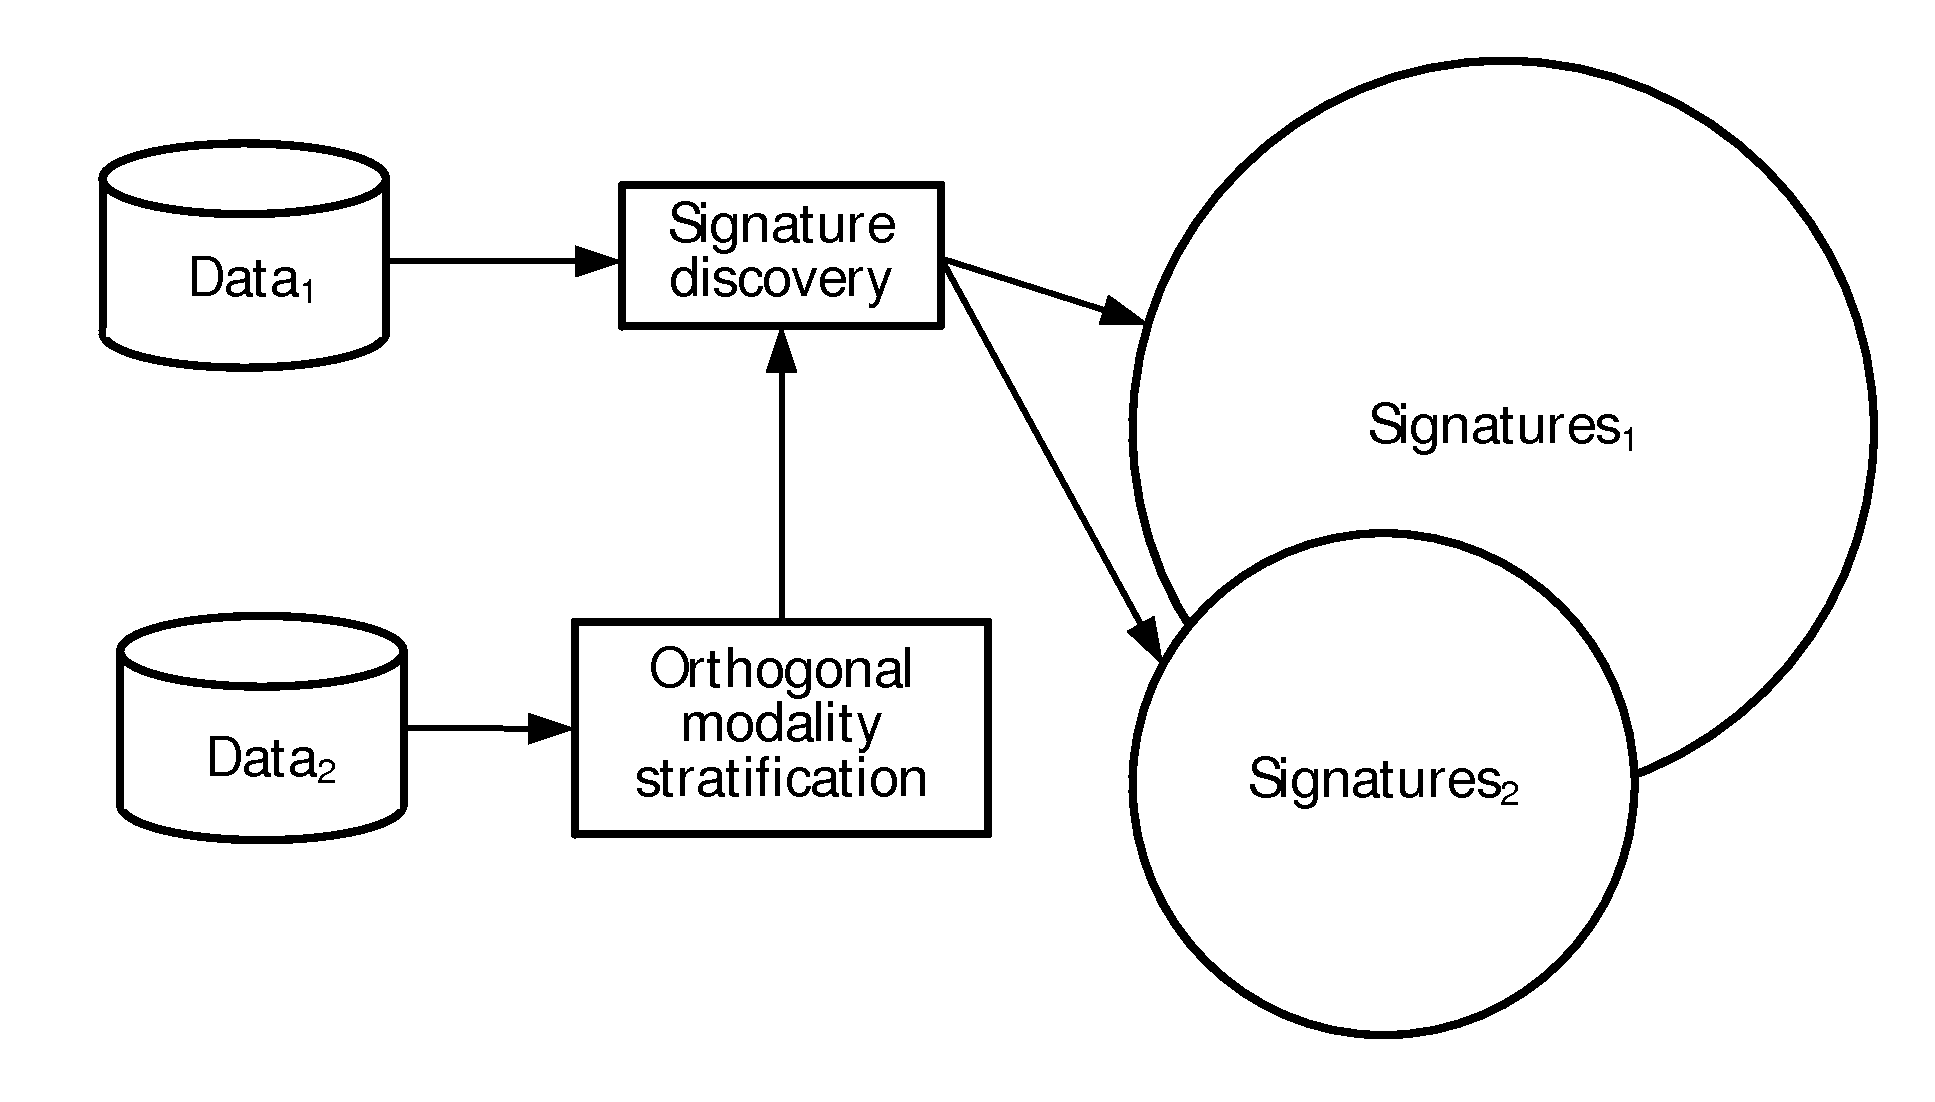
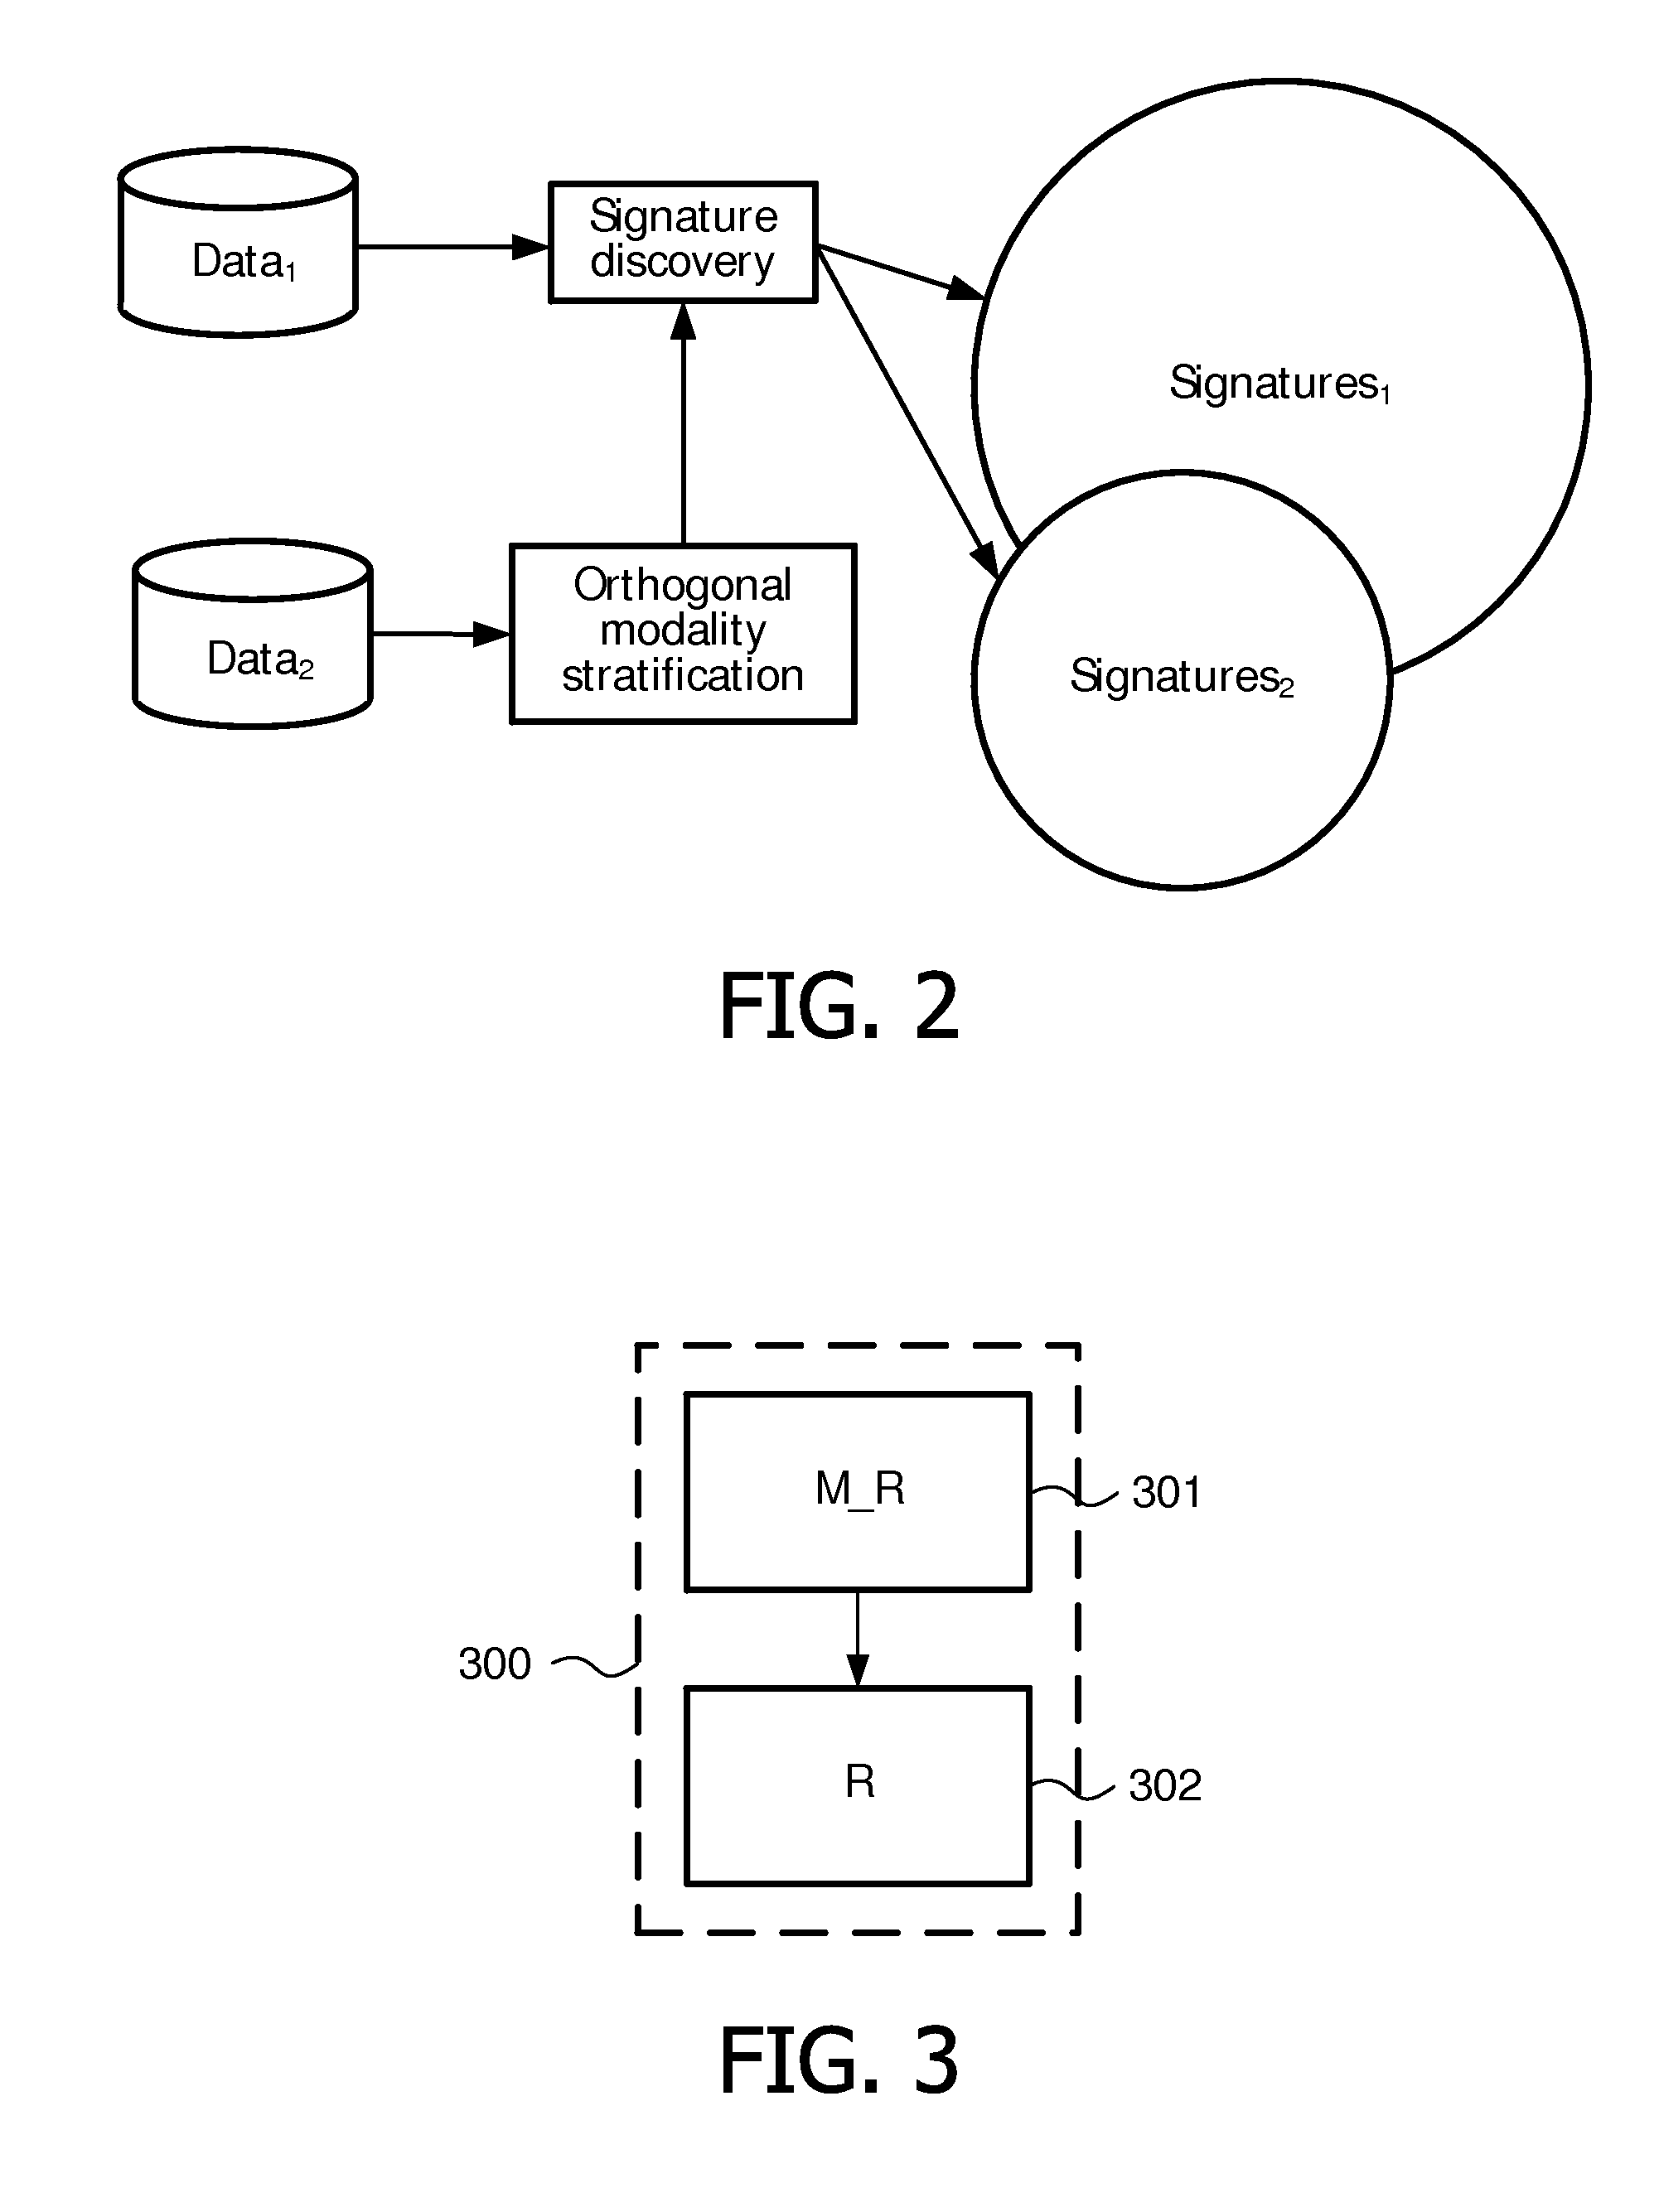
[0064]This may be referred to as SIMILARITY(ANALYSIS, REF), SIMILARITY(ANALYSIS, PARALLEL), and SIMILARITY(ORTHOGONAL, REF). The reliability indicator is then determined by comparing the results from these calls. In the previous examples, the similarity was based on SIMILARITY(ANALYSIS, ORTHOGONAL).

[0065]The example for table III discloses the scenario where simultaneously compare 3 (or more) stratifications are being compared, or a MULTI-SIMILARITY(i, ri1>, i, ri2>, i, ri3>, . . . ), where it is possible to define the similarity by comparing the input stratifications. The reliability here could actually be same as the similarity, i.e. it may be referred as MULTI-SIMILARITY(ANALYSIS, PARALLEL, REF) as an example.

[0066]It should be noted that the signatures might be more consistent with the “true value” and totally inconsistent with the parallel...


PUM


Abstract

This invention relates to a method and an apparatus for determining a reliability indicator for at least one set of signatures obtained from clinical data collected from a group of samples. The signatures are obtained by detecting characteristics in the clinical data from the group of sample sand each of the signatures generate a first set of stratification values that stratify the group of samples. At least one additional and parallel stratification source to the signatures obtained from group of sample sis provided, the at least one additional and parallel stratification source to the signatures being independent from the signatures and generates a second set of stratification values. A comparison is done for each respective sample, where the first stratification values are compared with a true reference stratification values, and where the second stratification values are compared with the true reference stratification values. The signatures are assigned with similarity measure indicators indicating whether the first and the second stratification values match with the true reference stratification values. These are then implementing as input in determining the reliability of the signatures.

Description

FIELD OF THE INVENTION[0001]The present invention relates to a method and an apparatus for determining a reliability indicator for at least one set of signatures obtained from clinical data collected from a group of samples, the signatures being obtained by detecting characteristics in the clinical data from the group of samples, where each of the signatures generate a first set of stratification values that stratify the group of samples.BACKGROUND OF THE INVENTION[0002]High-throughput molecular measurements are often subjected to analyses for the purpose of clinical applications to identify patterns in datasets that help stratify biological samples. One such application is a selection of feature subsets, e.g. from gene expression data, that can be used as diagnostic signatures for a particular category of patients. Such diagnostic signatures may be used for clinical diagnosis of disease, disease staging and / or therapy choice (e.g. positive and negative response of a therapy regimen...

Claims


Application Information

Patent Timeline
IPC IPC(8): G06F17/30G16B40/00
CPCG06F19/345G06F19/24G16H50/70G16H50/20G16B40/00
Inventor JANEVSKI, ANGELBANERJEE, NILANJANAALSAFADI, YASSERVARADAN, VINAY
Owner KONINKLIJKE PHILIPS ELECTRONICS NV
Why Eureka
Try Eureka