System and Method for Geographic Based Data Visualization and Extraction

a geographic and data visualization and extraction technology, applied in the field of system and method for geographic based data visualization and extraction, can solve the problems of costing users both time and money, lack of advanced spatial/temporal analytical tools such as time series analysis, 3-d visualization, and combined point/polygon thematic mapping

Active Publication Date: 2011-11-03
PARKER CHERYL
View PDF2 Cites 266 Cited by
  • Summary
  • Abstract
  • Description
  • Claims
  • Application Information

AI Technical Summary

Problems solved by technology

No single method, system, or software currently satisfies all the needs, forcing users to combine several technologies, thereby costing users both time and money.
Business Analyst Online's analytical capacity is limited however, in that it only offers business information for the current year, only provides users with the ability to specify a radius-around-a-point in order to run a summary, and only offers polygonal thematic mapping that shows data distributed at an aggregated level, but not a disaggregate one.
The tool lacks more advanced spatial / temporal analytical tools such as those for time series analysis, 3-D visualization, local area aggregated reports for selected census areas, and combined point / polygon thematic mapping.
Other web GIS services such as the “Urban EcoMap” tool, a collaborative effort involving Cisco IBSG and San Francisco's Department of the Environment, provide aggregated area reports and thematic polygonal mapping, but are limited in that (1) they only show data at an aggregated level with no point map layers, (2) data are only displayed for one type of geographic boundary, usually postal codes, and do not re-aggregate for smaller / larger geographies based upon zoom level and (3) they are not time series-based.
Either one of these limitations can lead to users (1) purchasing more data than necessary because lists are priced by number of records and, possibly, (2) buying the wrong set of data, given that users cannot see the corresponding mapped data prior to purchase.
While useful for finding an establishment to visit, these search engines are limited in what they offer analysts.
For example, users are not able to download / extract a list of data points, cannot view an aggregated summary of the data elements, such as an industry sector distribution report that includes a breakdown of businesses, jobs and sales per each industry sector, there is no ability to do polygonal thematic mapping, and there is no ability to do time series or 3-D analysis.

Method used


Image

  • System and Method for Geographic Based Data Visualization and Extraction
  • System and Method for Geographic Based Data Visualization and Extraction
  • System and Method for Geographic Based Data Visualization and Extraction

Examples


Embodiment Construction

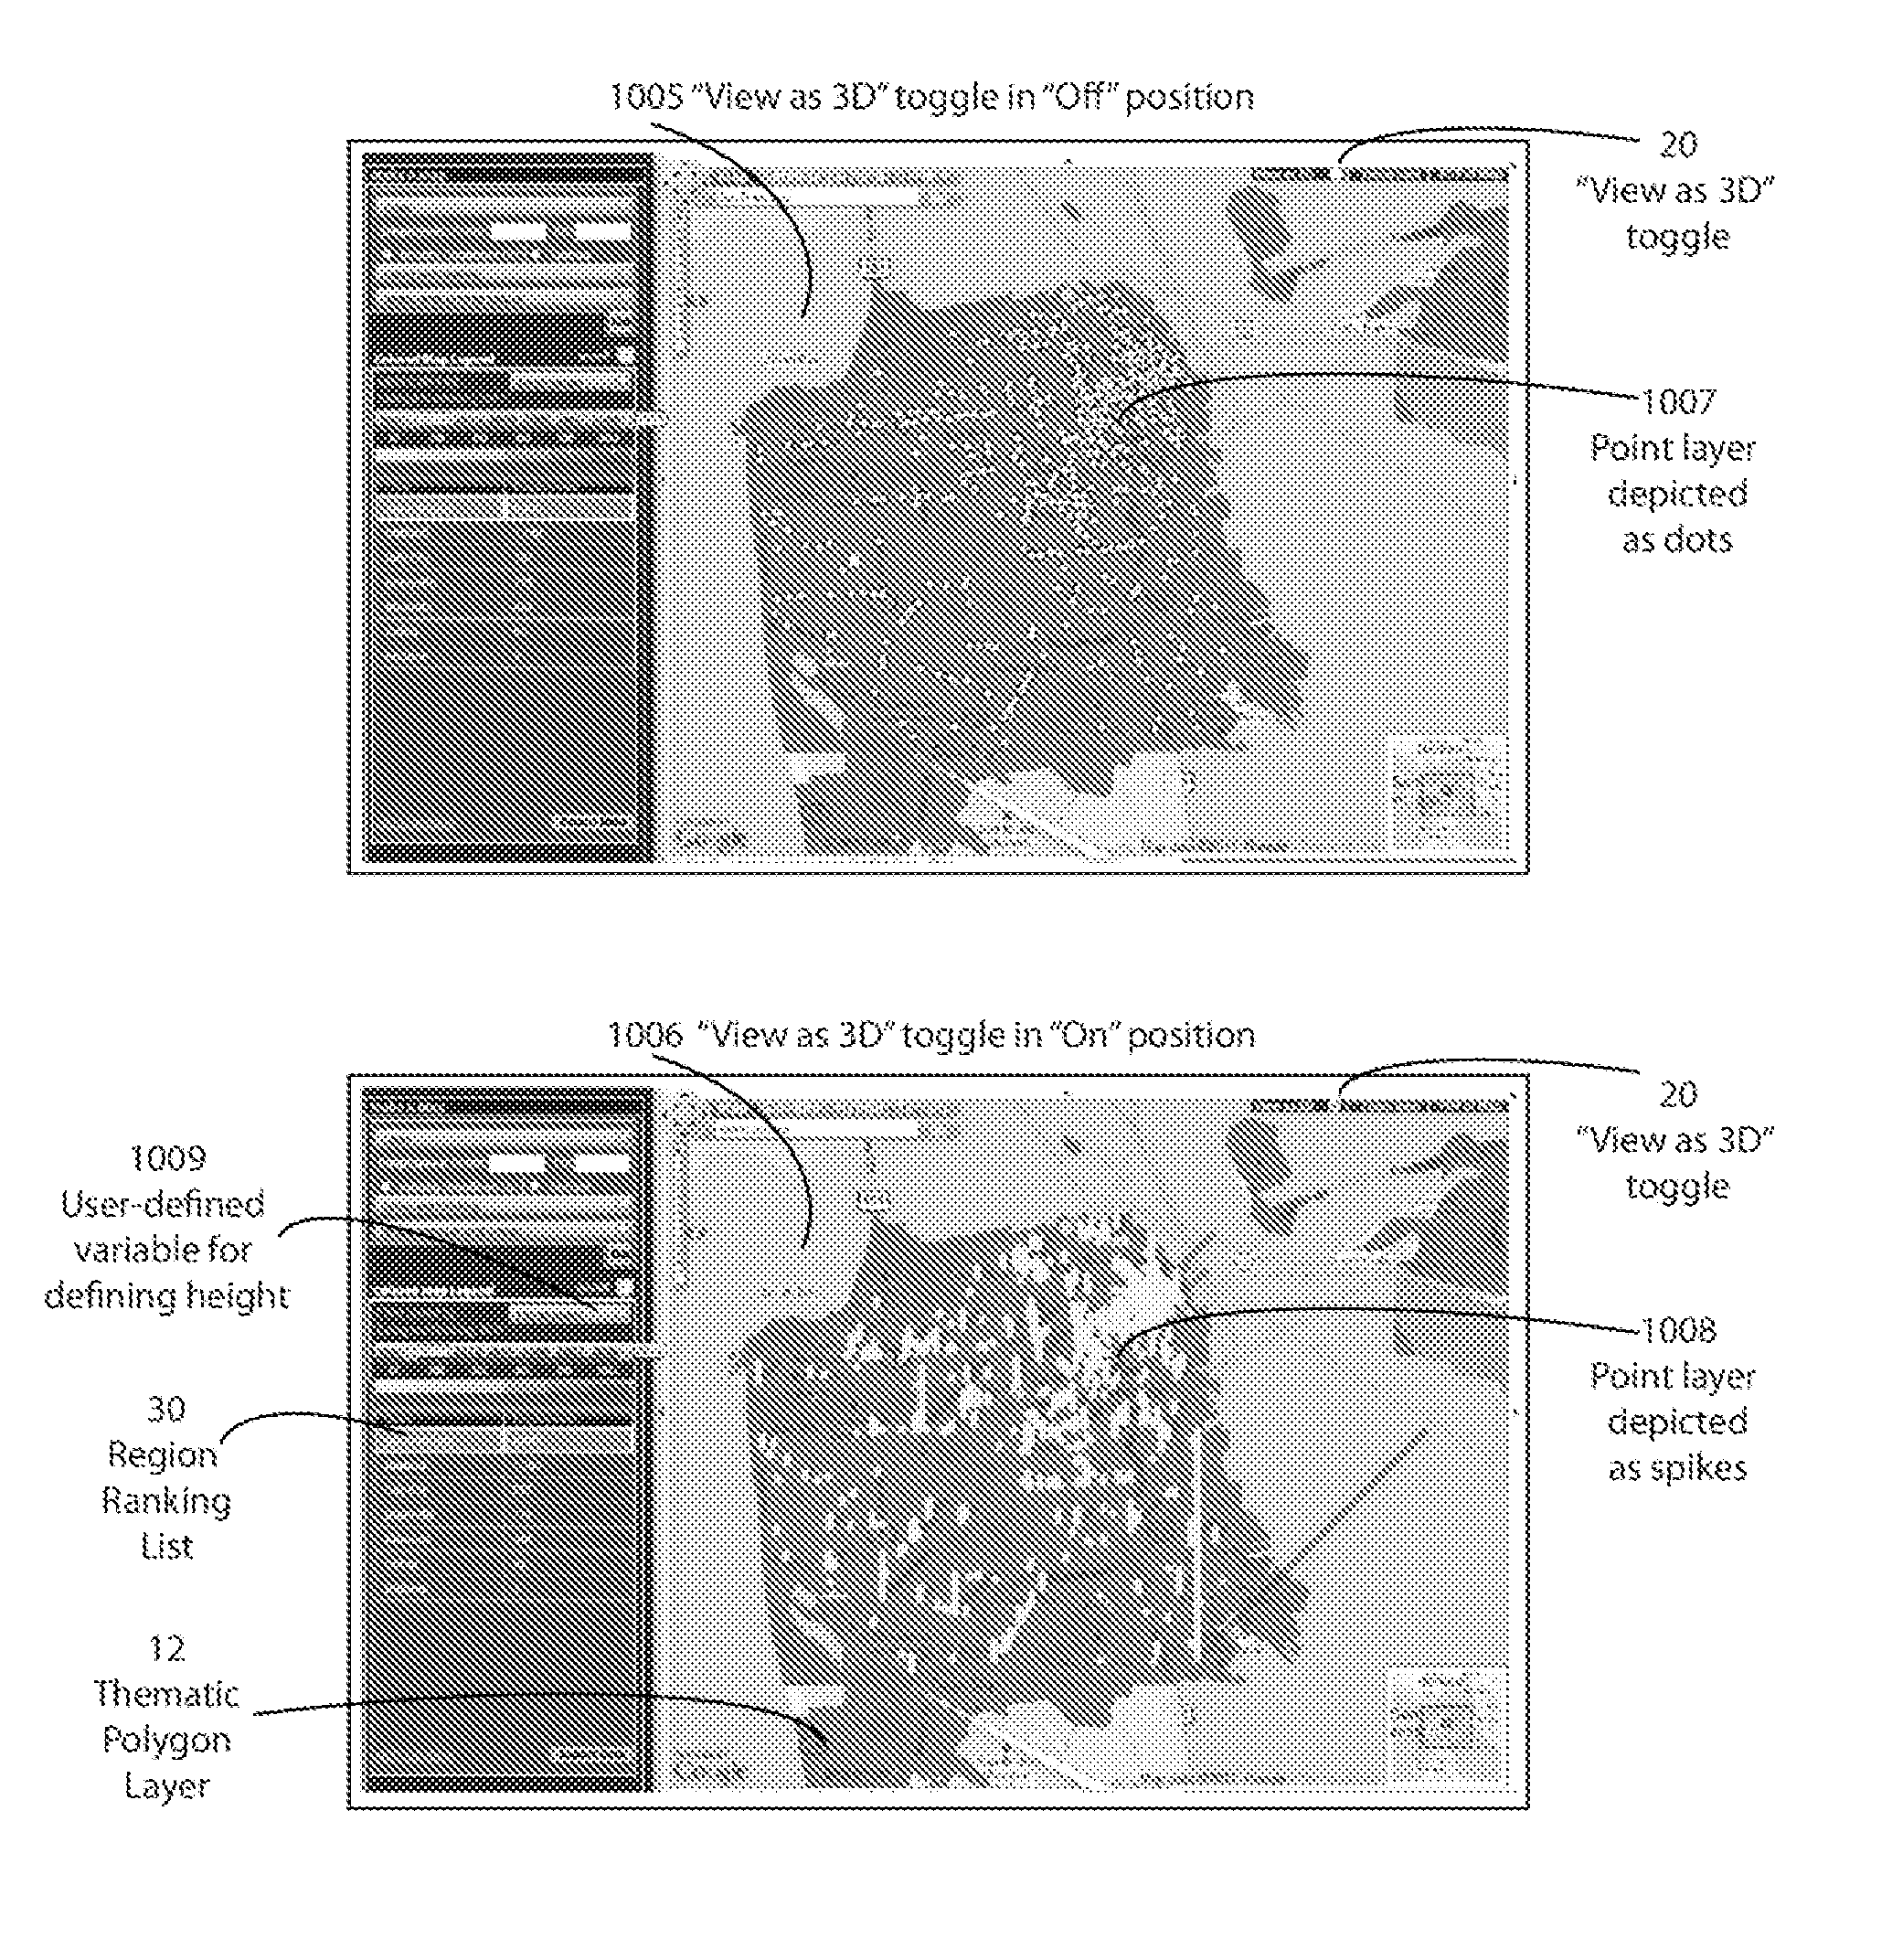
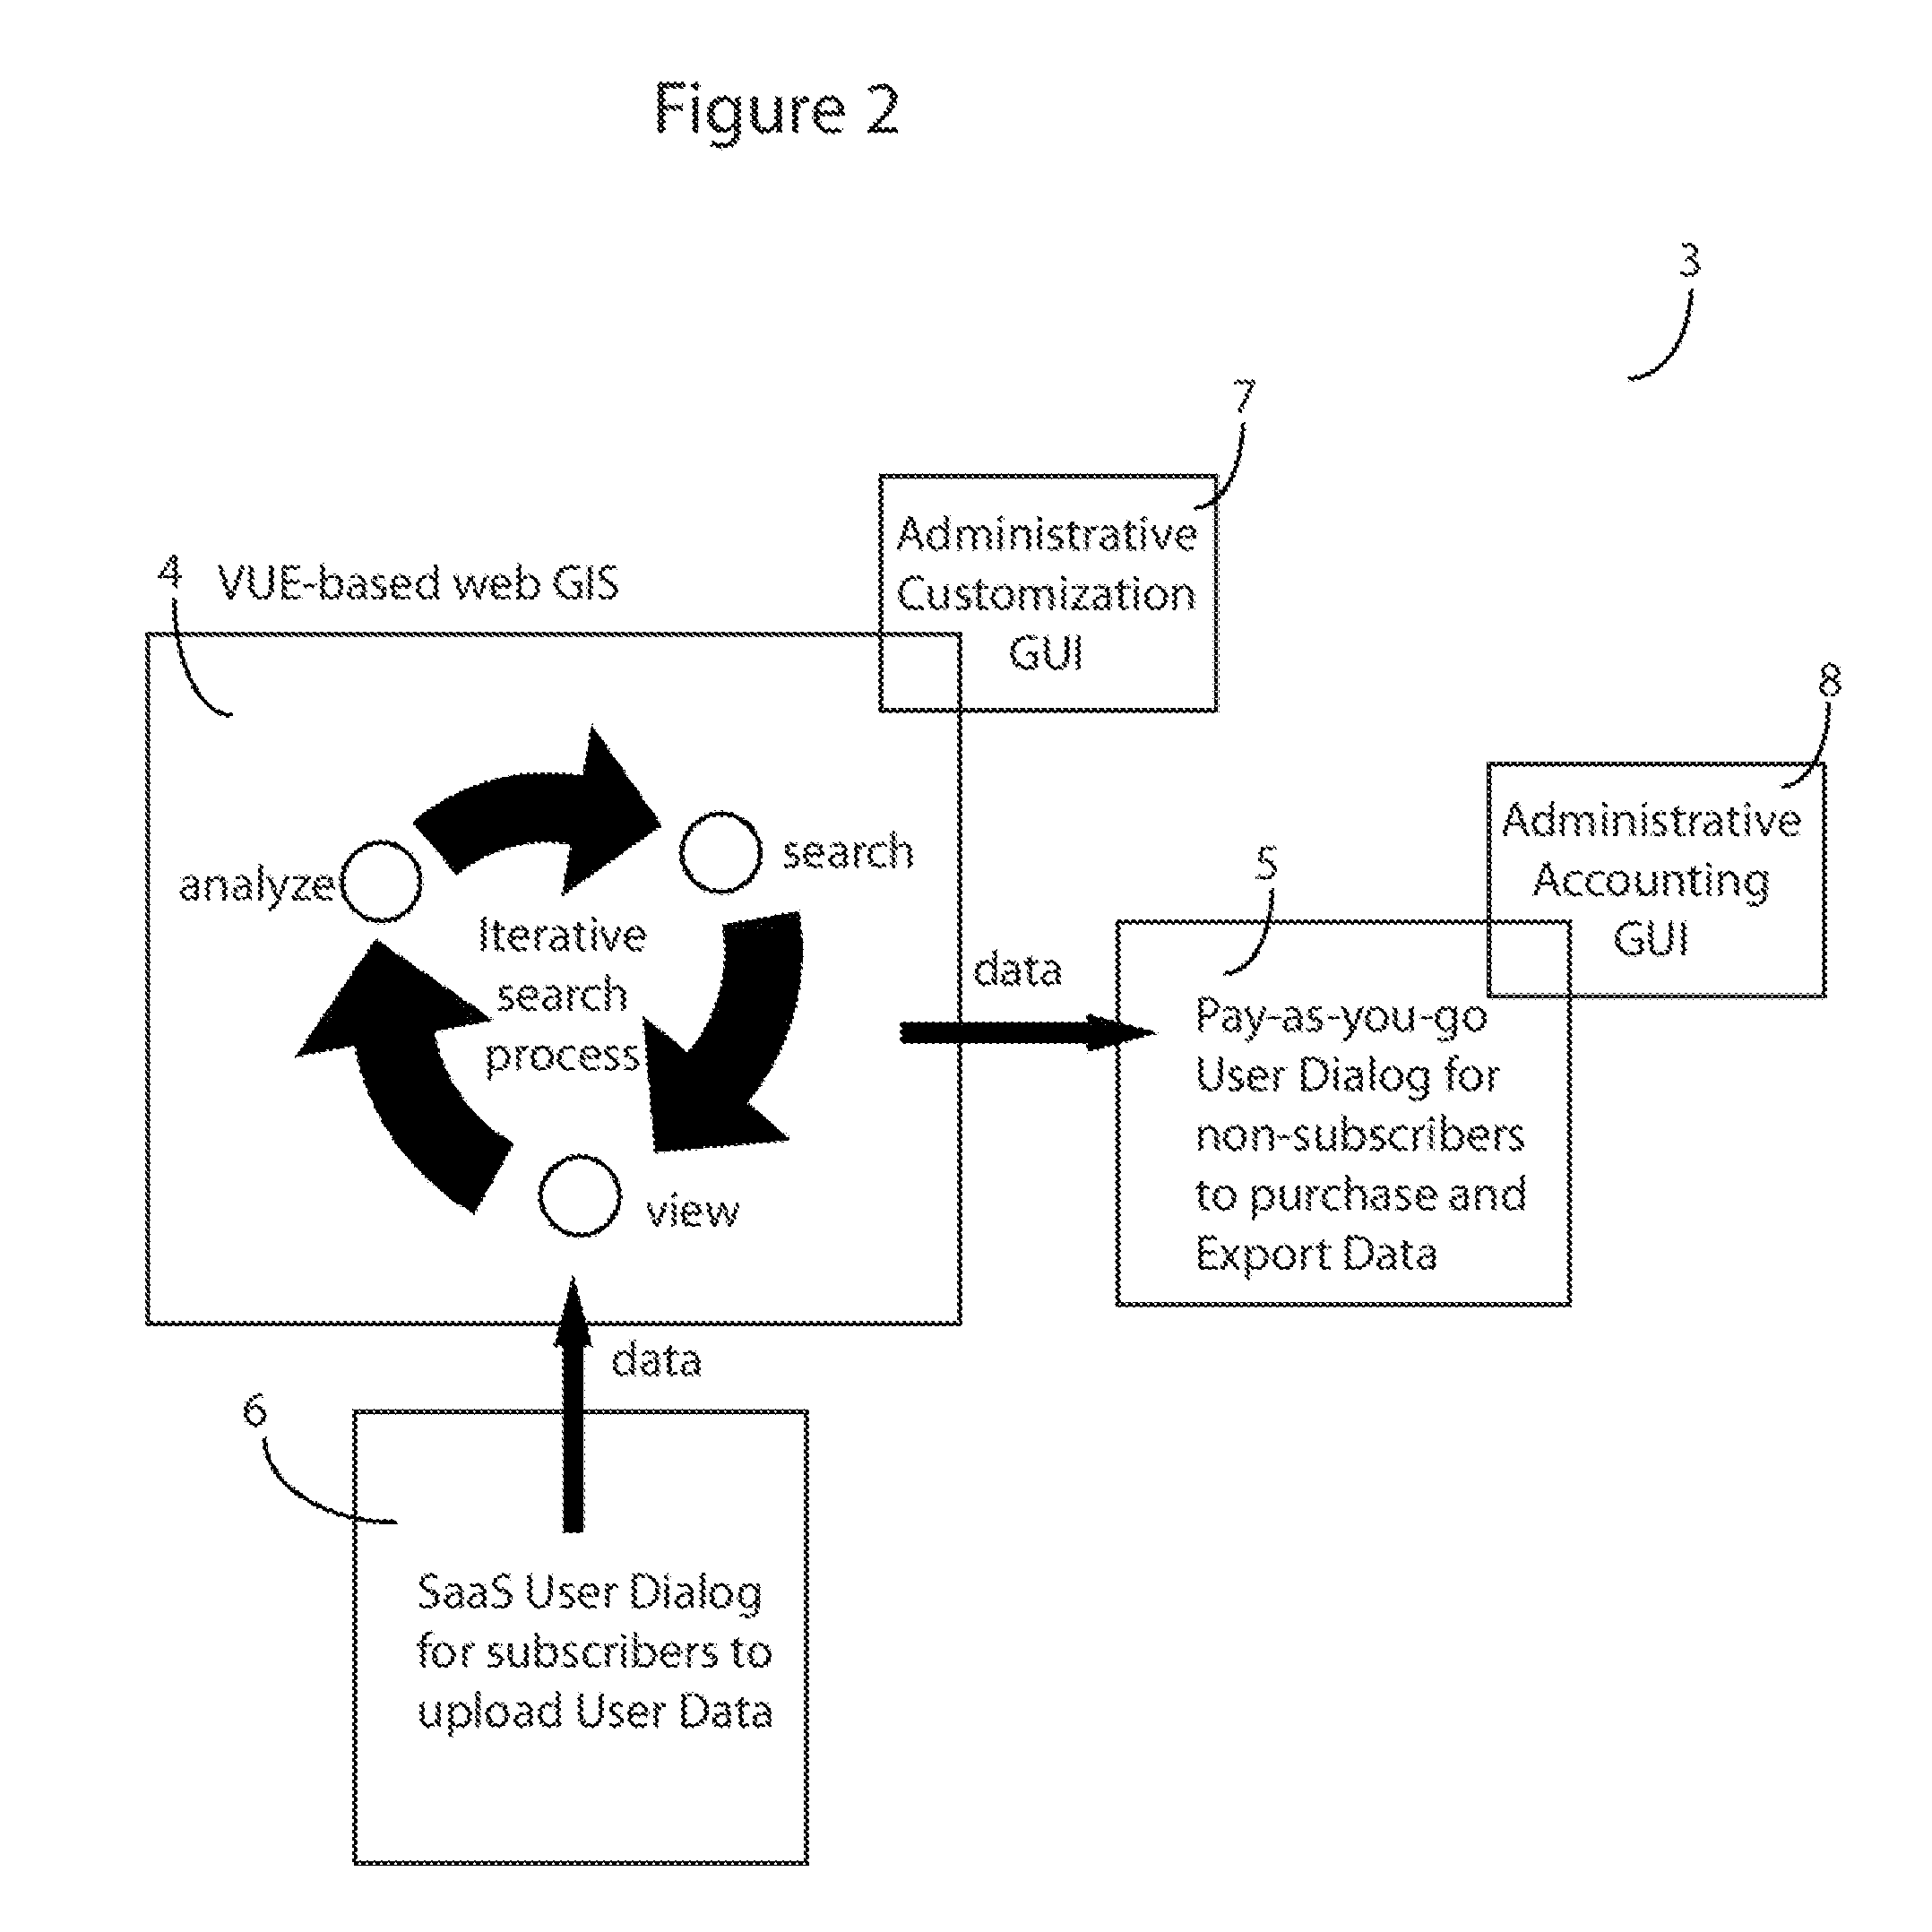
[0040]A present invention embodiment includes a system that weds a web GIS system with both an e-commerce interface for selling address-based datasets and a Software as a Service (SaaS) interface for uploading / editing local datasets. The system adds value to both web GIS and e-commerce (1) by providing GIS spatial and temporal analysis tools to e-commerce websites for address-related data, such that users are able to view address-based datasets in a spatial / temporal context prior to purchasing, and (2) by bringing sophisticated yet user-friendly GIS analysis tools to a consumer market.

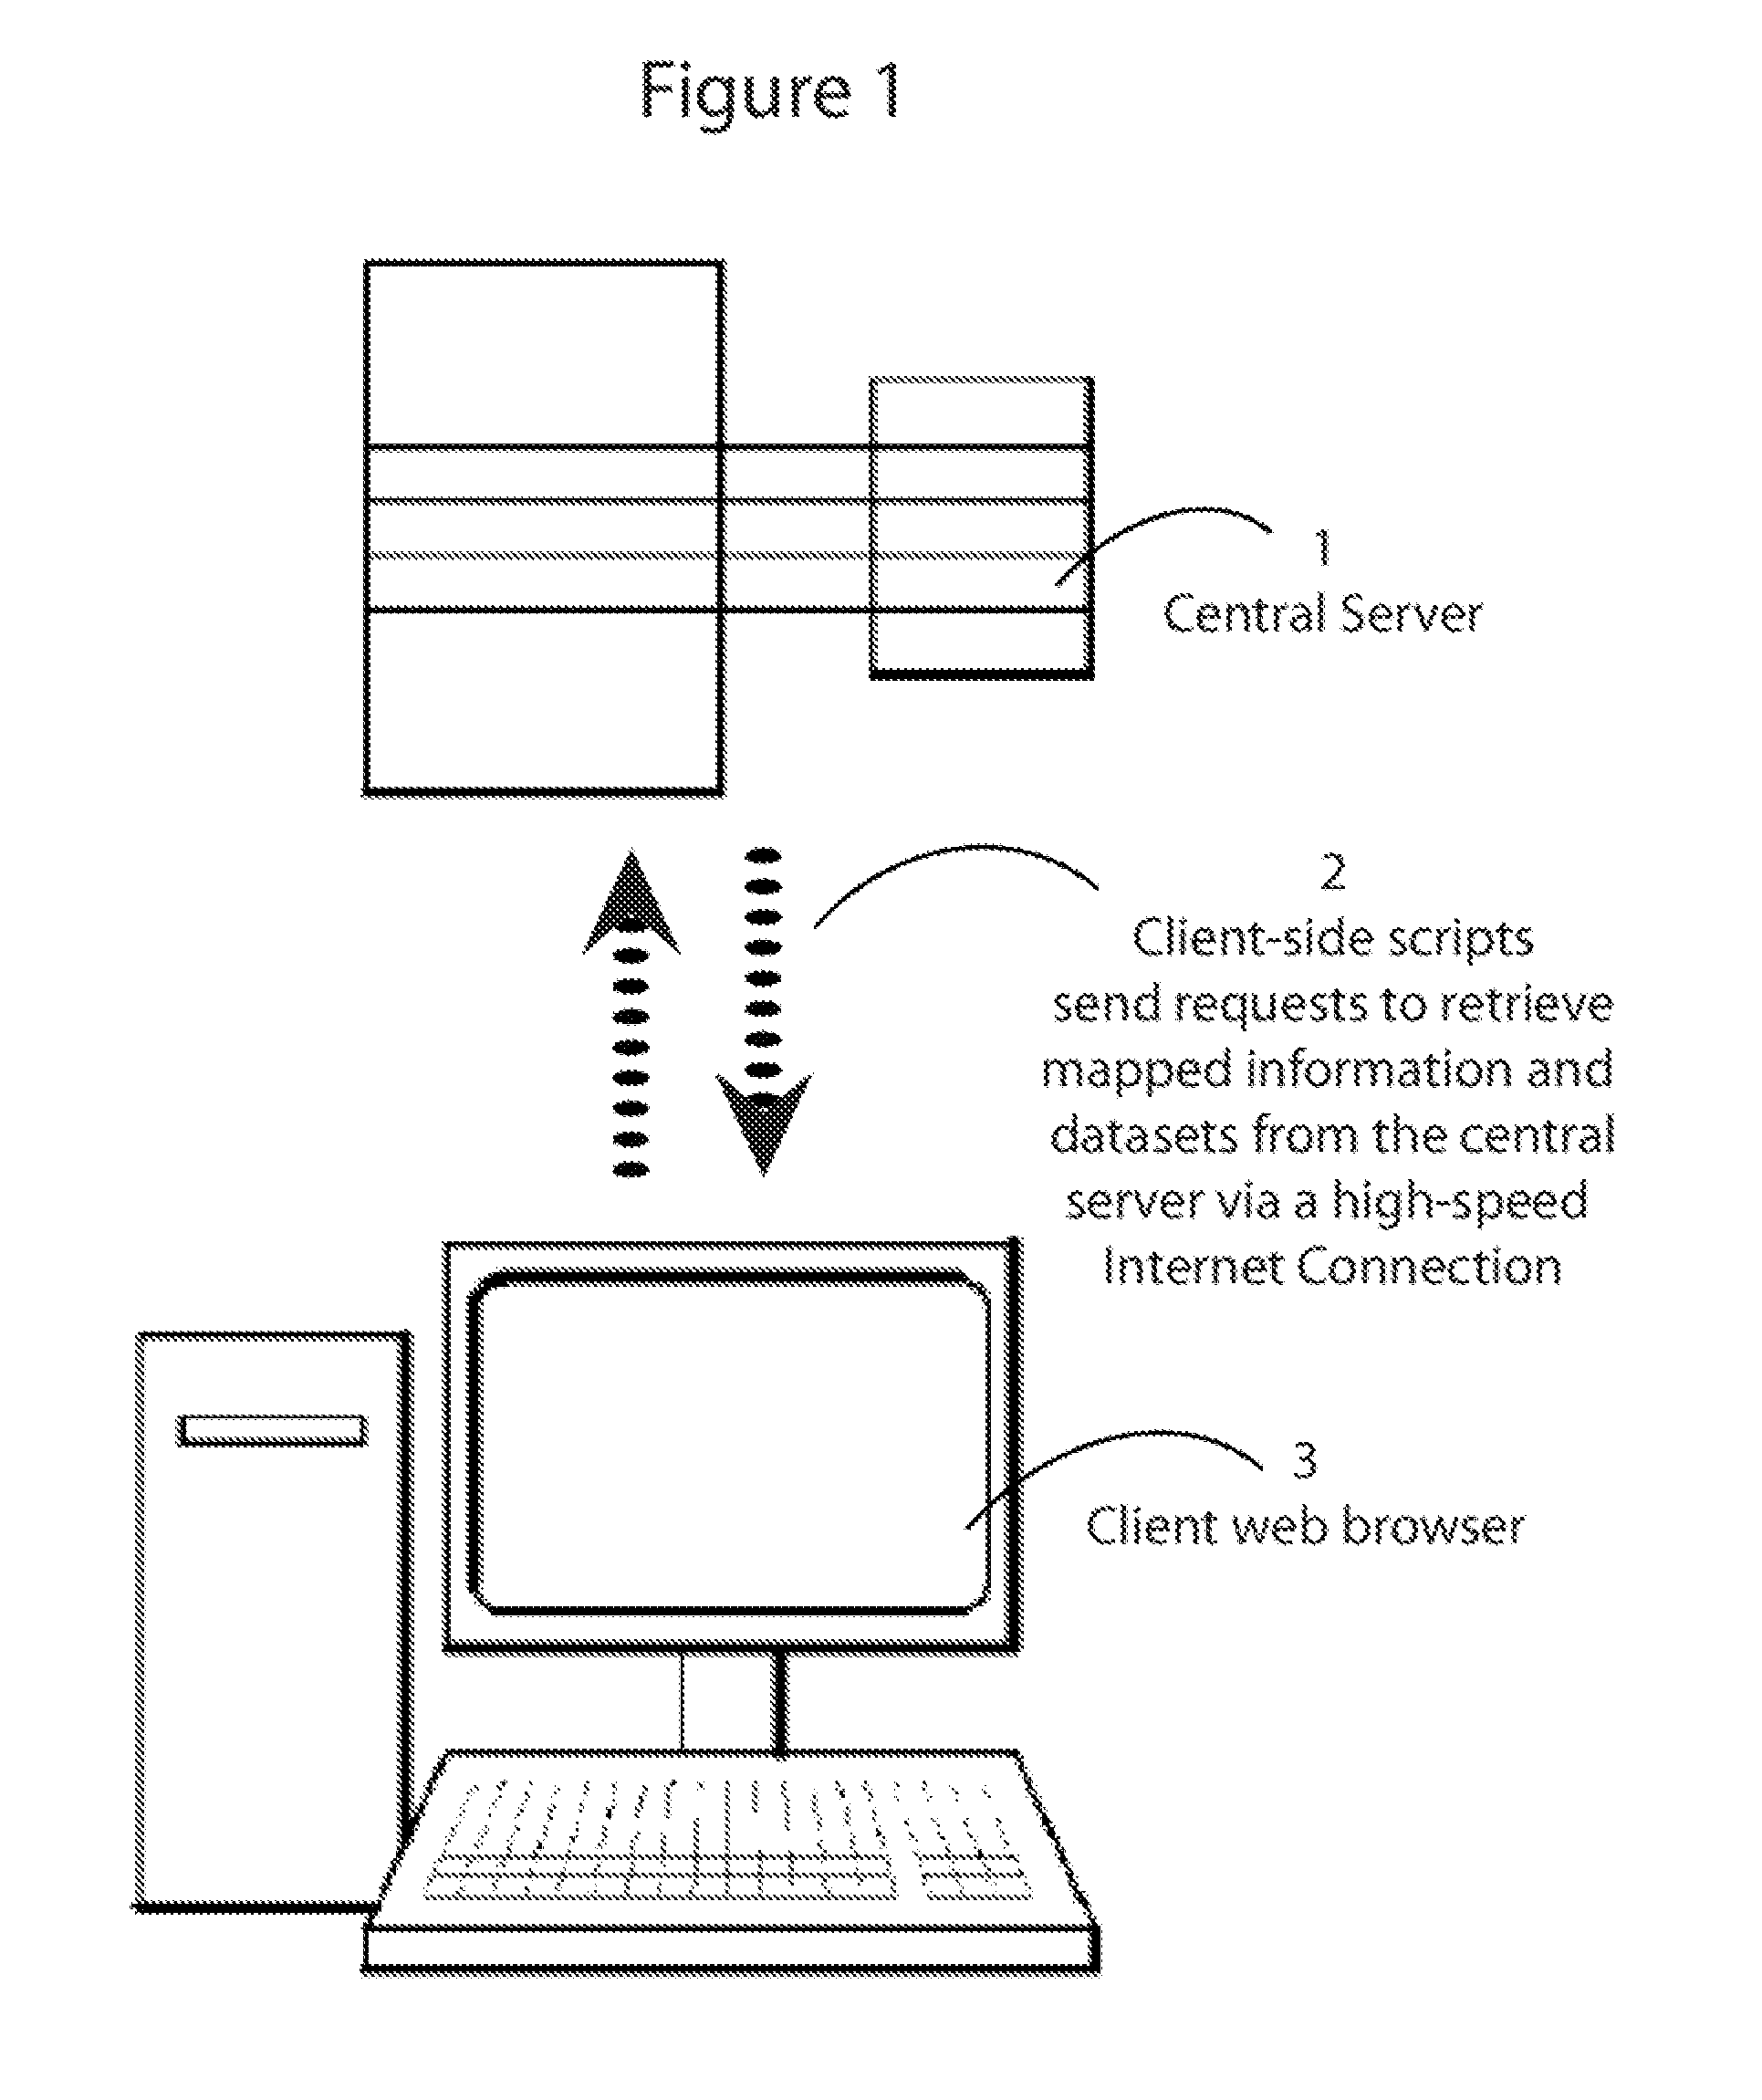
[0041]As shown in FIG. 1, the present invention may be implemented by a central server 1 or the like and is available as a fully functioning software system available via most any web browser 3 or the like on a computer system or the like. All major databases for the system reside on the central server 1 and are passed to the client web browser 3 via a high speed Internet connection or the like. More p...


PUM


Abstract

A displayed map is overlaid with a map-based graphical user interface (GUI). The GUI provides one or more related translucent views corresponding to the displayed map, where each view is associated with a dataset. The GUI also provides interlocked queries and analysis tools to probe the dataset. Each view comprises a polygon layer corresponding to the displayed map and a point layer corresponding to the displayed map, where the polygon layer and the point layer work in tandem to simultaneously display both aggregated and disaggregated data across the displayed map. A selection of a specific item of the point layer or a sub-region of the polygon layer is received from the user. In response, both the point layer and the polygon layer are modified so as to provide additional selectable information corresponding to the received selection and also additional selectable information that may be of interest to the user.

Description

CROSS-REFERENCE TO RELATED APPLICATION[0001]The present application claims priority from U.S. Provisional Pat. Application No. 61 / 329,321, filed on Apr. 29, 2010, which is hereby incorporated by reference in its entirety.TECHNICAL FIELD[0002]The present invention embodiments include a method, system, and software stored on a tangible memory which combines a web Geographic Information System (GIS), a mapping service, an e-commerce interface for selling address-based datasets and a Software as a Service (SaaS) interface for uploading user datasets.BACKGROUND OF THE INVENTION[0003]The invention as set forth in the present disclosure combines aspects of 3 fields: (1) web GIS software, (2) e-commerce for address-based datasets and lists (such as business lists, job listings, real estate listings, etc), and (3) local search via web mapping services (such as Google Maps, YaHoo Local Maps or Bing Maps). The invention also introduces time-series and 3-D (three dimensional) thematic visualiza...

Claims


Application Information

Patent Timeline
Patent Type & Authority Applications(United States)
IPC IPC(8): G06Q30/00G06F3/048
CPCG06F17/30241G06Q30/0641G06Q30/0623G06Q30/0603G06F16/29
Inventor PARKER, CHERYL
Owner PARKER CHERYL
Why Eureka
Try Eureka