Causal modeling of multi-dimensional hierachical metric cubes
a hierachical metric and cube technology, applied in the field of hierachical metric cubes, can solve the problems that business analysts have had increasing difficulty in identifying the “right” set of metrics
- Summary
- Abstract
- Description
- Claims
- Application Information
AI Technical Summary
Benefits of technology
Problems solved by technology
Method used
Image
Examples
Embodiment Construction
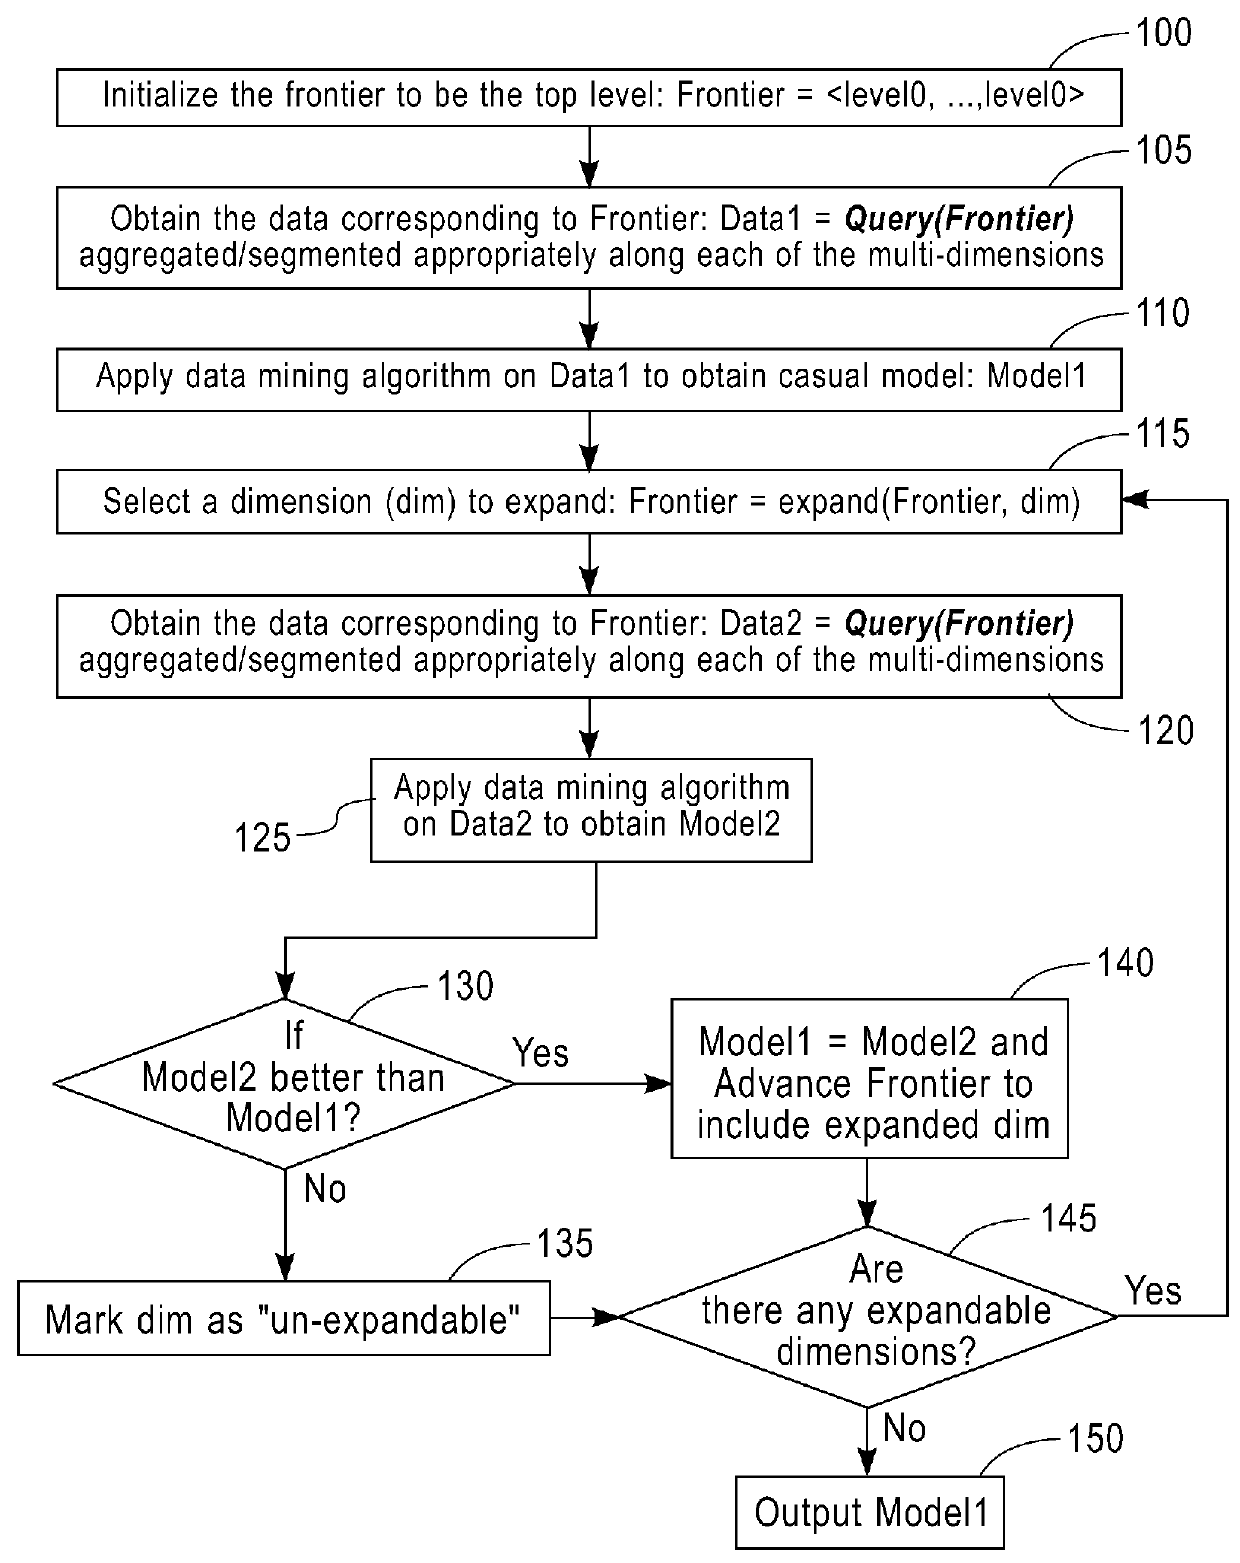
[0025]In one embodiment, the system and method for managing performance of an entity include, but are not limited to, a construction of a “graphical model” or a “causal graph” (e.g., a data structure 960 in FIG. 9a) that includes metrics (e.g., nodes in FIG. 9a) and their relationships (e.g., edges in FIG. 9a). A causal graph is a graph that includes nodes, which represent metrics, and edges between the nodes. An edge in a causal graph represents the presence of a directed relationship, optionally with an associated quantity referred to herein as “causal strength”. A causal strength may represent the degree to which a node affects another node. Normally, a node and its associated metric at the source of the edge are referred to as a “source”, “cause” or “parent”. A node and its associated metric at the other end of the edge are referred to as a “target”, “effect” or “child”. A graphical model comprises a causal graph (i.e., a graph that captures relationships between the cause(s) an...
PUM
 Abstract
Description
Claims
Application Information
 - R&D
- Intellectual Property
- Life Sciences
- Materials
- Tech Scout
- Unparalleled Data Quality
- Higher Quality Content
- 60% Fewer Hallucinations
Browse by: Latest US Patents, China's latest patents, Technical Efficacy Thesaurus, Application Domain, Technology Topic, Popular Technical Reports.
© 2025 PatSnap. All rights reserved.Legal|Privacy policy|Modern Slavery Act Transparency Statement|Sitemap|About US| Contact US: help@patsnap.com


