Method and system for presenting a visual representation of the portion of the sets of data that a query is expected to return

a technology of user interface and data set, applied in the field of presenting relationships in user interfaces of databases, can solve the problems of bewildering or error-prone process of constructing relationships, conventional database approaches to entering relationships confuse users, and achieve the effect of improving understanding and being easier to use and/or understand

Active Publication Date: 2012-07-26
SALESFORCE COM INC
View PDF4 Cites 176 Cited by
  • Summary
  • Abstract
  • Description
  • Claims
  • Application Information

AI Technical Summary

Benefits of technology

[0012]In an embodiment, a representation of a report (which may be referred to as a report representation) that is expected to be generated by the report type that is being defined by the user is also provided. For example, a thumbnail sketch of what the report (that results from the report type) is expected to look like is shown in conjunction with the data representation. The term report type may refer to an engine that determines what end-users will see in a report generation wizard under a Reports tab. In an embodiment, the report representation may include representations of columns or blocks of data. In an embodiment, a correspondence is indicated between elements of the report representation (e.g., columns in the thumbnail sketch) and the data representations (that represent data objects). For example, a given column of a report representation may have the same coloring and / or shading as the corresponding data representation (e.g., the corresponding ovals). These mechanisms and methods for providing an interface for object relationships can enable embodiments to provide an interface that is easier to use and / or understand. The ability of embodiments to provide a data representation and / or a report representation can enable the user to better understand the relationship that the user defined.

Problems solved by technology

Unfortunately, conventional database approaches to entering a relationship confuse the user.
For example, when presented with the ability to select and relate data objects for the purpose of building reports, it can be difficult to understand the resulting data set and how it might be represented in a report.
As a result, the process of constructing these relationships can be bewildering or error-prone.
Even when the error is obvious from looking at the report, it may take several tries before the relationship is debugged and corrected.

Method used


Image

  • Method and system for presenting a visual representation of the portion of the sets of data that a query is expected to return
  • Method and system for presenting a visual representation of the portion of the sets of data that a query is expected to return
  • Method and system for presenting a visual representation of the portion of the sets of data that a query is expected to return

Examples


Embodiment Construction

General Overview

[0036]Systems and methods are provided for providing an interface for object relationships.

[0037]As used herein, the term multi-tenant database system refers to those systems in which various elements of hardware and software of the database system may be shared by one or more customers. For example, a given application server may simultaneously process requests for a great number of customers, and a given database table may store rows for a potentially much greater number of customers. As used herein, the term query plan refers to a set of steps used to access information in a database system.

[0038]Next, mechanisms and methods for providing one or more methods and systems for providing an interface for object relationships will be described with reference to example embodiments.

System Overview

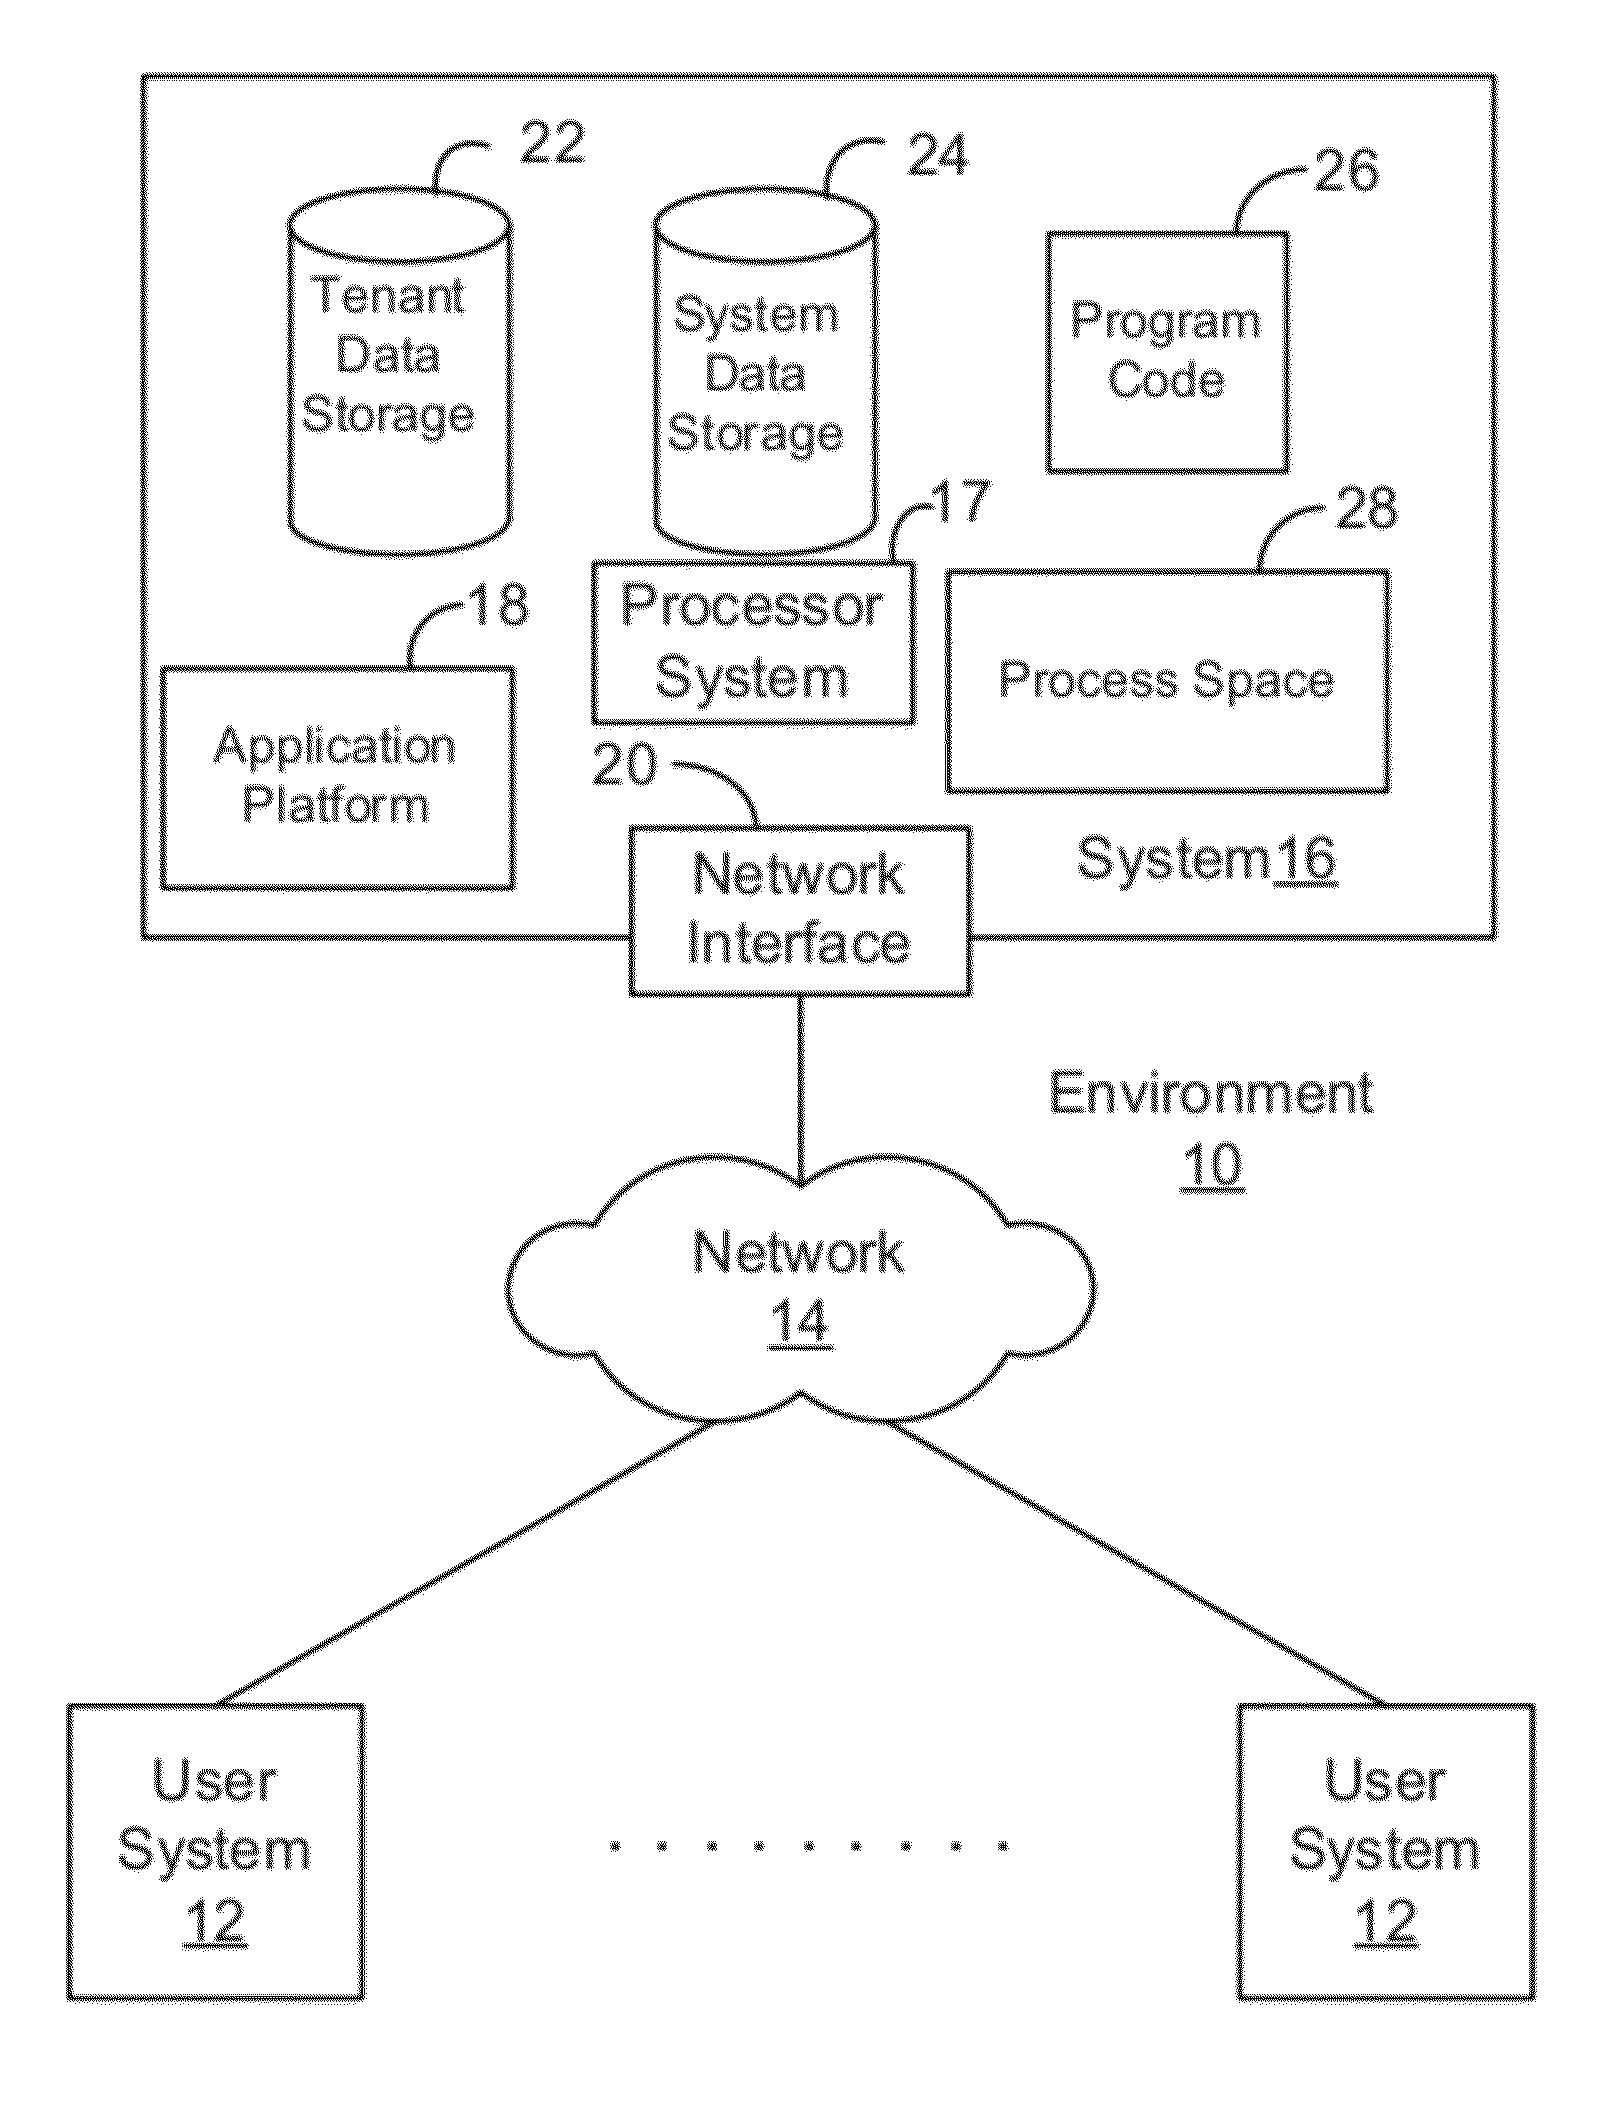
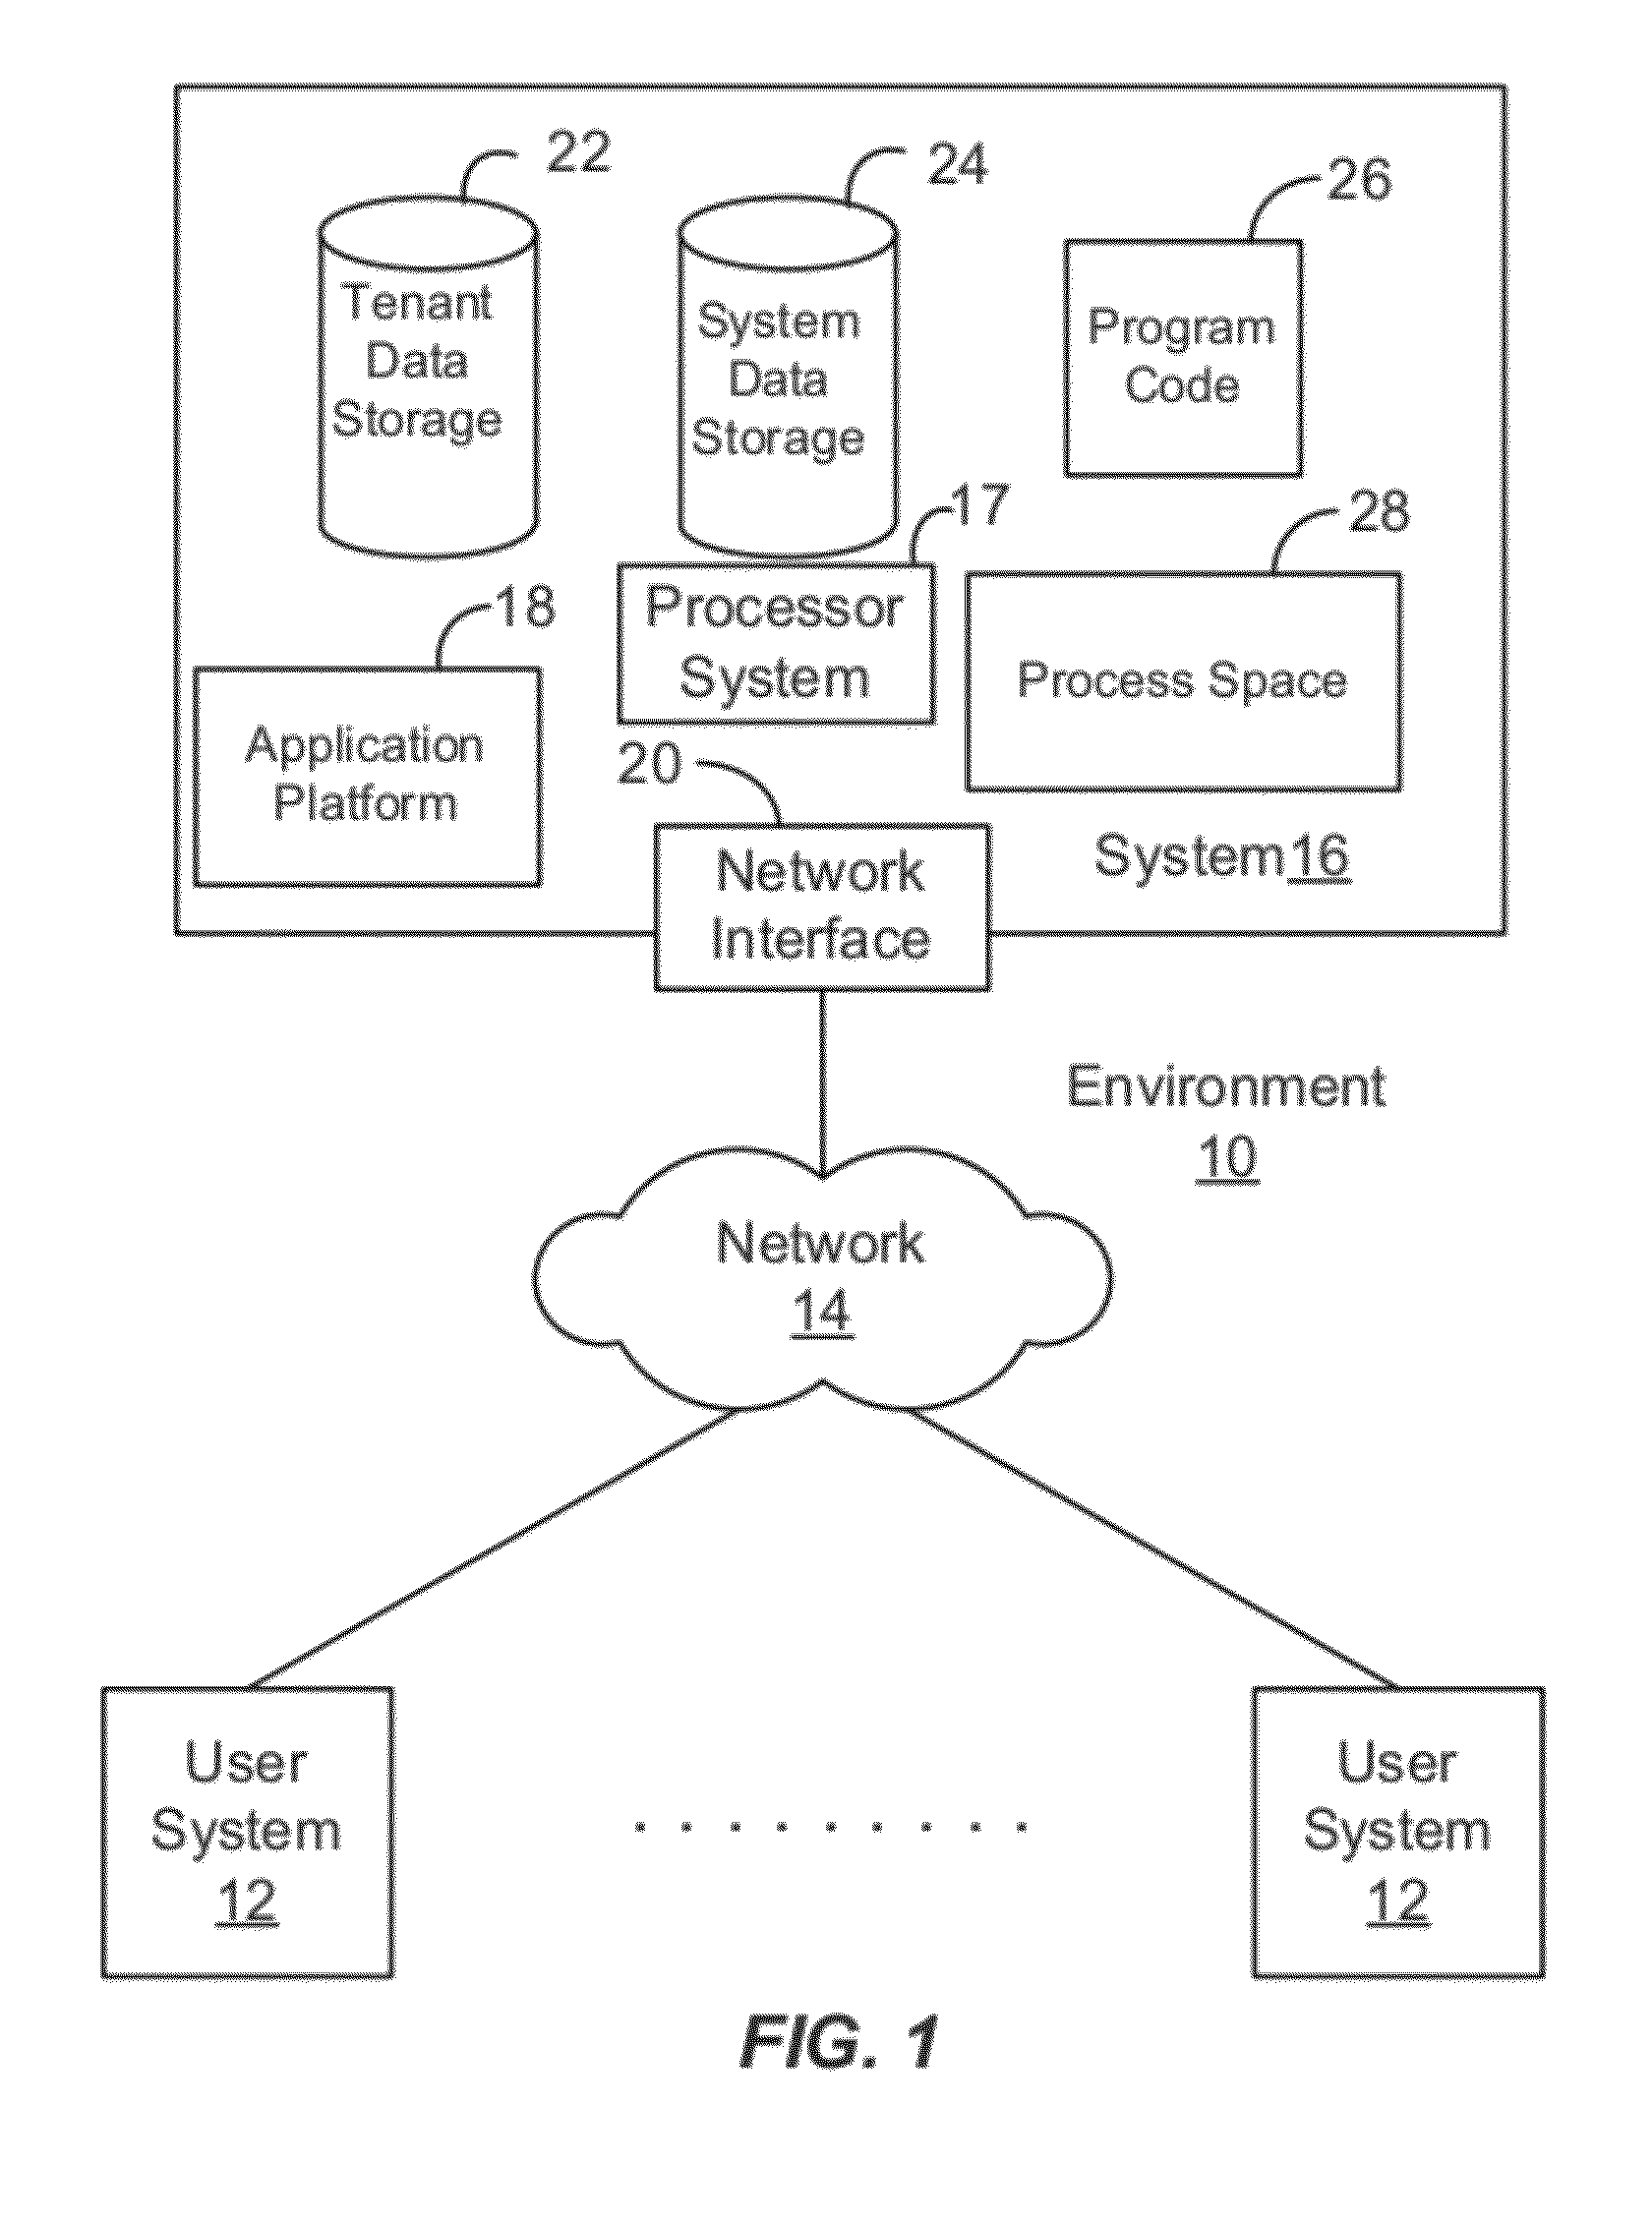
[0039]FIG.1 illustrates a block diagram of an environment 10 wherein an on-demand database service might be used. Environment 10 may include user systems 12, network 14, system...


PUM


Abstract

In an embodiment, a user is provided with a data representation covered by a relationship. For example, the data representation may include a collection of data objects representations. In an embodiment, the data object representations are arranged in a manner so as to indicate rows or records of different data objects that are associated with one another. In an embodiment, portions of the data objects in the collection are indicated as representing the data that is covered by the relationship. In an embodiment, a report representation that is expected to be generated by the report type defined by the user defined relationship is also provided. In an embodiment, a correspondence in indicated between elements of the report representation (e.g., columns in a thumbnail sketch of a report) and the data object representations (e.g., ovals in a Venn diagram).

Description

CLAIM OF PRIORITY[0001]This application is a continuation of U.S. patent application Ser. No. 11 / 701,316, entitled “METHOD AND SYSTEM FOR PRESENTING A VISUAL REPRESENTATION OF THE PORTION OF THE SETS OF DATA THAT A QUERY IS EXPECTED TO RETURN,” by Margaret T. Law, filed Jan. 31, 2007, Attorney Docket No. 48-1 / 040US, which is incorporated herein by reference in its entirety.CROSS REFERENCE TO RELATED APPLICATIONS[0002]The following commonly owned, co-pending United States Patents and Patent Applications, including the present application, are related to each other. Each of the other patents / applications are incorporated by reference herein in its entirety:[0003]U.S. patent application Ser. No. 13 / ______, entitled “METHOD AND SYSTEM FOR PRESENTING A VISUAL REPRESENTATION OF THE PORTION OF THE SETS OF DATA THAT A QUERY IS EXPECTED TO RETURN,” by Margaret T. Law, filed Mar. 29, 2012 Attorney Docket No. 48-80 / 040US2.COPYRIGHT NOTICE[0004]A portion of the disclosure of this patent documen...

Claims


Application Information

Patent Timeline
Patent Type & Authority Applications(United States)
IPC IPC(8): G06T11/20
CPCG06F17/30554G06F17/30389G06F16/242G06F16/248
Inventor LAW, MARGARET T.
Owner SALESFORCE COM INC
Why Eureka
Try Eureka